| Param | Original file | Final file |
|---|---|---|
| Filename | modeM0/AS1A06_006T01_9000002684_18078cztM0_level2.evt | modeM0/AS1A06_006T01_9000002684_18078cztM0_level2_quad_clean.evt |
| Size (bytes) | 507,202,560 | 116,138,880 |
| Size | 483.7 MB | 110.8 MB |
| Events in quadrant A | 3,935,223 | 793,590 |
| Events in quadrant B | 3,492,349 | 799,153 |
| Events in quadrant C | 3,274,806 | 754,337 |
| Events in quadrant D | 4,239,196 | 739,252 |
| Mode SS | |||
|---|---|---|---|
| Quadrant | BADHDUFLAG | Total packets | Discarded packets |
| A | 0 | 126 | 0 |
| B | 0 | 126 | 0 |
| C | 0 | 126 | 0 |
| D | 0 | 126 | 0 |
| Mode M9 | |||
|---|---|---|---|
| Quadrant | BADHDUFLAG | Total packets | Discarded packets |
| A | 0 | 13 | 0 |
| B | 0 | 13 | 0 |
| C | 0 | 13 | 0 |
| D | 0 | 13 | 0 |
| Mode M0 | |||
|---|---|---|---|
| Quadrant | BADHDUFLAG | Total packets | Discarded packets |
| A | 0 | 15766 | 1 |
| B | 0 | 14392 | 1 |
| C | 0 | 13658 | 1 |
| D | 0 | 16892 | 5 |
| Quadrant | Total seconds | Saturated seconds | Saturation percentage |
|---|---|---|---|
| A | 6178 | 247 | 3.998058% |
| B | 6178 | 140 | 2.266106% |
| C | 6178 | 169 | 2.735513% |
| D | 6177 | 219 | 3.545410% |
Noise dominated data is calculated using 1-second bins in cleaned event files. If a bin has >2000 counts, and if more than 50% of those come from <1% of pixels, then it is considered to be noise-dominated and hence unusable.
| Quadrant | # 1 sec bins | Bins with >0 counts | Bins with >2000 counts | High rate bins dominated by noise | Noise dominated (total time) | Noise dominated (detector-on time) | Marked lightcurve |
|---|---|---|---|---|---|---|---|
| A | 7448 | 6178 | 70 | 70 | 0.94% | 1.13% | 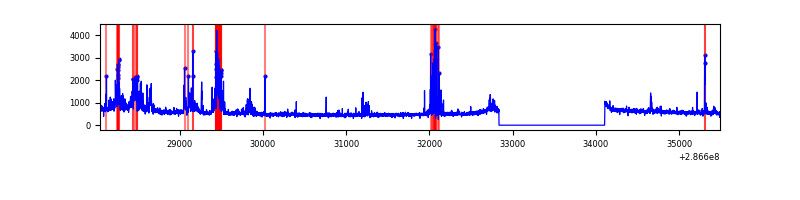 |
| B | 7448 | 6178 | 11 | 11 | 0.15% | 0.18% | 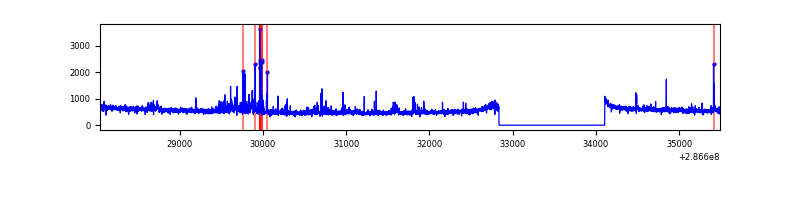 |
| C | 7448 | 6179 | 0 | 0 | 0.00% | 0.00% | 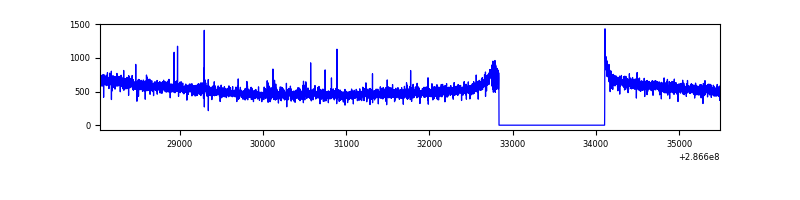 |
| D | 7447 | 6177 | 90 | 90 | 1.21% | 1.46% | 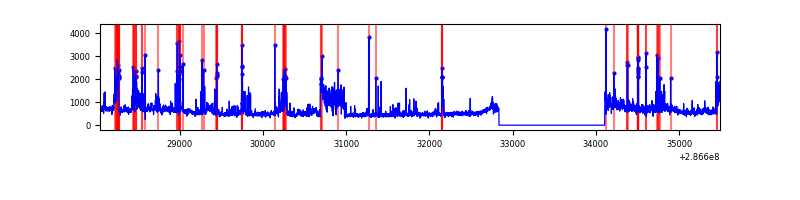 |
Top three noisy pixels from each quadrant. If the there are fewer than three noisy pixels in the level2.evt file, extra rows are filled as -1
| Pixel properties | Quadrant properties | ||||||
|---|---|---|---|---|---|---|---|
| Quadrant | DetID | PixID | Counts | Sigma | Mean | Median | Sigma |
| A | 4 | 2 | 640420 | 3820.62 | 850 | 837 | 167.4 |
| A | 15 | 174 | 26240 | 151.74 | 850 | 837 | 167.4 |
| A | 0 | 226 | 7764 | 41.38 | 850 | 837 | 167.4 |
| B | 7 | 220 | 103901 | 653.23 | 840 | 821 | 157.8 |
| B | 3 | 64 | 34066 | 210.68 | 840 | 821 | 157.8 |
| B | 4 | 216 | 27695 | 170.3 | 840 | 821 | 157.8 |
| C | 14 | 238 | 126929 | 688.27 | 794 | 802 | 183.3 |
| C | 3 | 233 | 30797 | 163.68 | 794 | 802 | 183.3 |
| C | 0 | 207 | 11113 | 56.27 | 794 | 802 | 183.3 |
| D | 7 | 238 | 483863 | 2419.21 | 818 | 794 | 199.7 |
| D | 11 | 176 | 335864 | 1678.03 | 818 | 794 | 199.7 |
| D | 5 | 222 | 137869 | 686.47 | 818 | 794 | 199.7 |
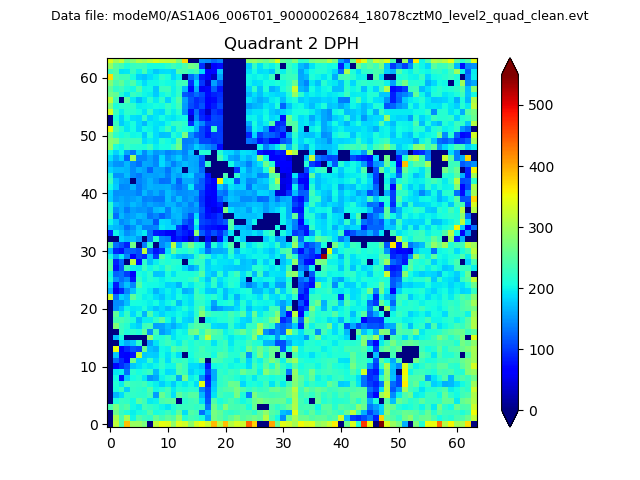
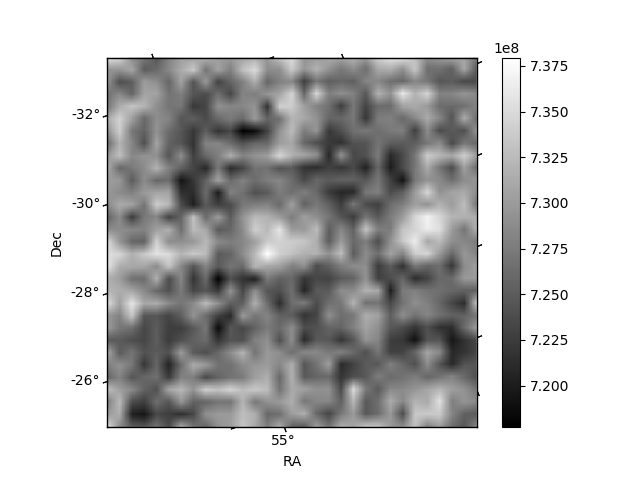
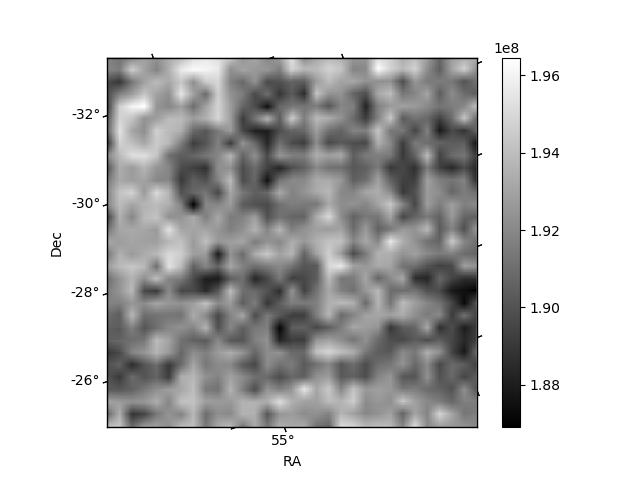
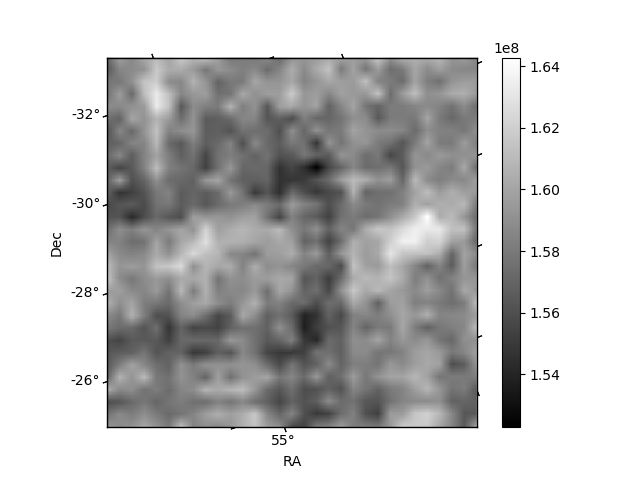
Histogram calculated using DETX and DETY for each event in the final _common_clean file
| Quadrant A | 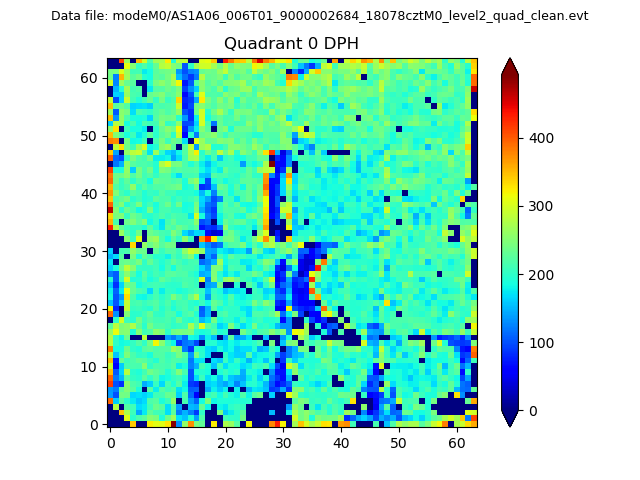 |
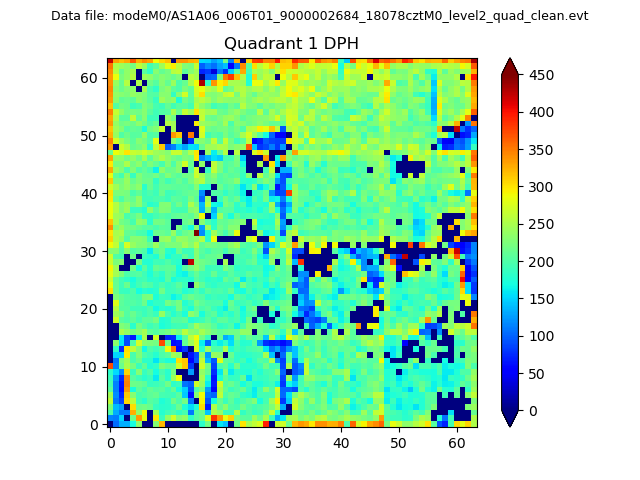 |
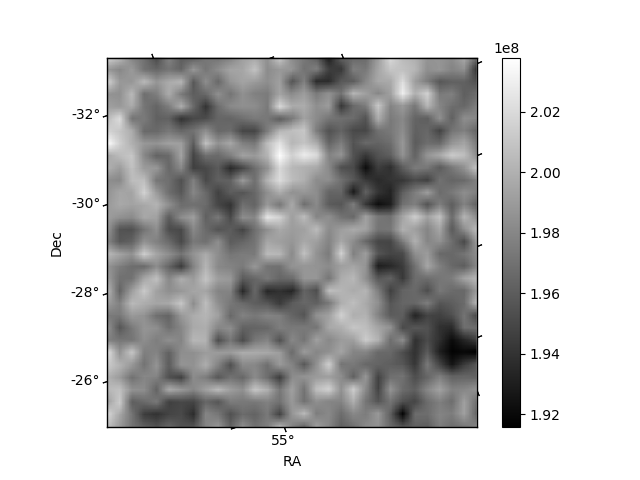
Quadrant B |
|---|---|---|---|
| Quadrant D | 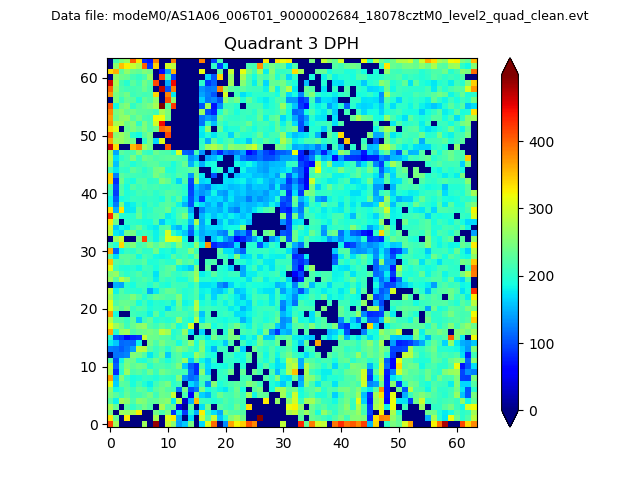 |
 |
Quadrant C |
| Plot type | Count rate plots | Images |
|---|---|---|
| Comparison with Poisson distribution Blue bars denote a histogram of data divided into 1 sec bins. Red curve is a Poisson curve with rate = median count rate of data. |
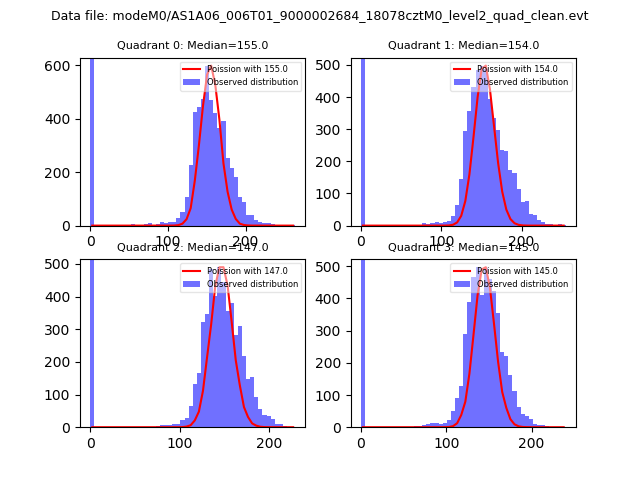 |
 |
| Quadrant-wise count rates Data is divided into 100 sec bins |
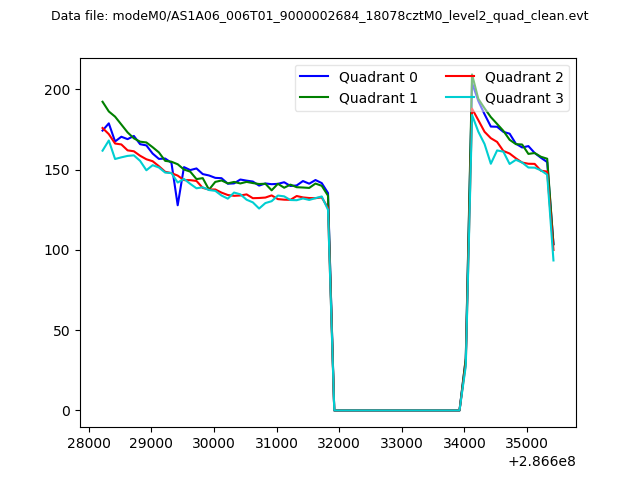 |
|
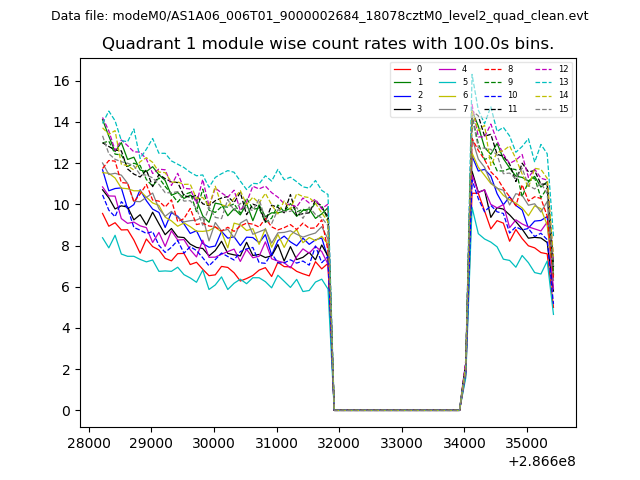
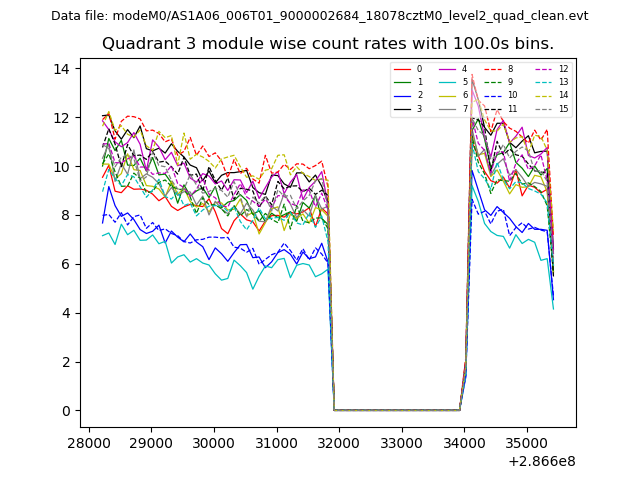
| Module-wise count rates for Quadrant A Data is divided into 100 sec bins |
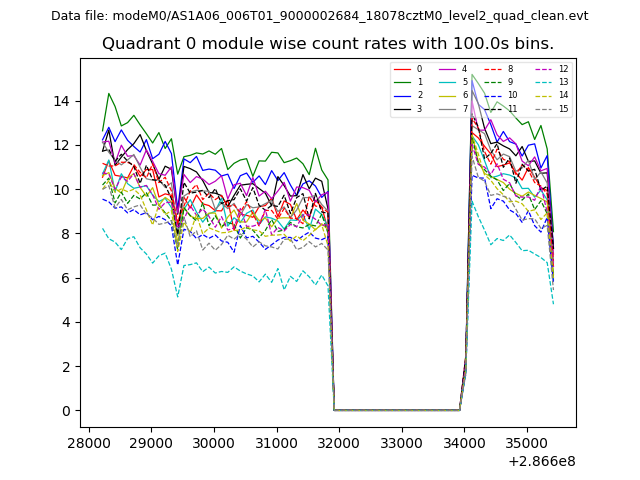 |
 |
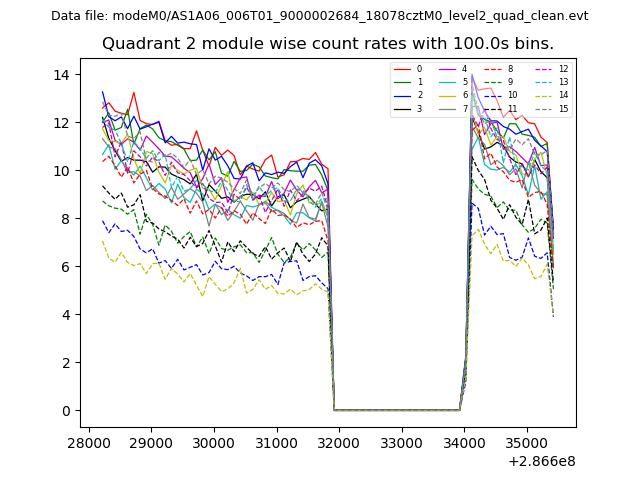
| Module-wise count rates for Quadrant B Data is divided into 100 sec bins |
 |
 |
| Module-wise count rates for Quadrant C Data is divided into 100 sec bins |
 |
 |
| Module-wise count rates for Quadrant D Data is divided into 100 sec bins |
 |
 |
| Parameter | Plot |
|---|---|
| CZT HV Monitor | 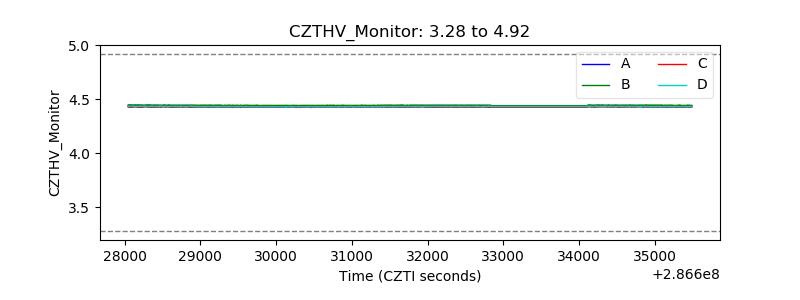 |
| D_VDD | 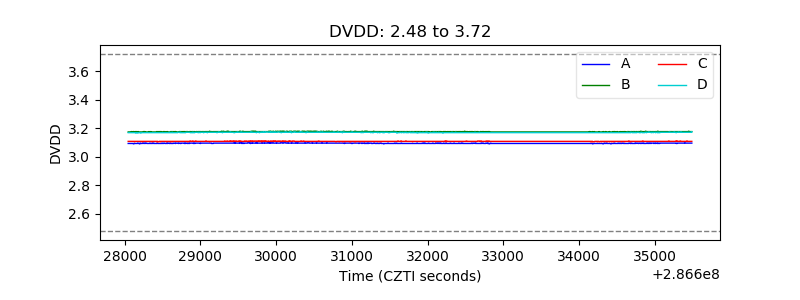 |
| Temperature 1 | 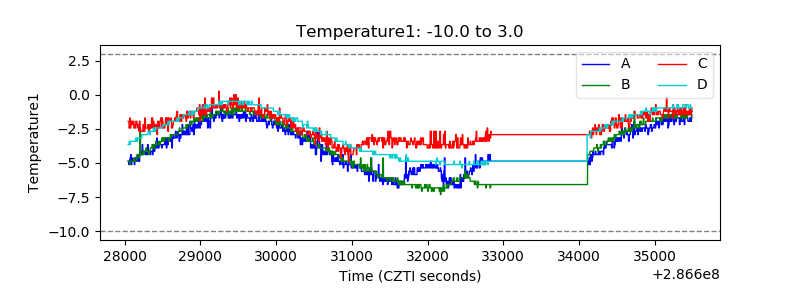 |
| Veto HV Monitor | 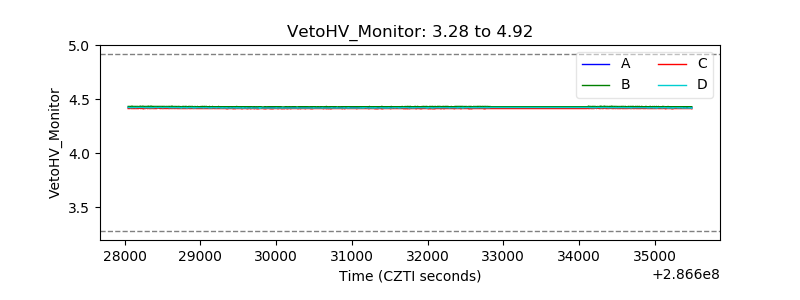 |
| Veto LLD | 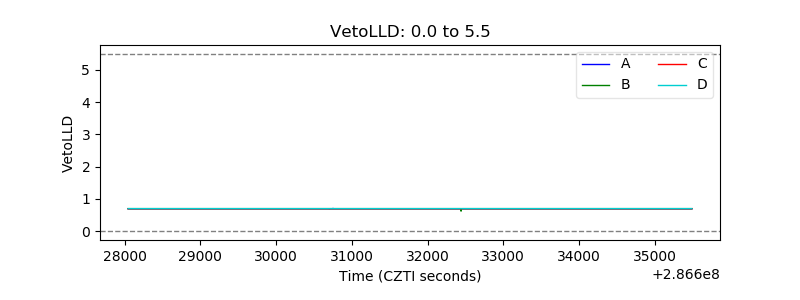 |
| Alpha Counter | 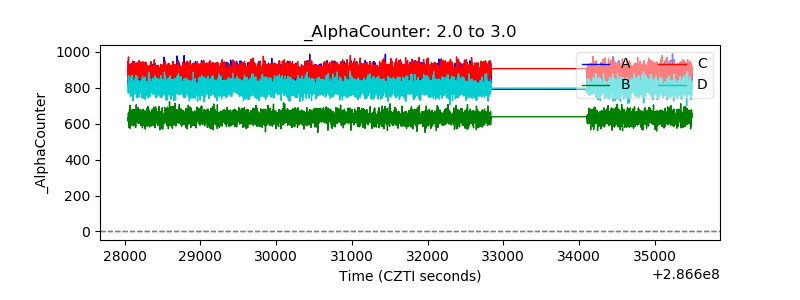 |
| _CPM_Rate | 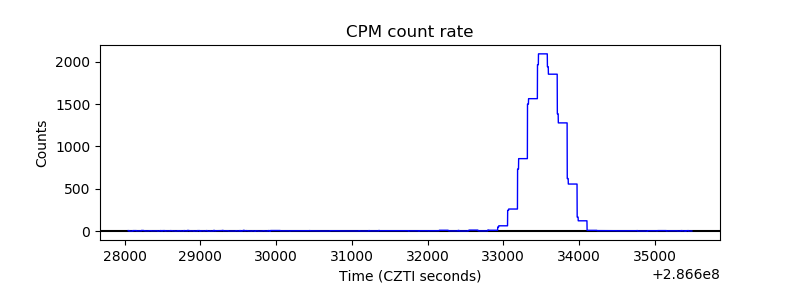 |
| CZT Counter | 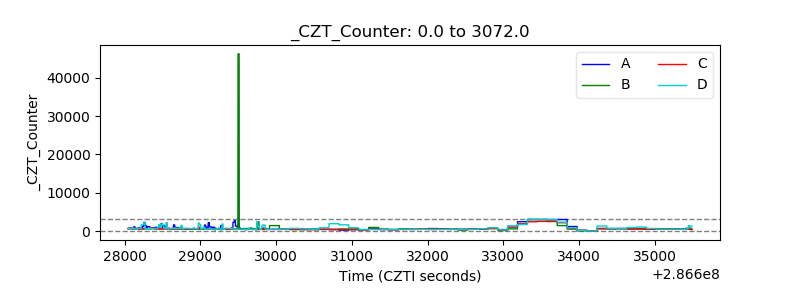 |
| +2.5 Volts monitor |  |
| +5 Volts monitor |  |
| _ROLL_ROT | 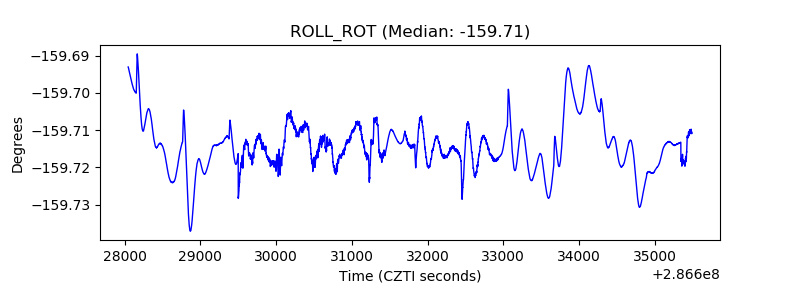 |
| _Roll_DEC | 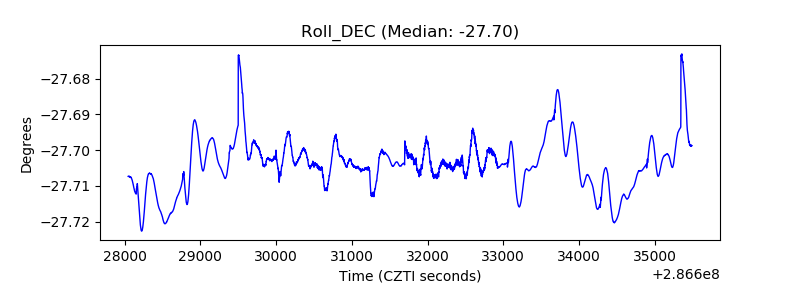 |
| _Roll_RA | 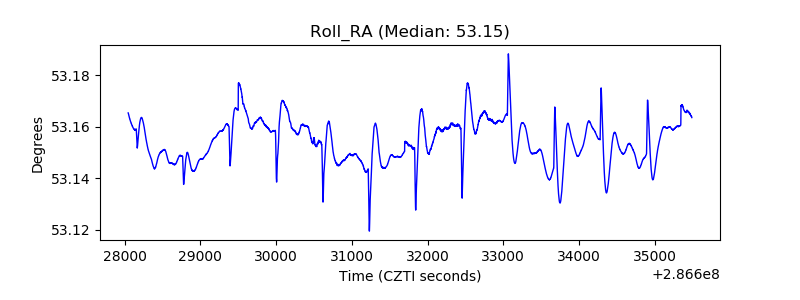 |
| Veto Counter |  |