| Param | Original file | Final file |
|---|---|---|
| Filename | modeM0/AS1A06_006T01_9000002684_18080cztM0_level2.evt | modeM0/AS1A06_006T01_9000002684_18080cztM0_level2_quad_clean.evt |
| Size (bytes) | 553,322,880 | 84,847,680 |
| Size | 527.7 MB | 80.9 MB |
| Events in quadrant A | 3,078,296 | 567,201 |
| Events in quadrant B | 3,102,728 | 561,847 |
| Events in quadrant C | 2,946,972 | 537,565 |
| Events in quadrant D | 7,225,107 | 485,533 |
| Mode SS | |||
|---|---|---|---|
| Quadrant | BADHDUFLAG | Total packets | Discarded packets |
| A | 0 | 122 | 0 |
| B | 0 | 122 | 0 |
| C | 0 | 122 | 0 |
| D | 0 | 122 | 0 |
| Mode M9 | |||
|---|---|---|---|
| Quadrant | BADHDUFLAG | Total packets | Discarded packets |
| A | 0 | 11 | 0 |
| B | 0 | 11 | 0 |
| C | 0 | 11 | 0 |
| D | 0 | 11 | 0 |
| Mode M0 | |||
|---|---|---|---|
| Quadrant | BADHDUFLAG | Total packets | Discarded packets |
| A | 0 | 13033 | 1 |
| B | 0 | 12852 | 1 |
| C | 0 | 12605 | 1 |
| D | 0 | 25560 | 1 |
| Quadrant | Total seconds | Saturated seconds | Saturation percentage |
|---|---|---|---|
| A | 5966 | 116 | 1.944351% |
| B | 5967 | 111 | 1.860231% |
| C | 5967 | 114 | 1.910508% |
| D | 5966 | 932 | 15.621857% |
Noise dominated data is calculated using 1-second bins in cleaned event files. If a bin has >2000 counts, and if more than 50% of those come from <1% of pixels, then it is considered to be noise-dominated and hence unusable.
| Quadrant | # 1 sec bins | Bins with >0 counts | Bins with >2000 counts | High rate bins dominated by noise | Noise dominated (total time) | Noise dominated (detector-on time) | Marked lightcurve |
|---|---|---|---|---|---|---|---|
| A | 7076 | 5967 | 14 | 14 | 0.20% | 0.23% | 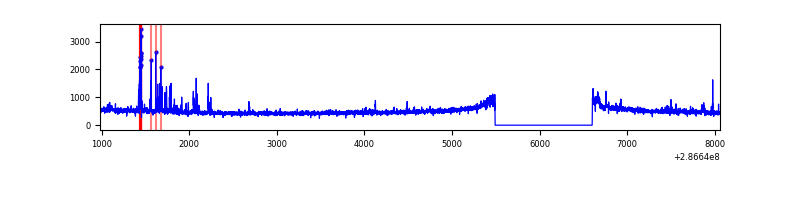 |
| B | 7077 | 5968 | 6 | 6 | 0.08% | 0.10% | 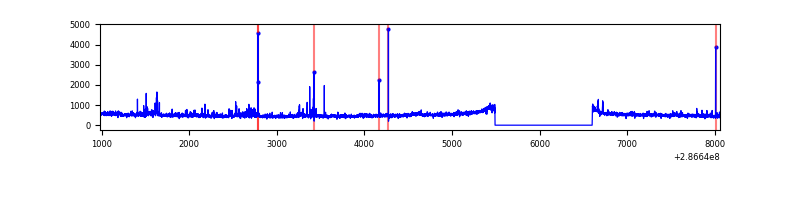 |
| C | 7077 | 5968 | 0 | 0 | 0.00% | 0.00% | 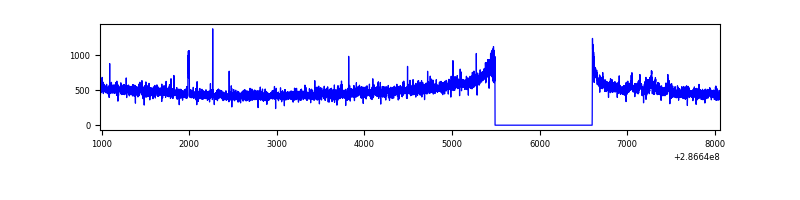 |
| D | 7076 | 5967 | 971 | 971 | 13.72% | 16.27% | 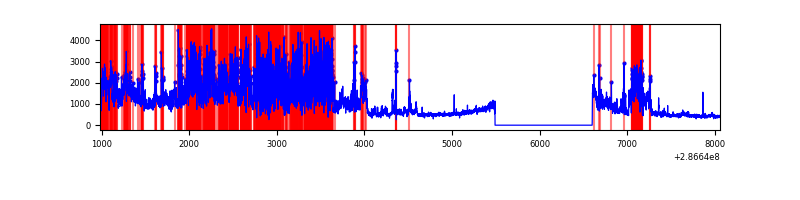 |
Top three noisy pixels from each quadrant. If the there are fewer than three noisy pixels in the level2.evt file, extra rows are filled as -1
| Pixel properties | Quadrant properties | ||||||
|---|---|---|---|---|---|---|---|
| Quadrant | DetID | PixID | Counts | Sigma | Mean | Median | Sigma |
| A | 4 | 2 | 152985 | 1002.62 | 751 | 736 | 151.9 |
| A | 14 | 4 | 33163 | 213.54 | 751 | 736 | 151.9 |
| A | 0 | 226 | 6676 | 39.12 | 751 | 736 | 151.9 |
| B | 7 | 220 | 35031 | 240.54 | 748 | 729 | 142.6 |
| B | 0 | 244 | 34780 | 238.78 | 748 | 729 | 142.6 |
| B | 0 | 189 | 31654 | 216.86 | 748 | 729 | 142.6 |
| C | 14 | 238 | 111066 | 674.75 | 705 | 711 | 163.5 |
| C | 3 | 233 | 63226 | 382.24 | 705 | 711 | 163.5 |
| C | 0 | 207 | 12647 | 72.98 | 705 | 711 | 163.5 |
| D | 5 | 222 | 2300480 | 13665.86 | 695 | 677 | 168.3 |
| D | 11 | 176 | 1738133 | 10324.29 | 695 | 677 | 168.3 |
| D | 7 | 38 | 287714 | 1705.63 | 695 | 677 | 168.3 |
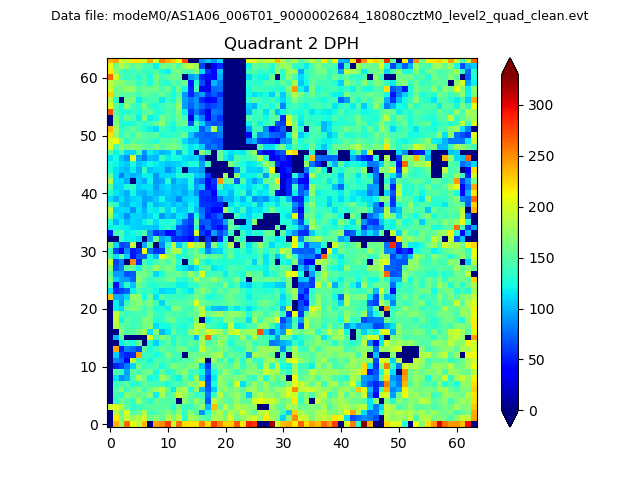
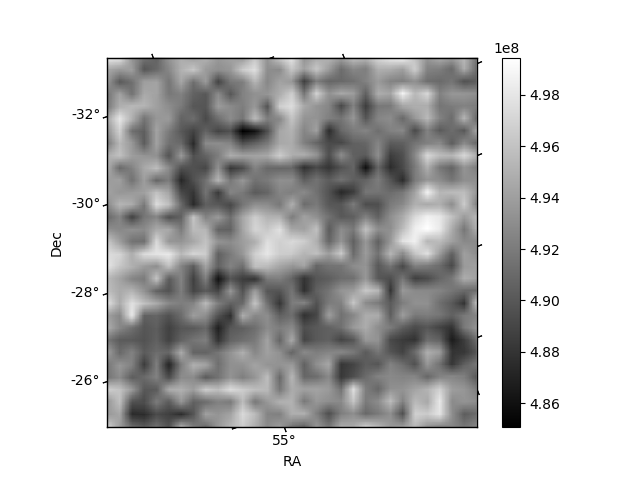
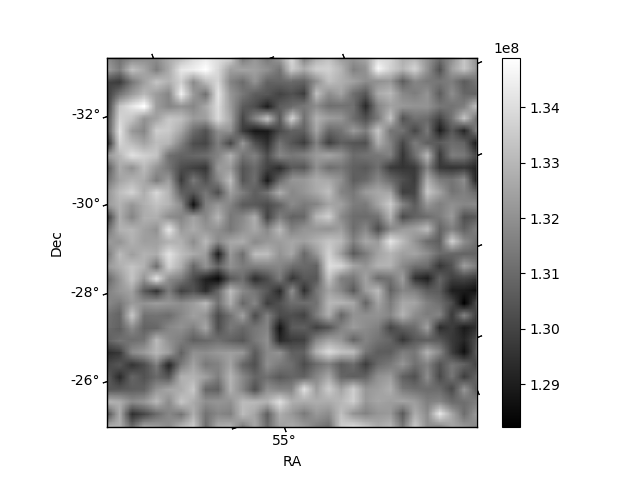
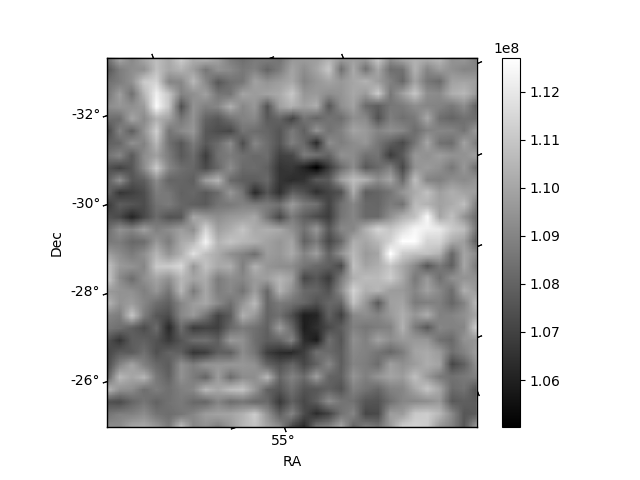
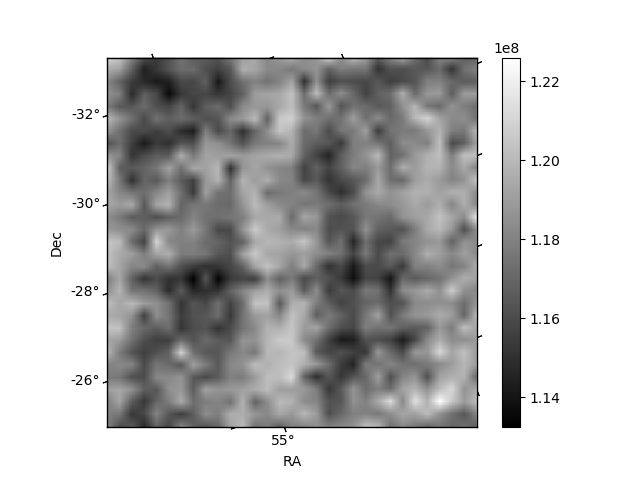
Histogram calculated using DETX and DETY for each event in the final _common_clean file
| Quadrant A | 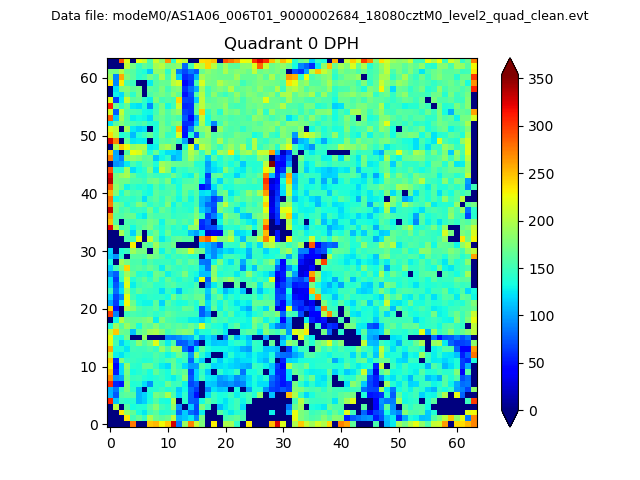 |
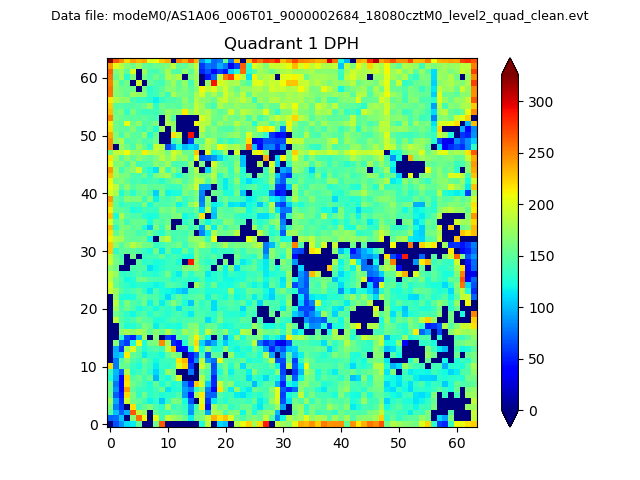 |
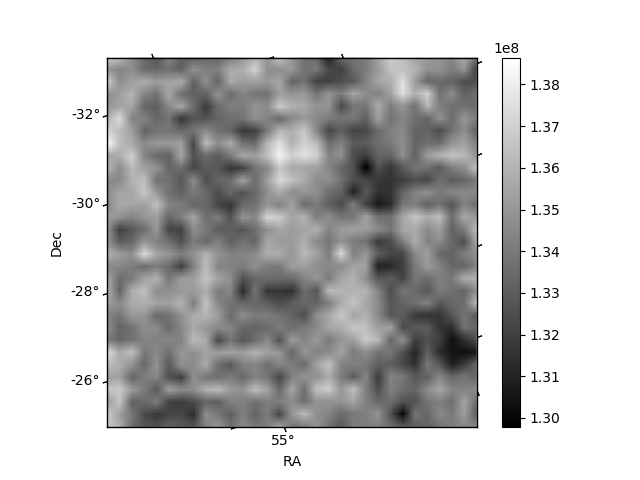
Quadrant B |
|---|---|---|---|
| Quadrant D | 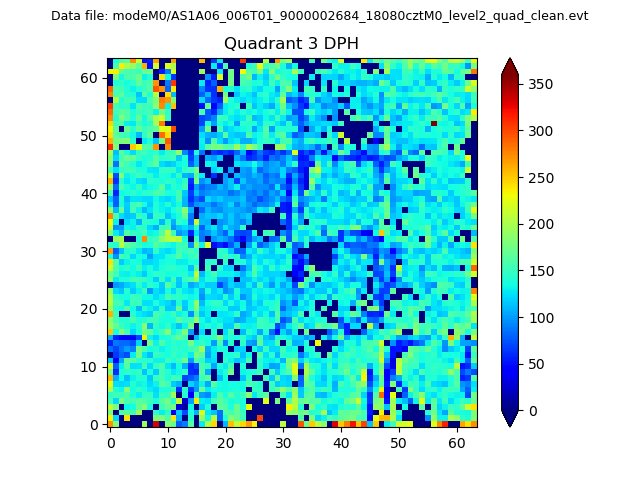 |
 |
Quadrant C |
| Plot type | Count rate plots | Images |
|---|---|---|
| Comparison with Poisson distribution Blue bars denote a histogram of data divided into 1 sec bins. Red curve is a Poisson curve with rate = median count rate of data. |
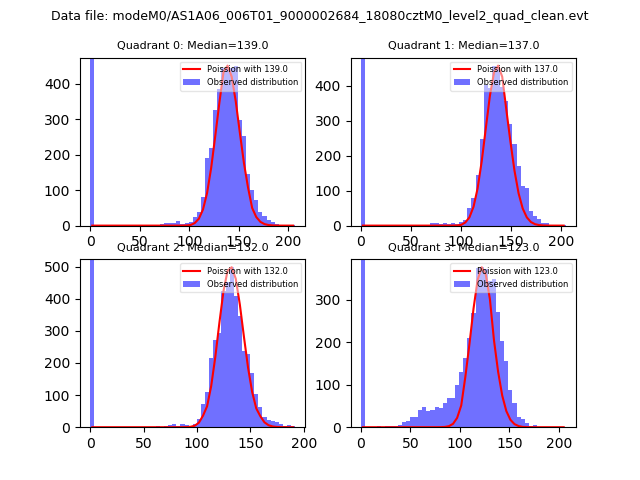 |
 |
| Quadrant-wise count rates Data is divided into 100 sec bins |
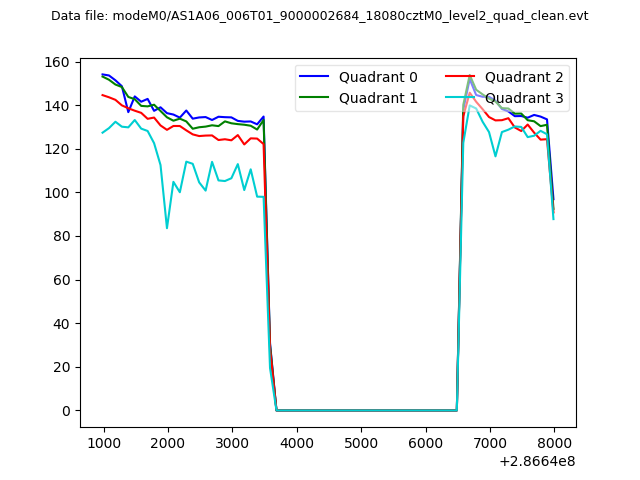 |
|
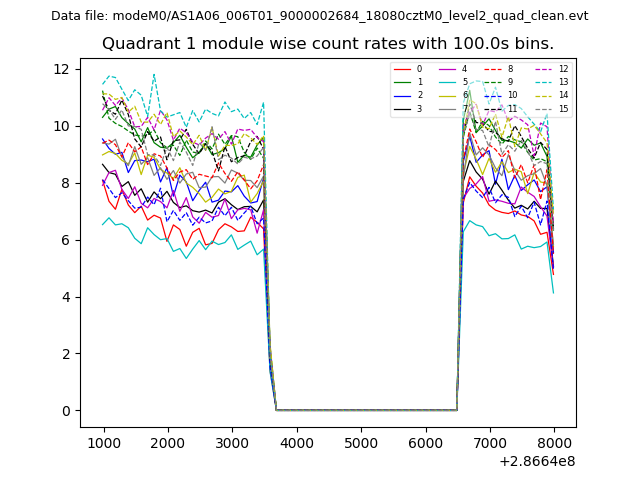
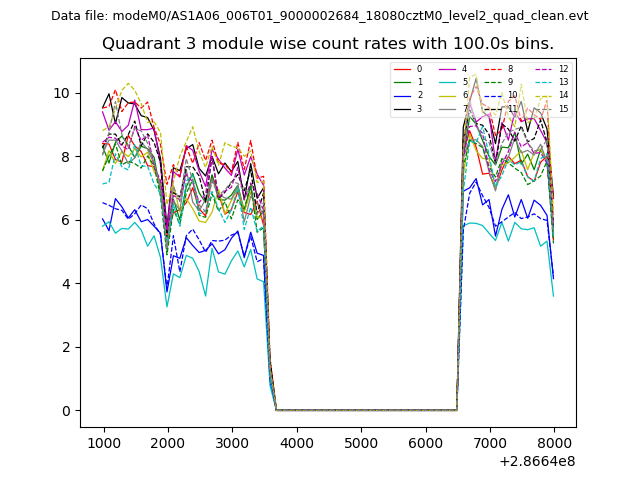
| Module-wise count rates for Quadrant A Data is divided into 100 sec bins |
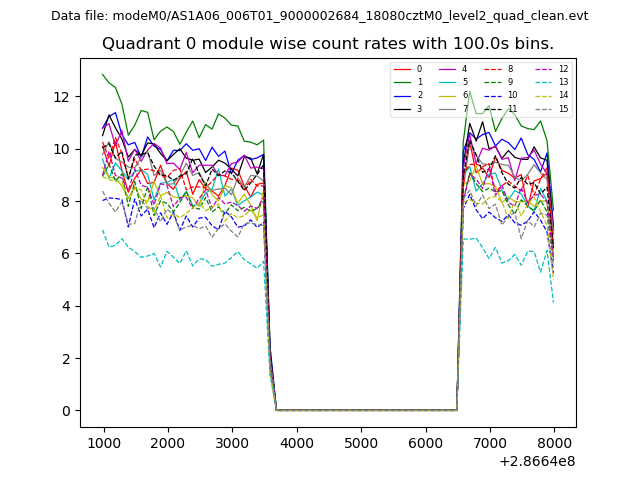 |
 |
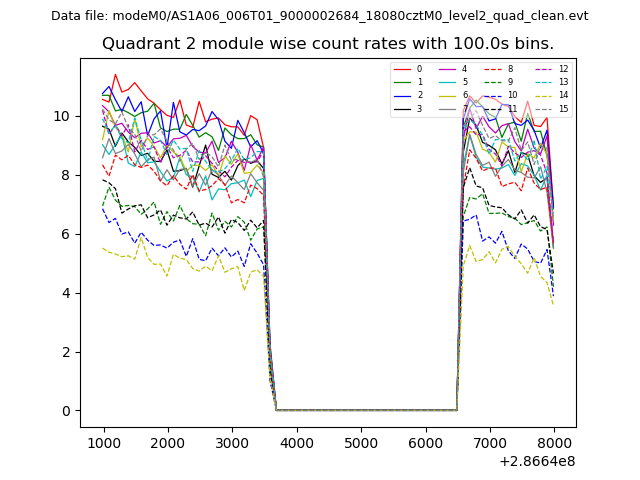
| Module-wise count rates for Quadrant B Data is divided into 100 sec bins |
 |
 |
| Module-wise count rates for Quadrant C Data is divided into 100 sec bins |
 |
 |
| Module-wise count rates for Quadrant D Data is divided into 100 sec bins |
 |
 |
| Parameter | Plot |
|---|---|
| CZT HV Monitor | 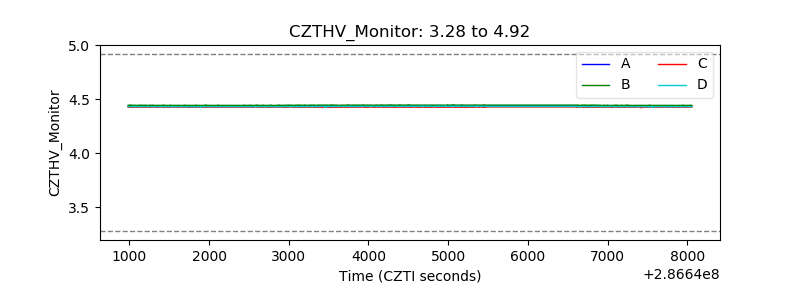 |
| D_VDD | 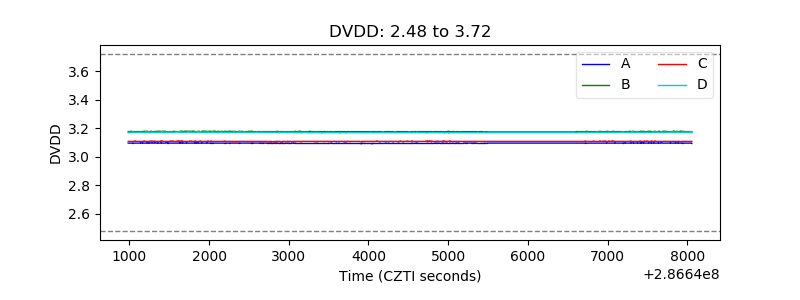 |
| Temperature 1 | 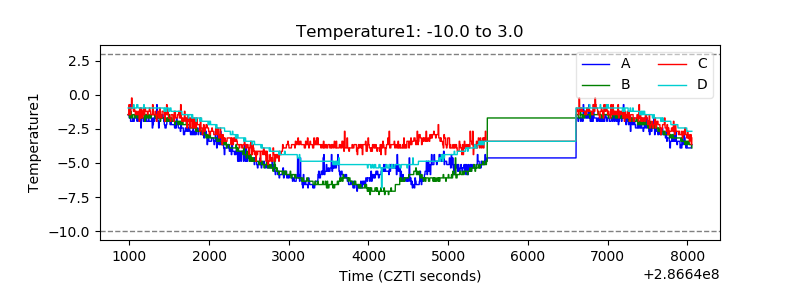 |
| Veto HV Monitor | 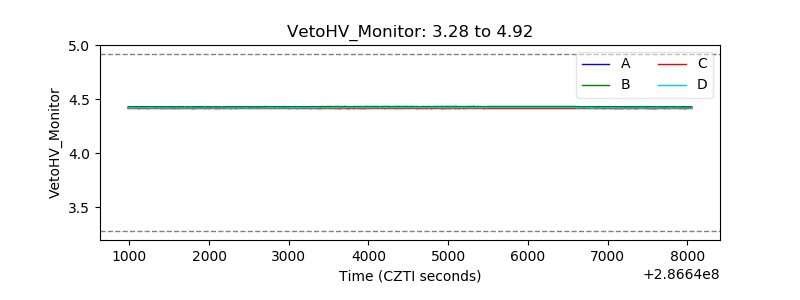 |
| Veto LLD |  |
| Alpha Counter | 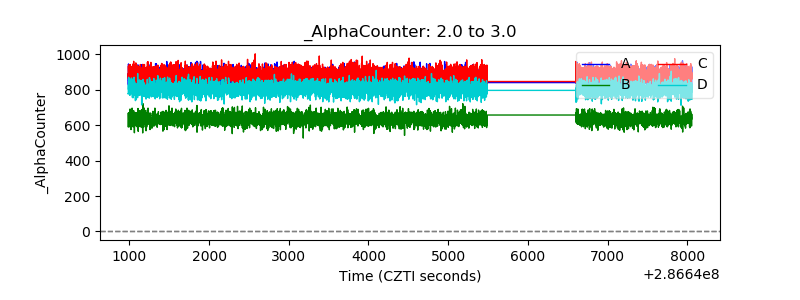 |
| _CPM_Rate |  |
| CZT Counter | 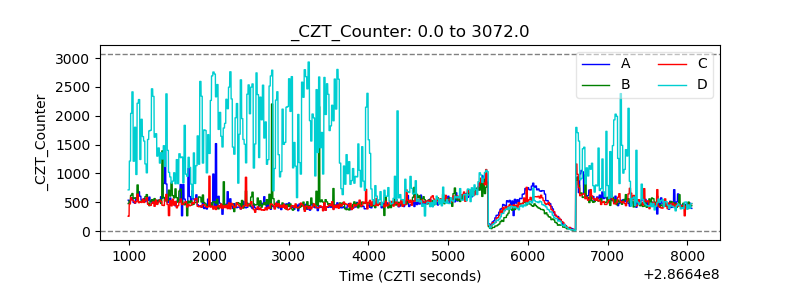 |
| +2.5 Volts monitor |  |
| +5 Volts monitor |  |
| _ROLL_ROT | 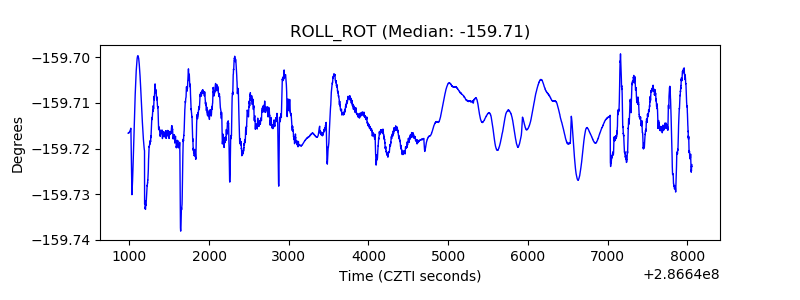 |
| _Roll_DEC | 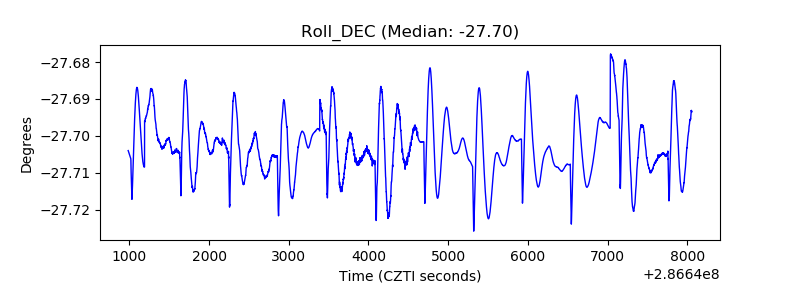 |
| _Roll_RA | 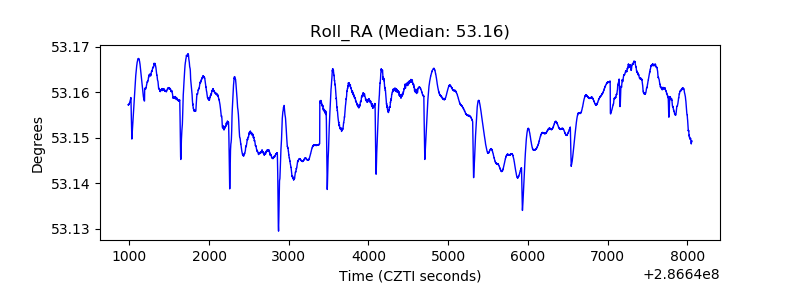 |
| Veto Counter | 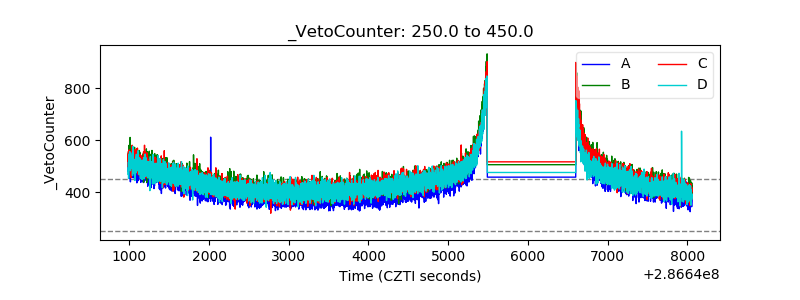 |