| Param | Original file | Final file |
|---|---|---|
| Filename | modeM0/AS1A06_006T01_9000002684_18082cztM0_level2.evt | modeM0/AS1A06_006T01_9000002684_18082cztM0_level2_quad_clean.evt |
| Size (bytes) | 527,855,040 | 100,647,360 |
| Size | 503.4 MB | 96.0 MB |
| Events in quadrant A | 4,074,276 | 652,068 |
| Events in quadrant B | 3,650,470 | 650,865 |
| Events in quadrant C | 3,371,592 | 628,731 |
| Events in quadrant D | 4,400,171 | 613,997 |
| Mode SS | |||
|---|---|---|---|
| Quadrant | BADHDUFLAG | Total packets | Discarded packets |
| A | 0 | 148 | 0 |
| B | 0 | 148 | 0 |
| C | 0 | 148 | 0 |
| D | 0 | 148 | 0 |
| Mode M9 | |||
|---|---|---|---|
| Quadrant | BADHDUFLAG | Total packets | Discarded packets |
| A | 0 | 4 | 0 |
| B | 0 | 5 | 0 |
| C | 0 | 5 | 0 |
| D | 0 | 5 | 0 |
| Mode M0 | |||
|---|---|---|---|
| Quadrant | BADHDUFLAG | Total packets | Discarded packets |
| A | 0 | 17023 | 2 |
| B | 0 | 15559 | 2 |
| C | 0 | 14792 | 2 |
| D | 0 | 17920 | 2 |
| Quadrant | Total seconds | Saturated seconds | Saturation percentage |
|---|---|---|---|
| A | 7209 | 108 | 1.498127% |
| B | 7209 | 102 | 1.414898% |
| C | 7209 | 73 | 1.012623% |
| D | 7209 | 232 | 3.218199% |
Noise dominated data is calculated using 1-second bins in cleaned event files. If a bin has >2000 counts, and if more than 50% of those come from <1% of pixels, then it is considered to be noise-dominated and hence unusable.
| Quadrant | # 1 sec bins | Bins with >0 counts | Bins with >2000 counts | High rate bins dominated by noise | Noise dominated (total time) | Noise dominated (detector-on time) | Marked lightcurve |
|---|---|---|---|---|---|---|---|
| A | 7639 | 7210 | 69 | 69 | 0.90% | 0.96% | 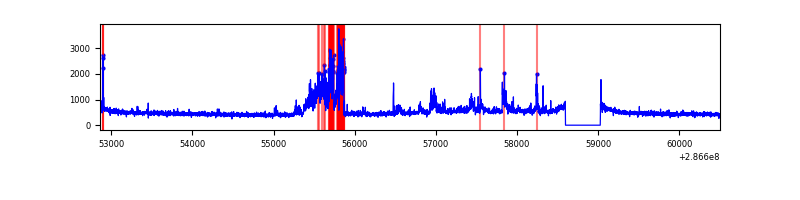 |
| B | 7639 | 7210 | 31 | 31 | 0.41% | 0.43% | 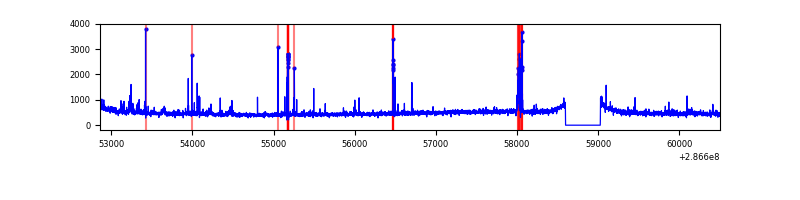 |
| C | 7639 | 7210 | 0 | 0 | 0.00% | 0.00% | 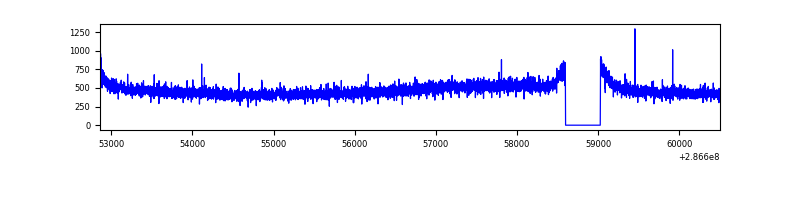 |
| D | 7639 | 7209 | 168 | 168 | 2.20% | 2.33% | 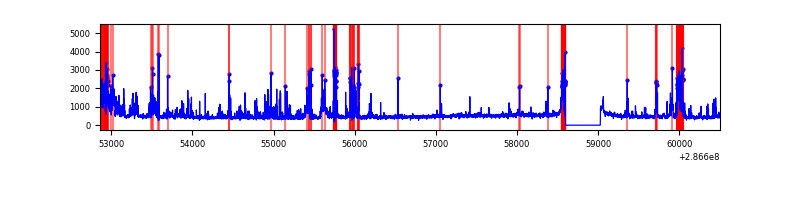 |
Top three noisy pixels from each quadrant. If the there are fewer than three noisy pixels in the level2.evt file, extra rows are filled as -1
| Pixel properties | Quadrant properties | ||||||
|---|---|---|---|---|---|---|---|
| Quadrant | DetID | PixID | Counts | Sigma | Mean | Median | Sigma |
| A | 15 | 174 | 707206 | 4013.21 | 868 | 849 | 176.0 |
| A | 14 | 4 | 23416 | 128.22 | 868 | 849 | 176.0 |
| A | 0 | 226 | 7792 | 39.45 | 868 | 849 | 176.0 |
| B | 3 | 64 | 145214 | 864.07 | 866 | 845 | 167.1 |
| B | 7 | 220 | 38716 | 226.66 | 866 | 845 | 167.1 |
| B | 0 | 197 | 25259 | 146.12 | 866 | 845 | 167.1 |
| C | 14 | 238 | 128565 | 661.47 | 824 | 828 | 193.1 |
| C | 3 | 233 | 26128 | 131.01 | 824 | 828 | 193.1 |
| C | 13 | 61 | 5915 | 26.34 | 824 | 828 | 193.1 |
| D | 11 | 176 | 466188 | 2261.31 | 828 | 802 | 205.8 |
| D | 5 | 222 | 410703 | 1991.71 | 828 | 802 | 205.8 |
| D | 7 | 38 | 238272 | 1153.87 | 828 | 802 | 205.8 |
Histogram calculated using DETX and DETY for each event in the final _common_clean file
| Quadrant A | 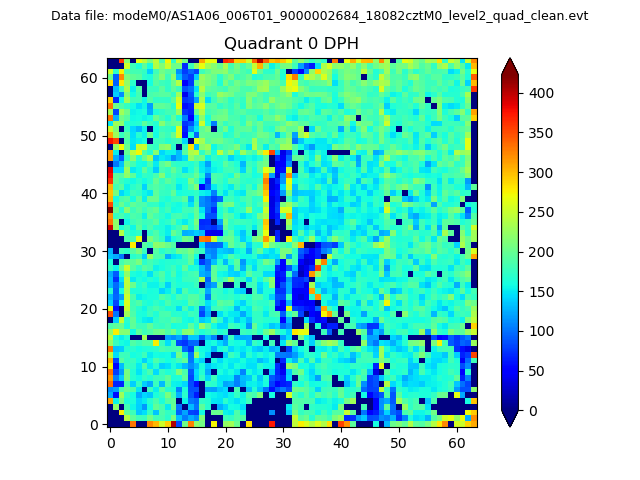 |
 |
Quadrant B |
|---|---|---|---|
| Quadrant D | 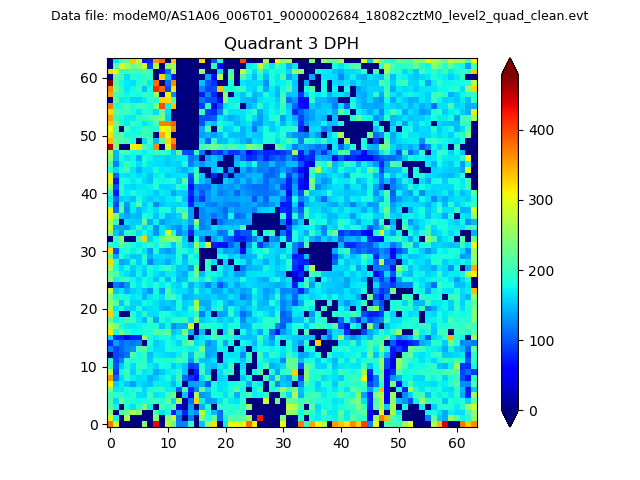 |
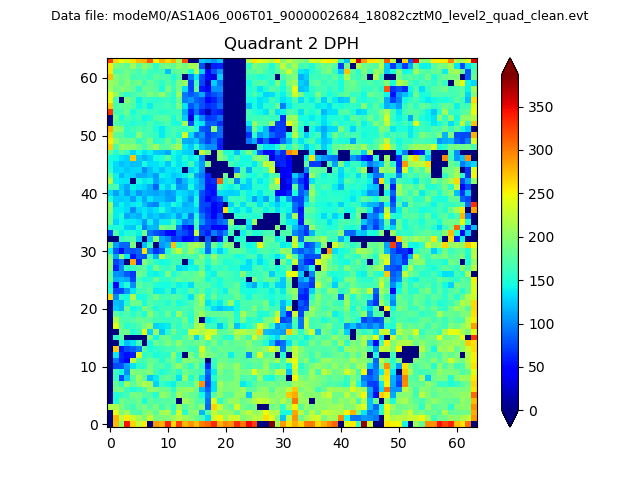 |
Quadrant C |
| Plot type | Count rate plots | Images |
|---|---|---|
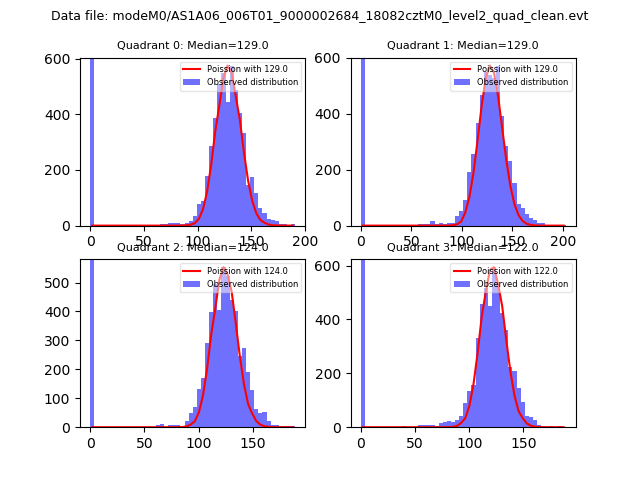
| Comparison with Poisson distribution Blue bars denote a histogram of data divided into 1 sec bins. Red curve is a Poisson curve with rate = median count rate of data. |
 |
 |
| Quadrant-wise count rates Data is divided into 100 sec bins |
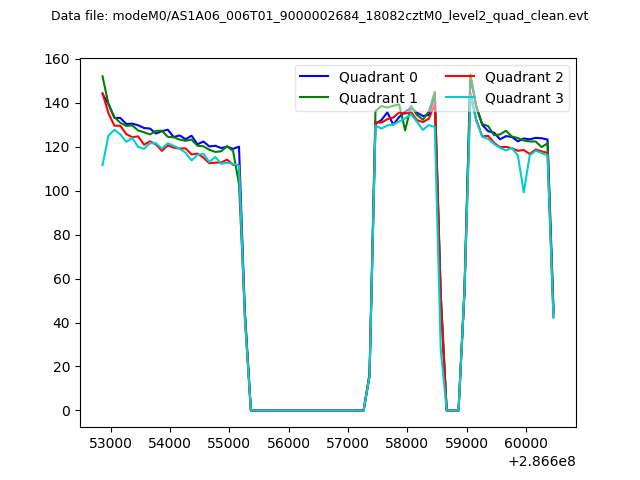 |
|
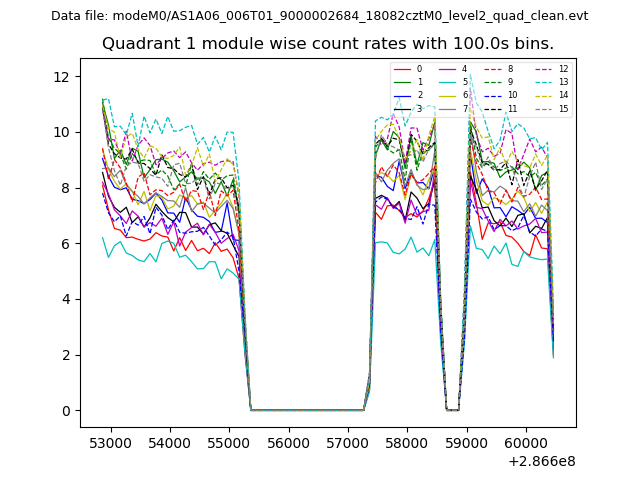
| Module-wise count rates for Quadrant A Data is divided into 100 sec bins |
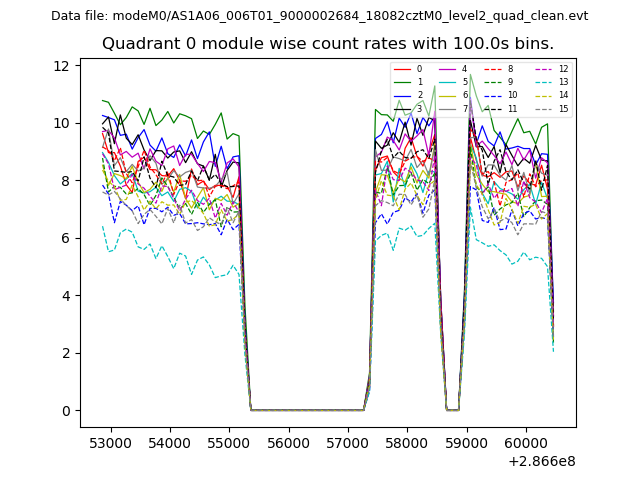 |
 |
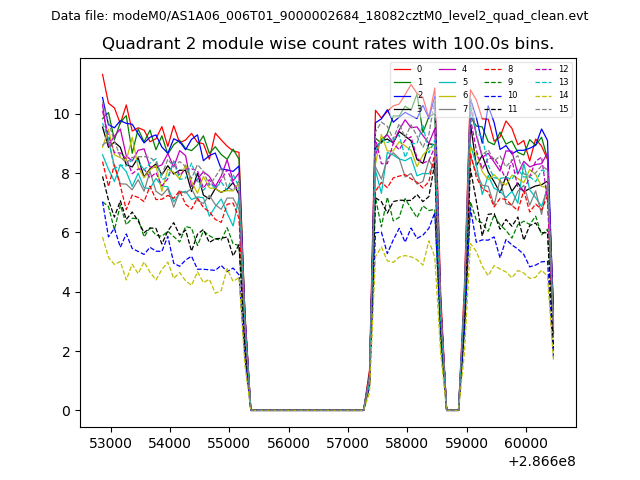
| Module-wise count rates for Quadrant B Data is divided into 100 sec bins |
 |
 |
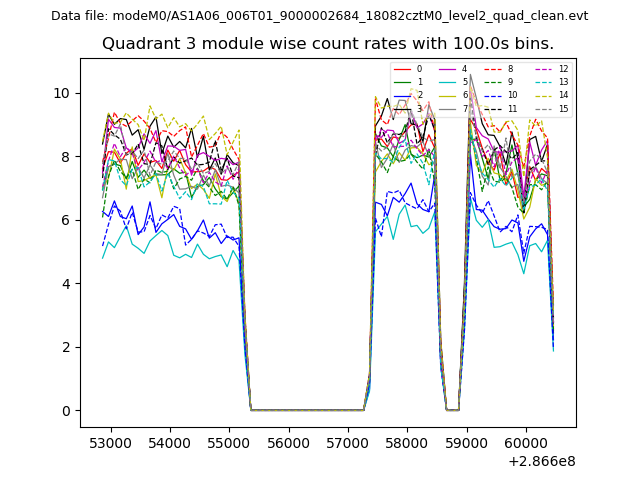
| Module-wise count rates for Quadrant C Data is divided into 100 sec bins |
 |
 |
| Module-wise count rates for Quadrant D Data is divided into 100 sec bins |
 |
 |
| Parameter | Plot |
|---|---|
| CZT HV Monitor | 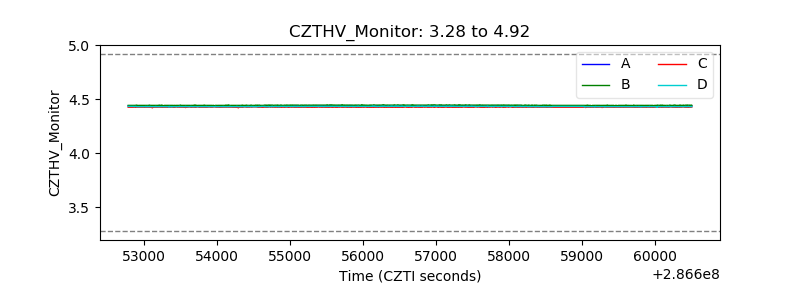 |
| D_VDD | 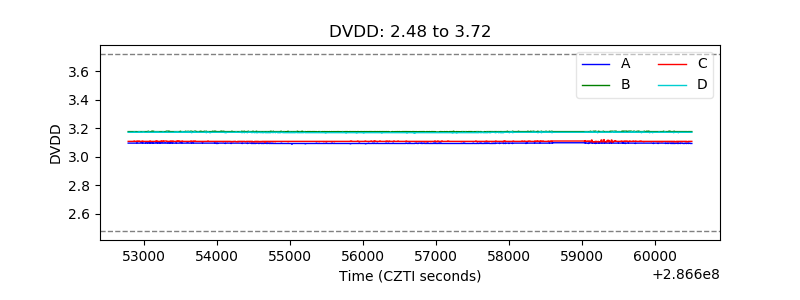 |
| Temperature 1 | 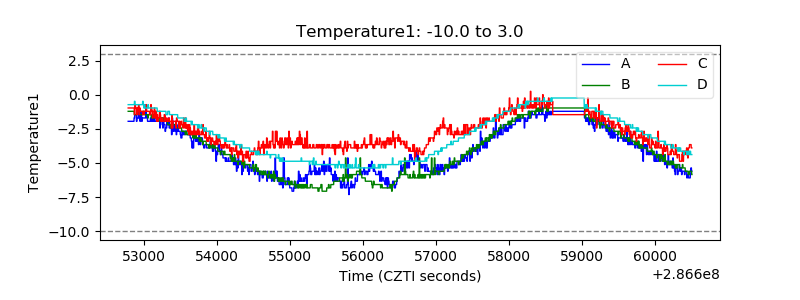 |
| Veto HV Monitor | 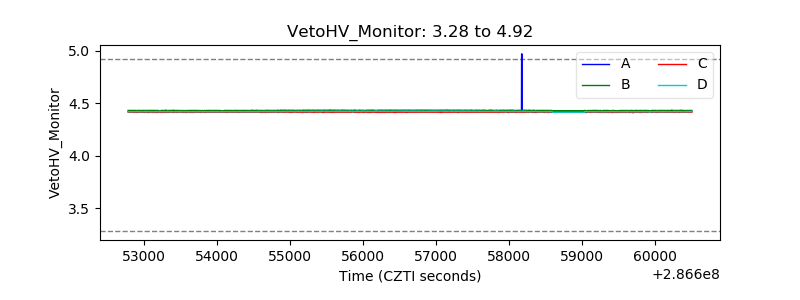 |
| Veto LLD | 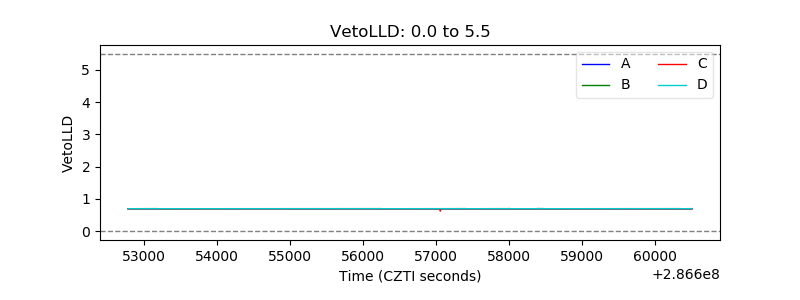 |
| Alpha Counter | 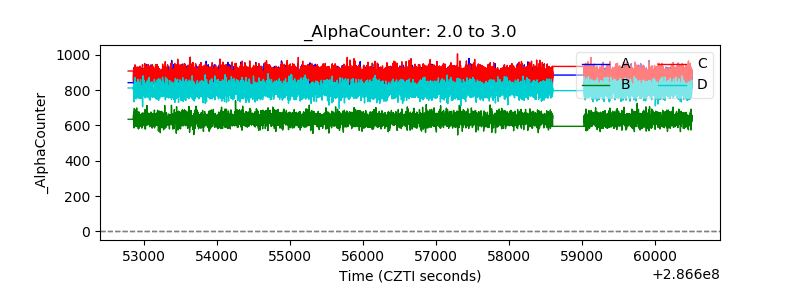 |
| _CPM_Rate | 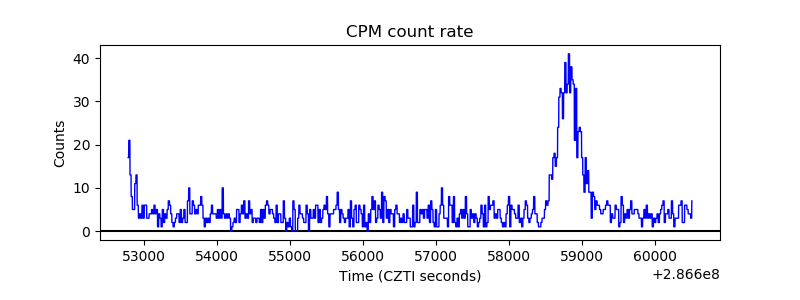 |
| CZT Counter |  |
| +2.5 Volts monitor |  |
| +5 Volts monitor |  |
| _ROLL_ROT | 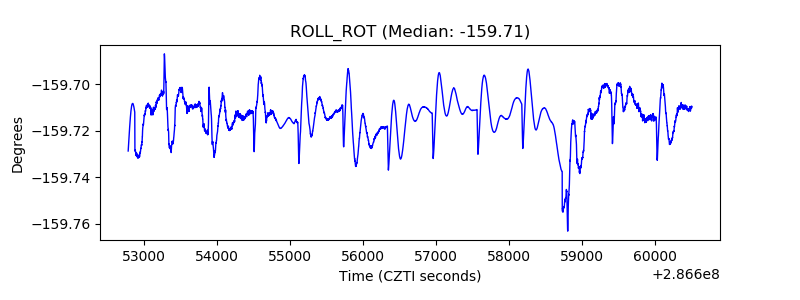 |
| _Roll_DEC | 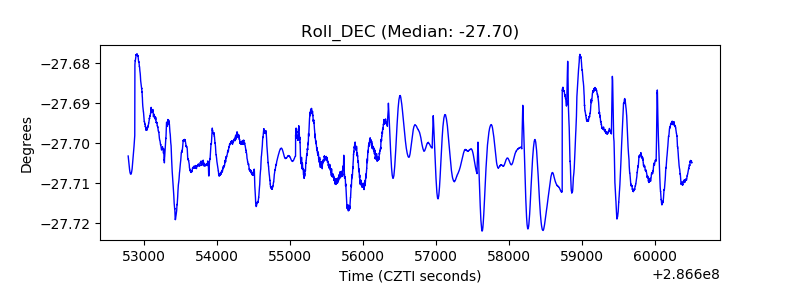 |
| _Roll_RA |  |
| Veto Counter | 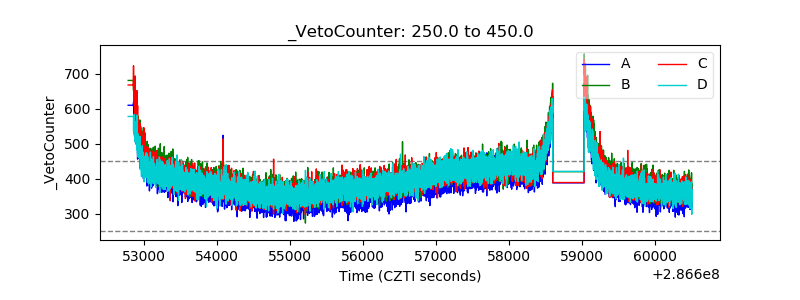 |