| Param | Original file | Final file |
|---|---|---|
| Filename | modeM0/AS1A06_006T01_9000002684_18087cztM0_level2.evt | modeM0/AS1A06_006T01_9000002684_18087cztM0_level2_quad_clean.evt |
| Size (bytes) | 434,646,720 | 85,446,720 |
| Size | 414.5 MB | 81.5 MB |
| Events in quadrant A | 3,062,994 | 554,026 |
| Events in quadrant B | 3,189,085 | 537,641 |
| Events in quadrant C | 3,037,701 | 528,832 |
| Events in quadrant D | 3,449,505 | 531,574 |
| Mode SS | |||
|---|---|---|---|
| Quadrant | BADHDUFLAG | Total packets | Discarded packets |
| A | 0 | 126 | 0 |
| B | 0 | 126 | 0 |
| C | 0 | 126 | 0 |
| D | 0 | 126 | 0 |
| Mode M9 | |||
|---|---|---|---|
| Quadrant | BADHDUFLAG | Total packets | Discarded packets |
| A | 0 | 9 | 0 |
| B | 0 | 10 | 0 |
| C | 0 | 10 | 0 |
| D | 0 | 10 | 0 |
| Mode M0 | |||
|---|---|---|---|
| Quadrant | BADHDUFLAG | Total packets | Discarded packets |
| A | 0 | 13284 | 2 |
| B | 0 | 13546 | 2 |
| C | 0 | 12993 | 2 |
| D | 0 | 14565 | 2 |
| Quadrant | Total seconds | Saturated seconds | Saturation percentage |
|---|---|---|---|
| A | 6242 | 41 | 0.656841% |
| B | 6242 | 38 | 0.608779% |
| C | 6242 | 50 | 0.801025% |
| D | 6242 | 63 | 1.009292% |
Noise dominated data is calculated using 1-second bins in cleaned event files. If a bin has >2000 counts, and if more than 50% of those come from <1% of pixels, then it is considered to be noise-dominated and hence unusable.
| Quadrant | # 1 sec bins | Bins with >0 counts | Bins with >2000 counts | High rate bins dominated by noise | Noise dominated (total time) | Noise dominated (detector-on time) | Marked lightcurve |
|---|---|---|---|---|---|---|---|
| A | 6802 | 6243 | 16 | 16 | 0.24% | 0.26% |  |
| B | 6802 | 6243 | 6 | 6 | 0.09% | 0.10% | 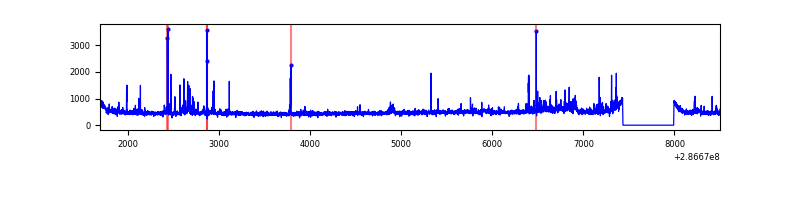 |
| C | 6802 | 6243 | 0 | 0 | 0.00% | 0.00% |  |
| D | 6801 | 6242 | 42 | 42 | 0.62% | 0.67% | 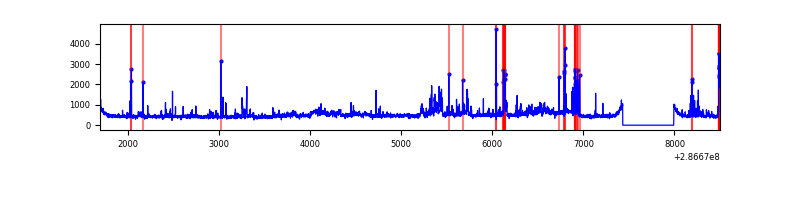 |
Top three noisy pixels from each quadrant. If the there are fewer than three noisy pixels in the level2.evt file, extra rows are filled as -1
| Pixel properties | Quadrant properties | ||||||
|---|---|---|---|---|---|---|---|
| Quadrant | DetID | PixID | Counts | Sigma | Mean | Median | Sigma |
| A | 15 | 174 | 146769 | 957.89 | 752 | 736 | 152.5 |
| A | 4 | 2 | 22430 | 142.3 | 752 | 736 | 152.5 |
| A | 0 | 226 | 6675 | 38.96 | 752 | 736 | 152.5 |
| B | 3 | 64 | 92893 | 636.38 | 746 | 727 | 144.8 |
| B | 7 | 220 | 71594 | 489.32 | 746 | 727 | 144.8 |
| B | 0 | 189 | 36609 | 247.76 | 746 | 727 | 144.8 |
| C | 3 | 233 | 124667 | 725.23 | 717 | 723 | 170.9 |
| C | 14 | 238 | 110337 | 641.38 | 717 | 723 | 170.9 |
| C | 13 | 61 | 4983 | 24.92 | 717 | 723 | 170.9 |
| D | 11 | 176 | 600124 | 3322.2 | 729 | 709 | 180.4 |
| D | 10 | 70 | 29017 | 156.89 | 729 | 709 | 180.4 |
| D | 2 | 234 | 27970 | 151.09 | 729 | 709 | 180.4 |
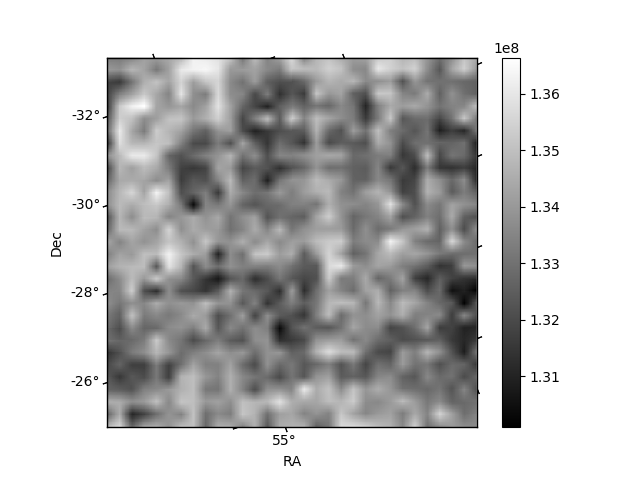
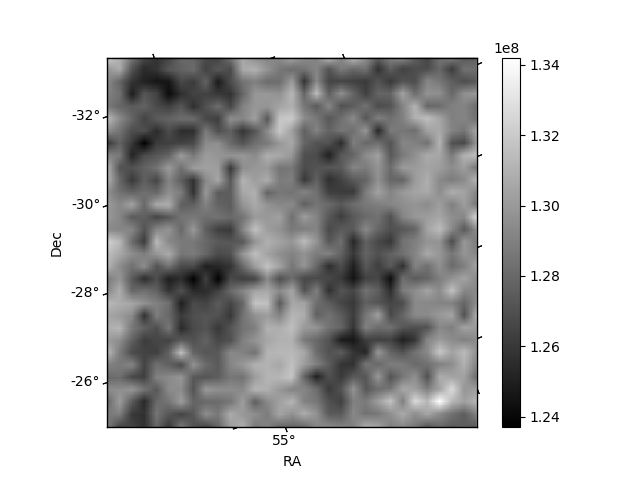
Histogram calculated using DETX and DETY for each event in the final _common_clean file
| Quadrant A | 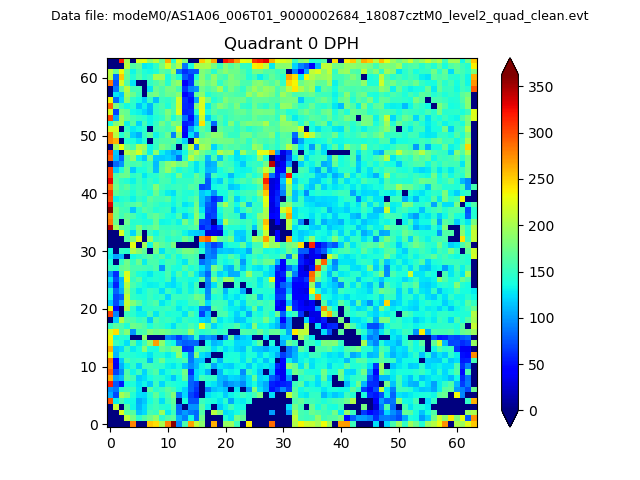 |
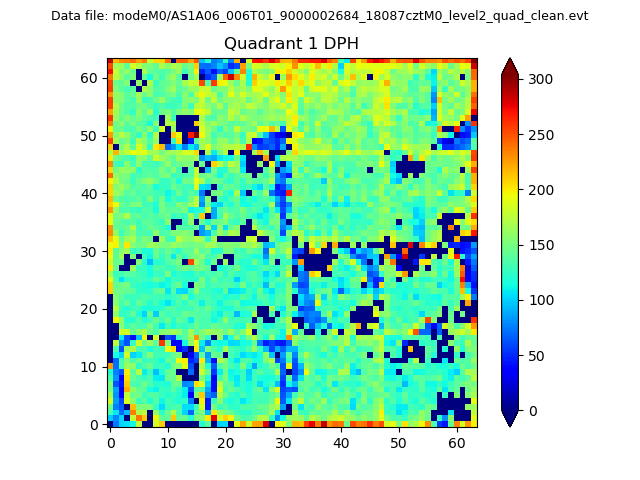 |
Quadrant B |
|---|---|---|---|
| Quadrant D | 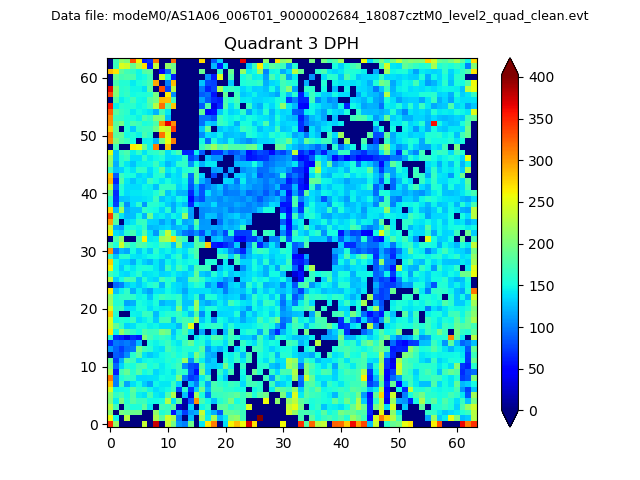 |
 |
Quadrant C |
| Plot type | Count rate plots | Images |
|---|---|---|
| Comparison with Poisson distribution Blue bars denote a histogram of data divided into 1 sec bins. Red curve is a Poisson curve with rate = median count rate of data. |
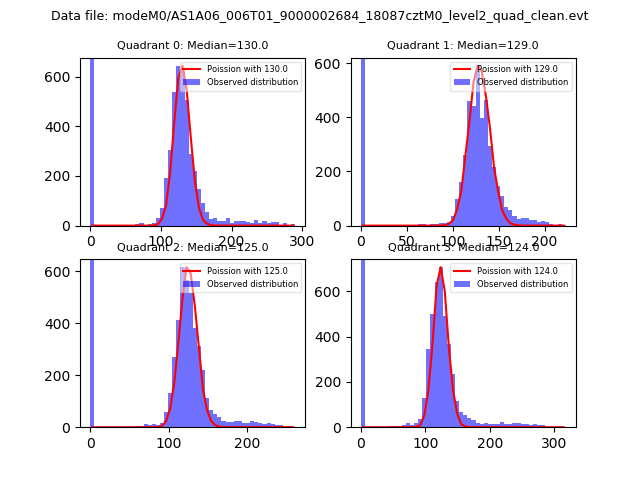 |
 |
| Quadrant-wise count rates Data is divided into 100 sec bins |
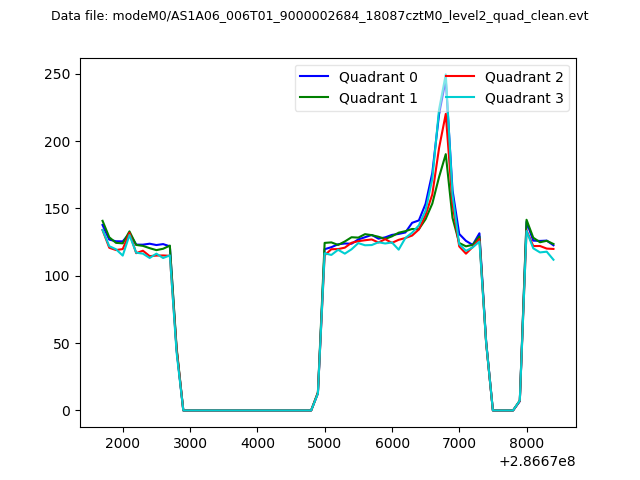 |
|
| Module-wise count rates for Quadrant A Data is divided into 100 sec bins |
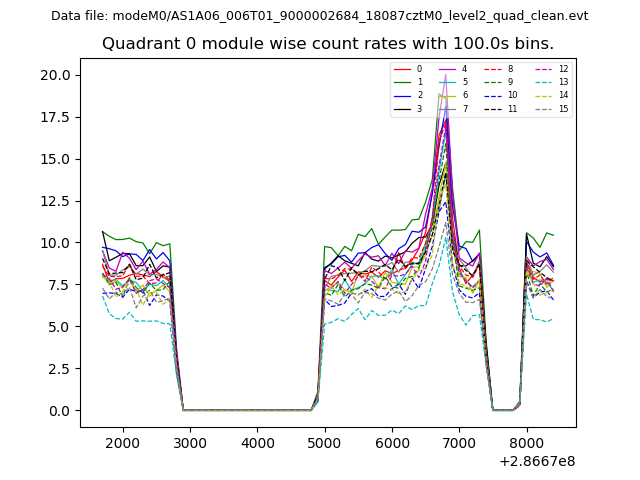 |
 |
| Module-wise count rates for Quadrant B Data is divided into 100 sec bins |
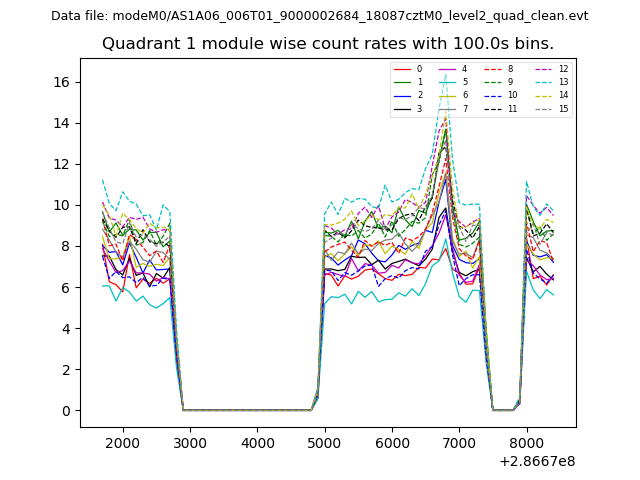 |
 |
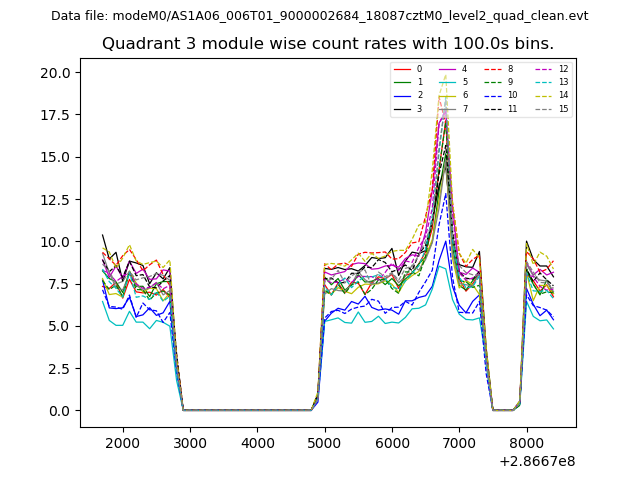
| Module-wise count rates for Quadrant C Data is divided into 100 sec bins |
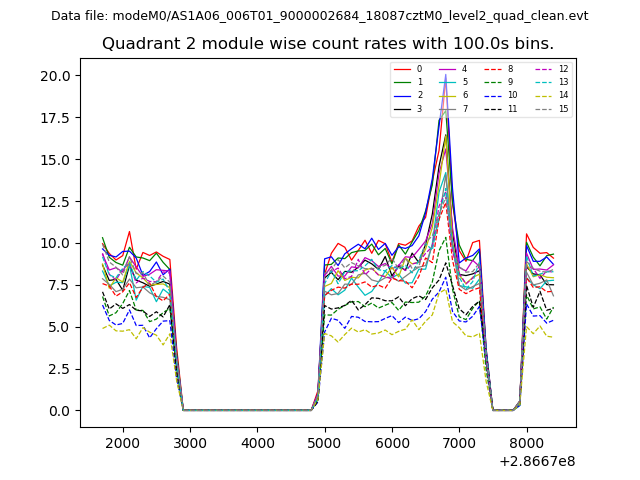 |
 |
| Module-wise count rates for Quadrant D Data is divided into 100 sec bins |
 |
 |
| Parameter | Plot |
|---|---|
| CZT HV Monitor | 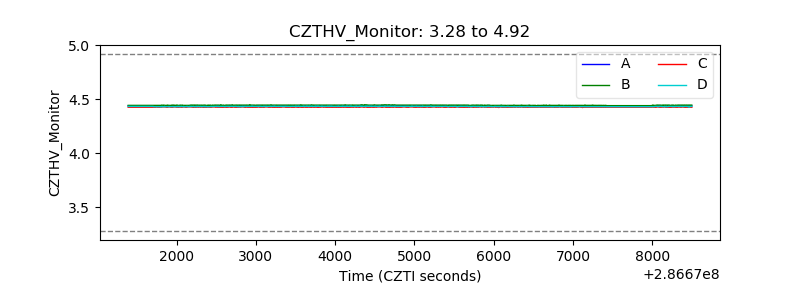 |
| D_VDD | 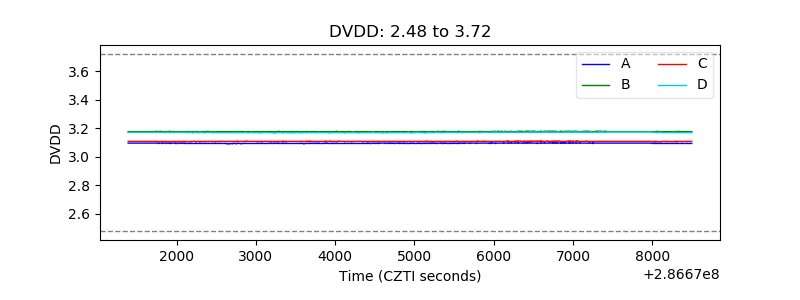 |
| Temperature 1 | 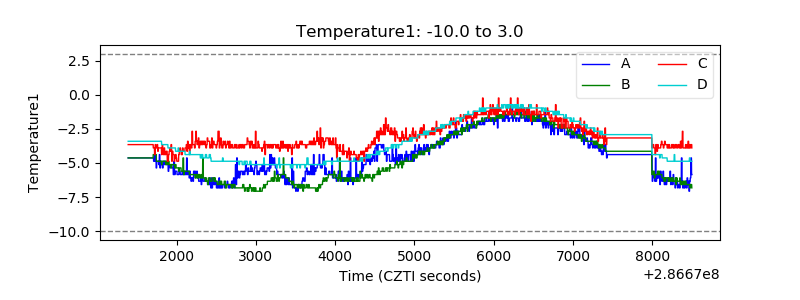 |
| Veto HV Monitor | 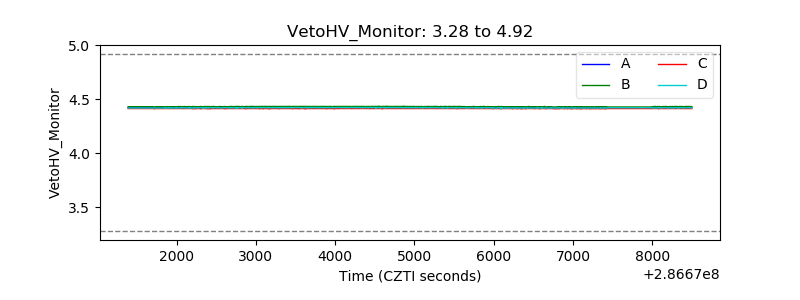 |
| Veto LLD | 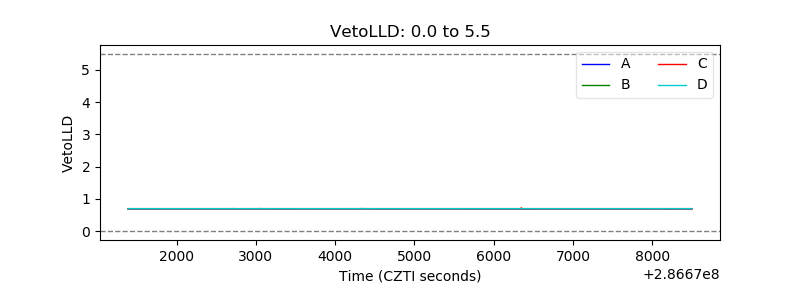 |
| Alpha Counter | 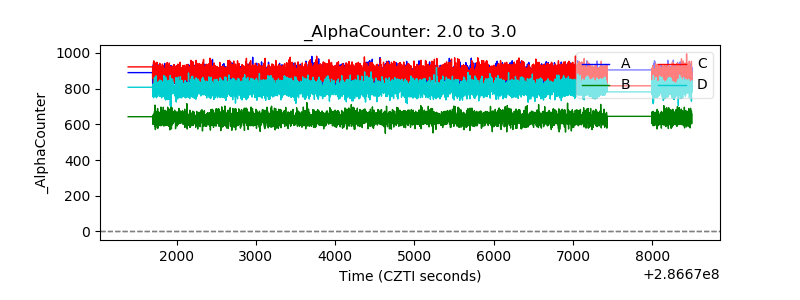 |
| _CPM_Rate | 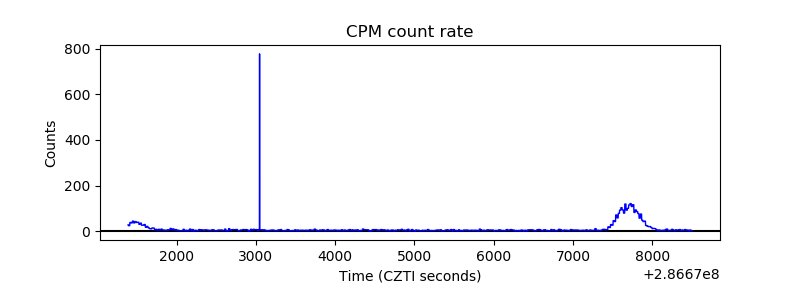 |
| CZT Counter | 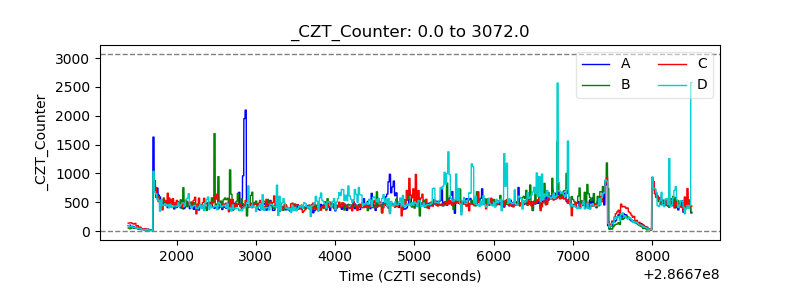 |
| +2.5 Volts monitor |  |
| +5 Volts monitor |  |
| _ROLL_ROT | 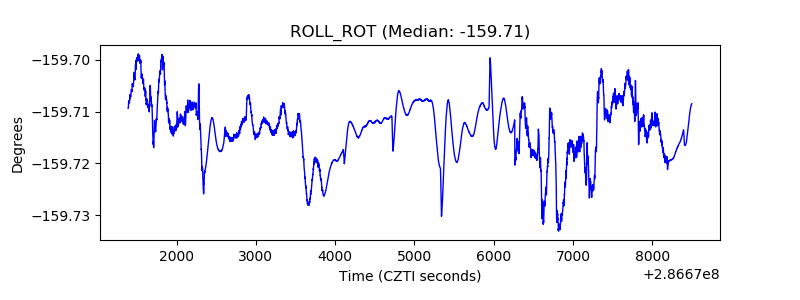 |
| _Roll_DEC | 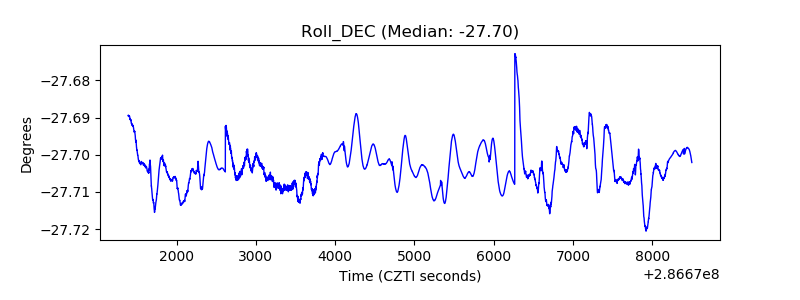 |
| _Roll_RA | 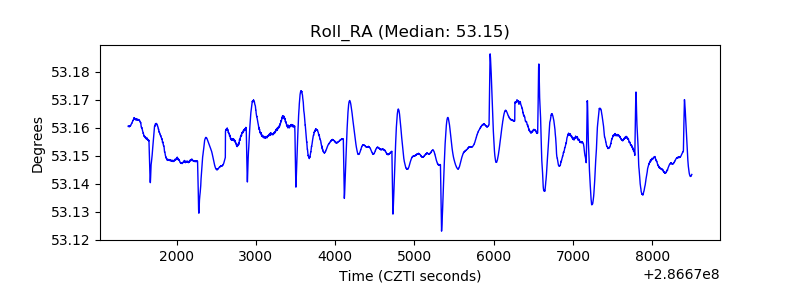 |
| Veto Counter | 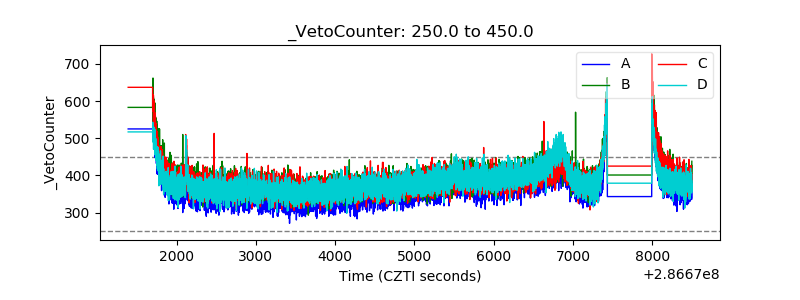 |