| Param | Original file | Final file |
|---|---|---|
| Filename | modeM0/AS1A05_019T01_9000002688cztM0_level2.fits | modeM0/AS1A05_019T01_9000002688cztM0_level2_quad_clean.evt |
| Size (bytes) | 1,191,355,200 | 1,102,988,160 |
| Size | 1.1 GB | 1.0 GB |
| Events in quadrant A | 7,511,442 | 6,826,568 |
| Events in quadrant B | 7,141,866 | 6,781,406 |
| Events in quadrant C | 7,146,886 | 6,353,923 |
| Events in quadrant D | 5,928,472 | 5,095,540 |
| Mode M0 | |||
|---|---|---|---|
| Quadrant | BADHDUFLAG | Total packets | Discarded packets |
| A | 0 | 261317 | 0 |
| B | 0 | 264812 | 0 |
| C | 0 | 253238 | 0 |
| D | 0 | 402210 | 0 |
| Mode M9 | |||
|---|---|---|---|
| Quadrant | BADHDUFLAG | Total packets | Discarded packets |
| A | 0 | 205 | 0 |
| B | 0 | 205 | 0 |
| C | 0 | 205 | 0 |
| D | 0 | 205 | 0 |
| Mode SS | |||
|---|---|---|---|
| Quadrant | BADHDUFLAG | Total packets | Discarded packets |
| A | 0 | 2480 | 0 |
| B | 0 | 2480 | 0 |
| C | 0 | 2480 | 0 |
| D | 0 | 2480 | 0 |
| Quadrant | Total seconds | Saturated seconds | Saturation percentage |
|---|---|---|---|
| A | 121805 | 1903 | 1.562333% |
| B | 121805 | 2000 | 1.641969% |
| C | 121805 | 1689 | 1.386643% |
| D | 121805 | 14344 | 11.776200% |
Noise dominated data is calculated using 1-second bins in cleaned event files. If a bin has >2000 counts, and if more than 50% of those come from <1% of pixels, then it is considered to be noise-dominated and hence unusable.
| Quadrant | # 1 sec bins | Bins with >0 counts | Bins with >2000 counts | High rate bins dominated by noise | Noise dominated (total time) | Noise dominated (detector-on time) | Marked lightcurve |
|---|---|---|---|---|---|---|---|
| A | 142095 | 121799 | 0 | 0 | 0.00% | 0.00% |  |
| B | 142095 | 121793 | 0 | 0 | 0.00% | 0.00% | 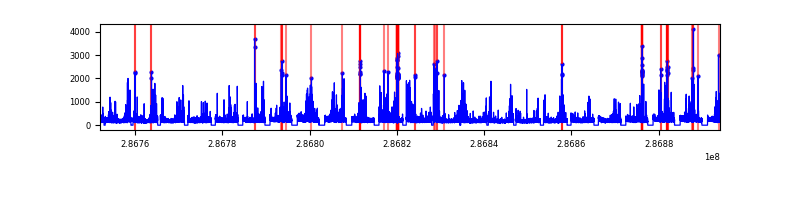 |
| C | 142095 | 121802 | 0 | 0 | 0.00% | 0.00% |  |
| D | 142095 | 121488 | 0 | 0 | 0.00% | 0.00% |  |
Top three noisy pixels from each quadrant. If the there are fewer than three noisy pixels in the level2.evt file, extra rows are filled as -1
| Pixel properties | Quadrant properties | ||||||
|---|---|---|---|---|---|---|---|
| Quadrant | DetID | PixID | Counts | Sigma | Mean | Median | Sigma |
| A | 0 | 29 | 6812 | 10.41 | 1954 | 1837 | 478.1 |
| A | 7 | 110 | 6049 | 8.81 | 1954 | 1837 | 478.1 |
| A | 9 | 19 | 5657 | 7.99 | 1954 | 1837 | 478.1 |
| B | 2 | 9 | 5663 | 10.53 | 1885 | 1800 | 366.9 |
| B | 2 | 8 | 4843 | 8.29 | 1885 | 1800 | 366.9 |
| B | 3 | 17 | 4780 | 8.12 | 1885 | 1800 | 366.9 |
| C | 1 | 80 | 5356 | 7.48 | 1886 | 1758 | 480.8 |
| C | 1 | 81 | 5242 | 7.25 | 1886 | 1758 | 480.8 |
| C | 12 | 241 | 4954 | 6.65 | 1886 | 1758 | 480.8 |
| D | 10 | 190 | 4401 | 6.37 | 1693 | 1536 | 449.6 |
| D | 3 | 14 | 4335 | 6.22 | 1693 | 1536 | 449.6 |
| D | 6 | 231 | 4258 | 6.05 | 1693 | 1536 | 449.6 |
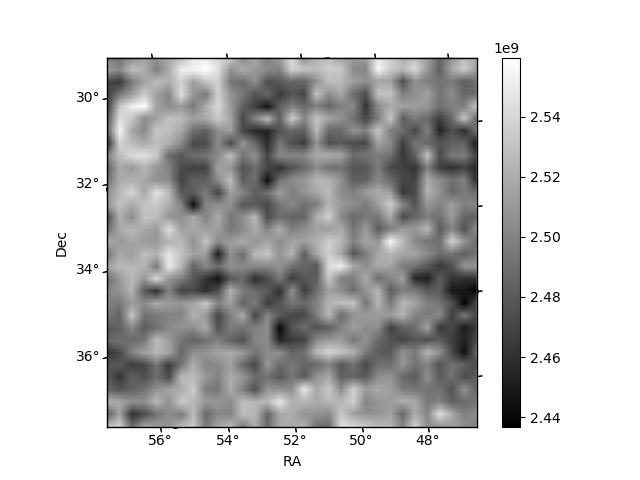
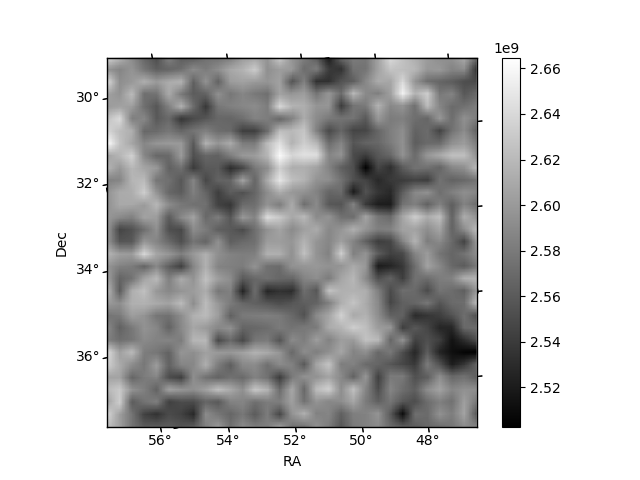
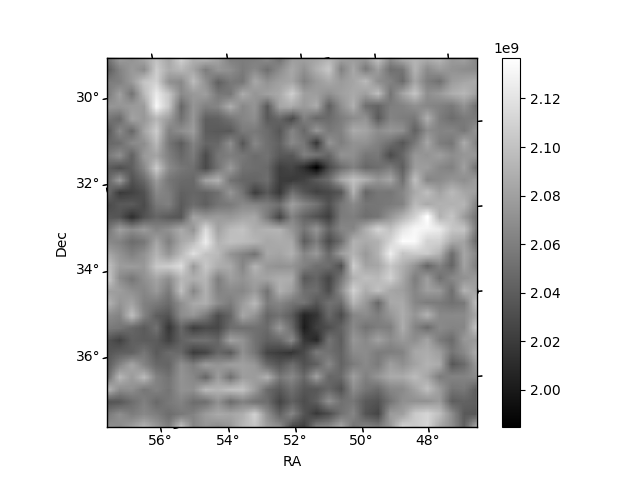
Histogram calculated using DETX and DETY for each event in the final _common_clean file
| Quadrant A |  |
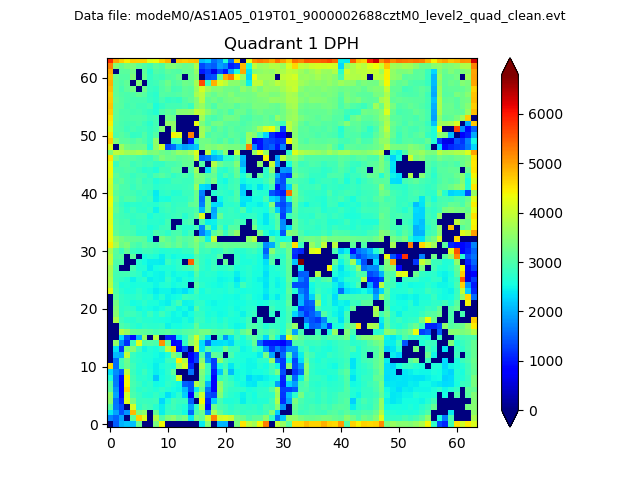 |
Quadrant B |
|---|---|---|---|
| Quadrant D |  |
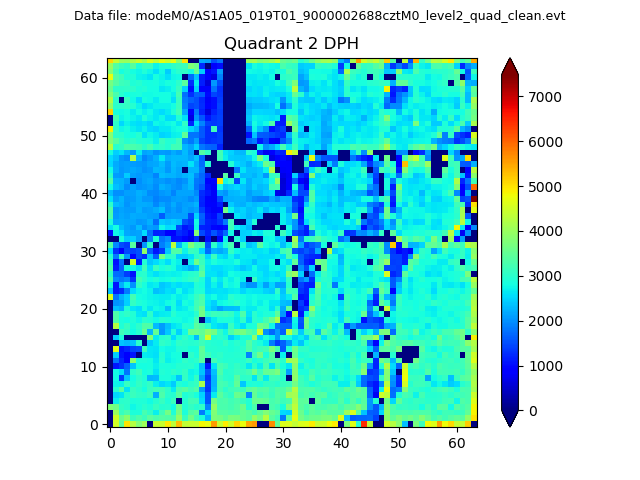 |
Quadrant C |
| Plot type | Count rate plots | Images |
|---|---|---|
| Comparison with Poisson distribution Blue bars denote a histogram of data divided into 1 sec bins. Red curve is a Poisson curve with rate = median count rate of data. |
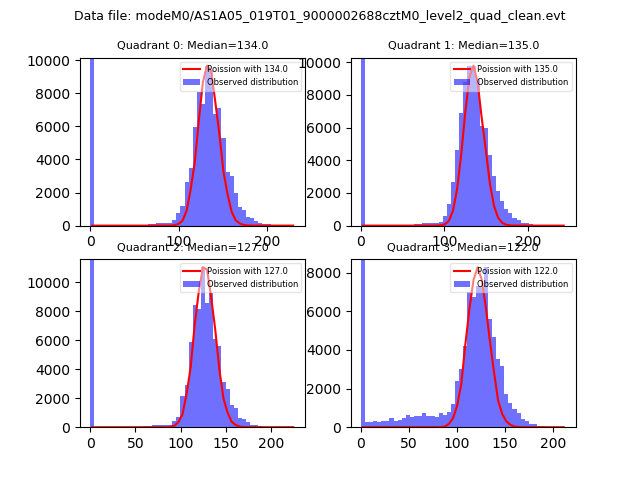 |
 |
| Quadrant-wise count rates Data is divided into 100 sec bins |
 |
|
| Module-wise count rates for Quadrant A Data is divided into 100 sec bins |
 |
 |
| Module-wise count rates for Quadrant B Data is divided into 100 sec bins |
 |
 |
| Module-wise count rates for Quadrant C Data is divided into 100 sec bins |
 |
 |
| Module-wise count rates for Quadrant D Data is divided into 100 sec bins |
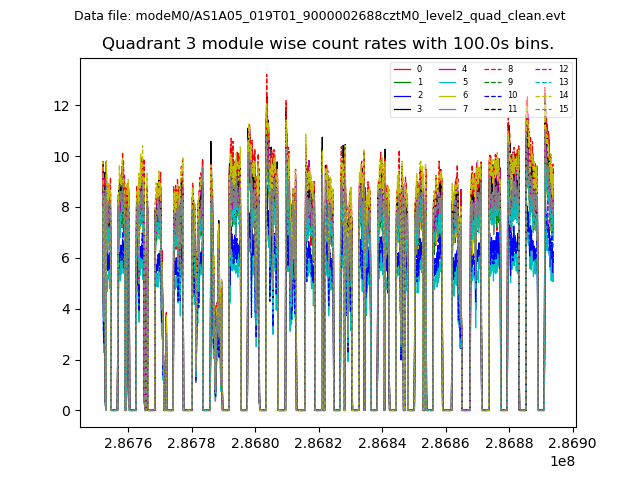 |
 |
| Parameter | Plot |
|---|---|
| CZT HV Monitor | 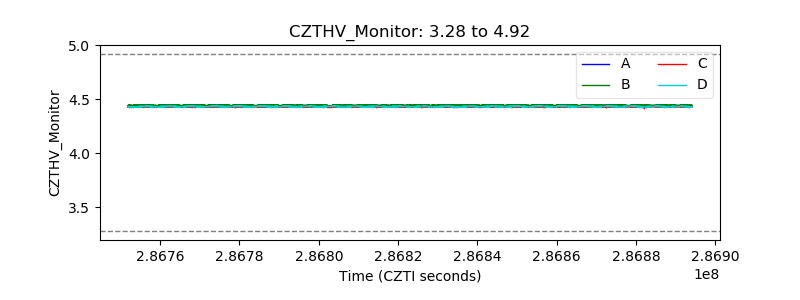 |
| D_VDD | 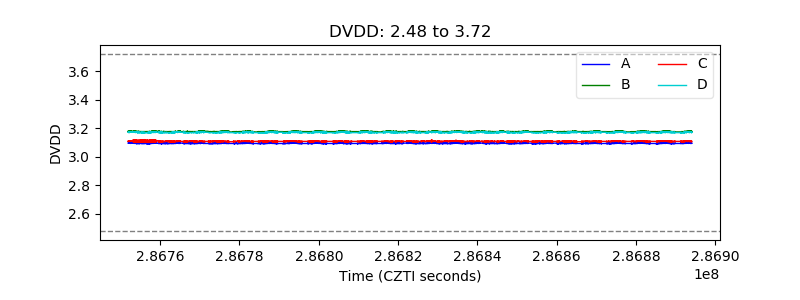 |
| Temperature 1 | 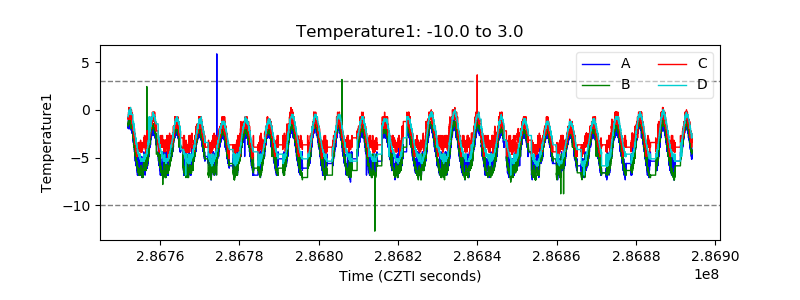 |
| Veto HV Monitor |  |
| Veto LLD |  |
| Alpha Counter |  |
| _CPM_Rate |  |
| CZT Counter |  |
| +2.5 Volts monitor |  |
| +5 Volts monitor |  |
| _ROLL_ROT |  |
| _Roll_DEC | 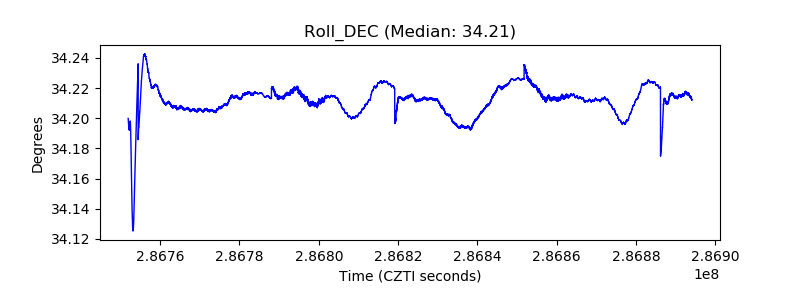 |
| _Roll_RA |  |
| Veto Counter |  |