| Param | Original file | Final file |
|---|---|---|
| Filename | modeM0/AS1A05_019T01_9000002688_18101cztM0_level2.evt | modeM0/AS1A05_019T01_9000002688_18101cztM0_level2_quad_clean.evt |
| Size (bytes) | 1,026,826,560 | 152,625,600 |
| Size | 979.3 MB | 145.6 MB |
| Events in quadrant A | 6,211,965 | 967,660 |
| Events in quadrant B | 6,592,703 | 968,921 |
| Events in quadrant C | 6,329,874 | 929,941 |
| Events in quadrant D | 11,063,041 | 835,683 |
| Mode M0 | |||
|---|---|---|---|
| Quadrant | BADHDUFLAG | Total packets | Discarded packets |
| A | 0 | 27212 | 3 |
| B | 0 | 28207 | 3 |
| C | 0 | 27248 | 3 |
| D | 0 | 41908 | 3 |
| Mode M9 | |||
|---|---|---|---|
| Quadrant | BADHDUFLAG | Total packets | Discarded packets |
| A | 0 | 20 | 0 |
| B | 0 | 20 | 0 |
| C | 0 | 20 | 0 |
| D | 0 | 20 | 0 |
| Mode SS | |||
|---|---|---|---|
| Quadrant | BADHDUFLAG | Total packets | Discarded packets |
| A | 0 | 270 | 0 |
| B | 0 | 270 | 0 |
| C | 0 | 270 | 0 |
| D | 0 | 270 | 0 |
| Quadrant | Total seconds | Saturated seconds | Saturation percentage |
|---|---|---|---|
| A | 13316 | 109 | 0.818564% |
| B | 13317 | 164 | 1.231509% |
| C | 13316 | 158 | 1.186543% |
| D | 13316 | 1485 | 11.151998% |
Noise dominated data is calculated using 1-second bins in cleaned event files. If a bin has >2000 counts, and if more than 50% of those come from <1% of pixels, then it is considered to be noise-dominated and hence unusable.
| Quadrant | # 1 sec bins | Bins with >0 counts | Bins with >2000 counts | High rate bins dominated by noise | Noise dominated (total time) | Noise dominated (detector-on time) | Marked lightcurve |
|---|---|---|---|---|---|---|---|
| A | 15221 | 13319 | 1 | 1 | 0.01% | 0.01% | 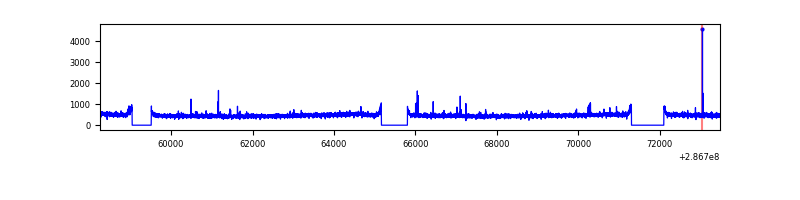 |
| B | 15222 | 13320 | 25 | 25 | 0.16% | 0.19% | 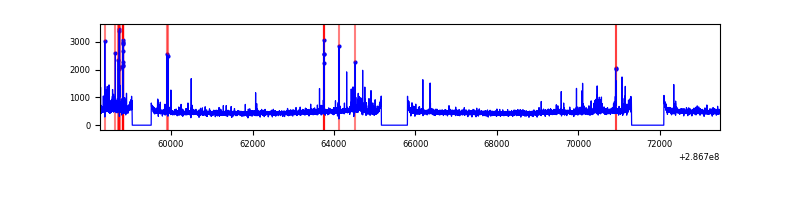 |
| C | 15221 | 13319 | 3 | 3 | 0.02% | 0.02% | 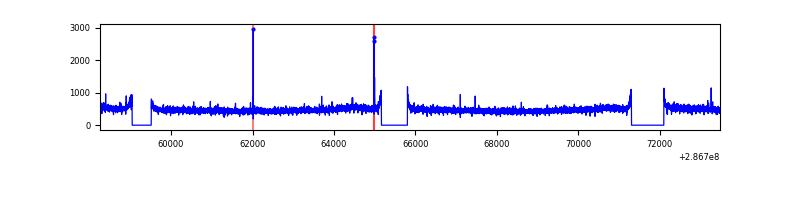 |
| D | 15221 | 13318 | 1328 | 1328 | 8.72% | 9.97% | 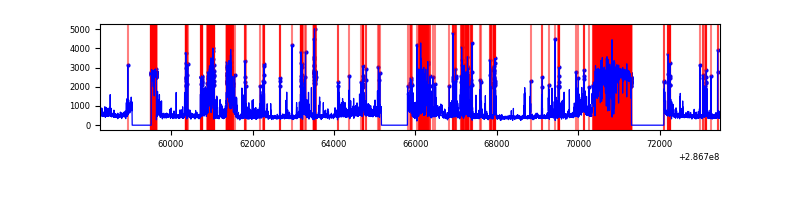 |
Top three noisy pixels from each quadrant. If the there are fewer than three noisy pixels in the level2.evt file, extra rows are filled as -1
| Pixel properties | Quadrant properties | ||||||
|---|---|---|---|---|---|---|---|
| Quadrant | DetID | PixID | Counts | Sigma | Mean | Median | Sigma |
| A | 4 | 2 | 53133 | 159.49 | 1598 | 1562 | 323.3 |
| A | 15 | 174 | 14562 | 40.2 | 1598 | 1562 | 323.3 |
| A | 0 | 226 | 14005 | 38.48 | 1598 | 1562 | 323.3 |
| B | 7 | 220 | 153822 | 496.45 | 1594 | 1552 | 306.7 |
| B | 3 | 64 | 80103 | 256.1 | 1594 | 1552 | 306.7 |
| B | 12 | 111 | 37214 | 116.27 | 1594 | 1552 | 306.7 |
| C | 14 | 238 | 234693 | 643.31 | 1534 | 1543 | 362.4 |
| C | 3 | 233 | 90677 | 245.94 | 1534 | 1543 | 362.4 |
| C | 9 | 160 | 15764 | 39.24 | 1534 | 1543 | 362.4 |
| D | 7 | 238 | 3577275 | 9986.75 | 1469 | 1426 | 358.1 |
| D | 11 | 176 | 1184610 | 3304.43 | 1469 | 1426 | 358.1 |
| D | 12 | 110 | 325115 | 904.01 | 1469 | 1426 | 358.1 |
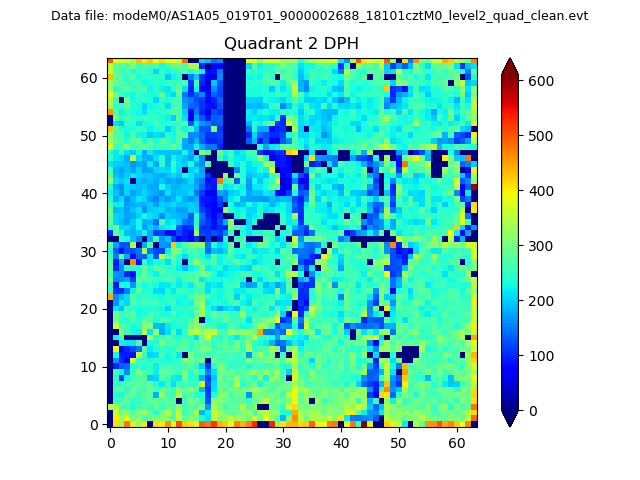
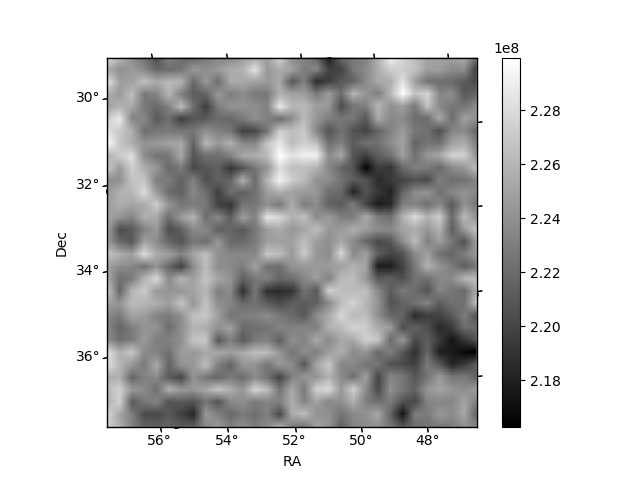
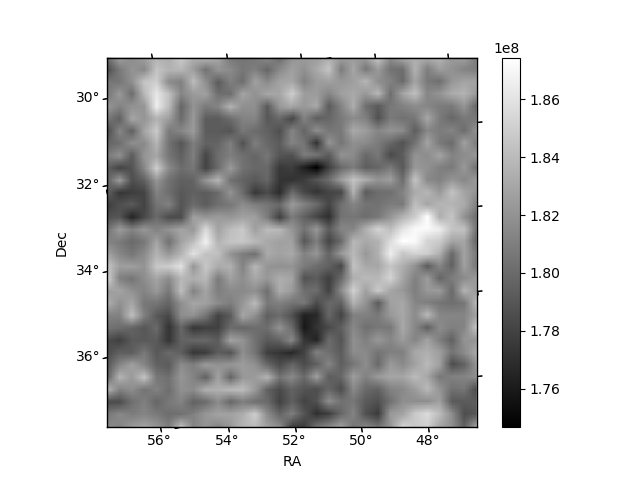
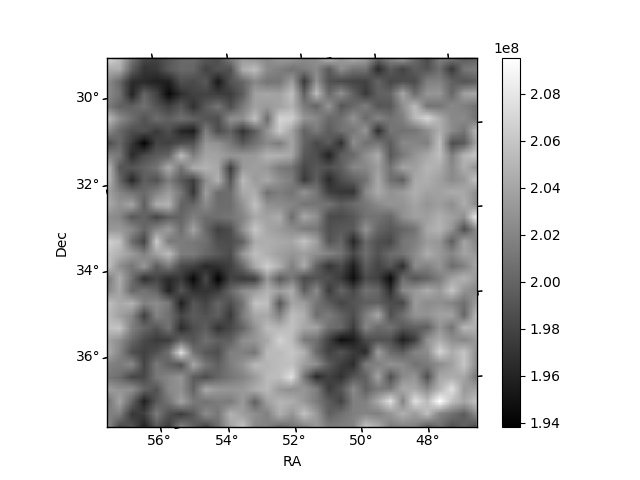
Histogram calculated using DETX and DETY for each event in the final _common_clean file
| Quadrant A | 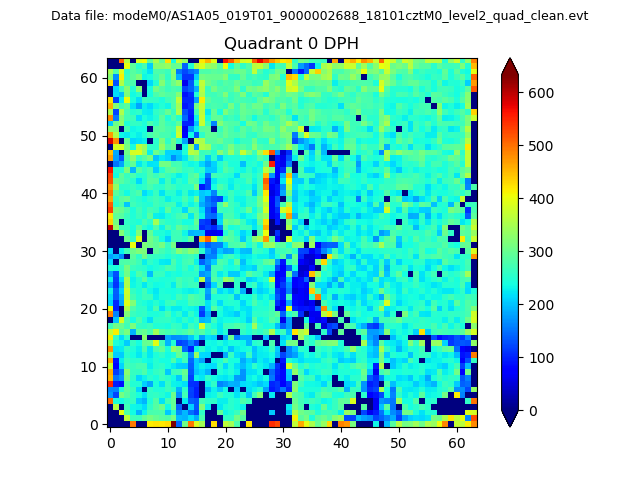 |
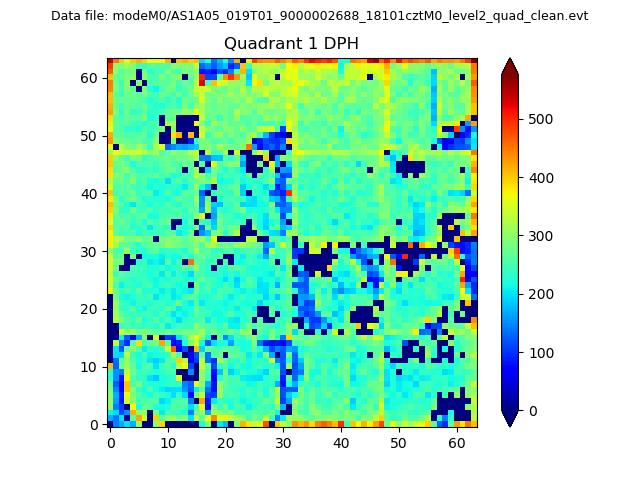 |
Quadrant B |
|---|---|---|---|
| Quadrant D | 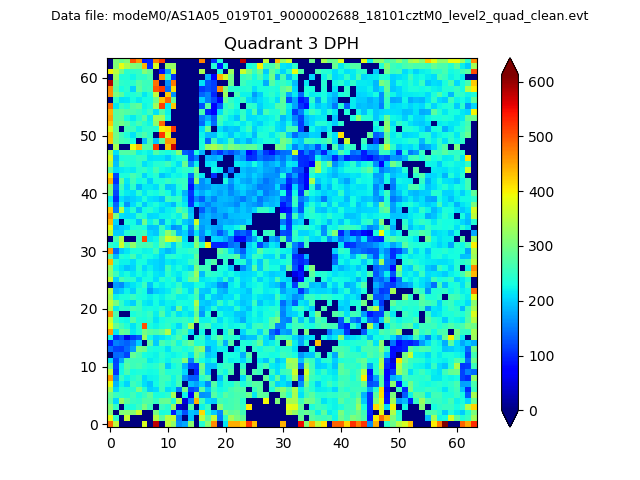 |
 |
Quadrant C |
| Plot type | Count rate plots | Images |
|---|---|---|
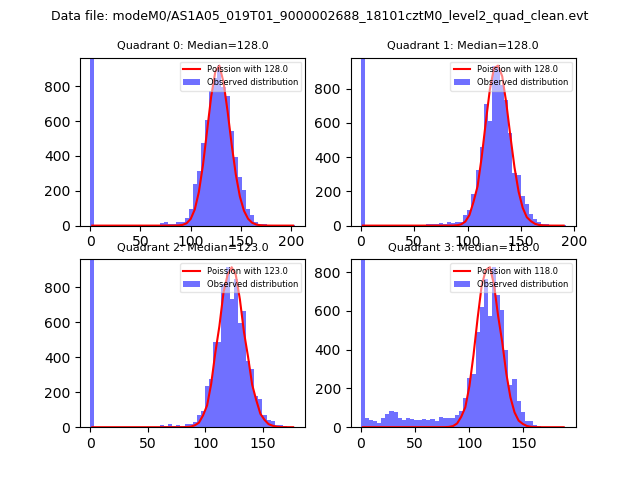
| Comparison with Poisson distribution Blue bars denote a histogram of data divided into 1 sec bins. Red curve is a Poisson curve with rate = median count rate of data. |
 |
 |
| Quadrant-wise count rates Data is divided into 100 sec bins |
 |
|
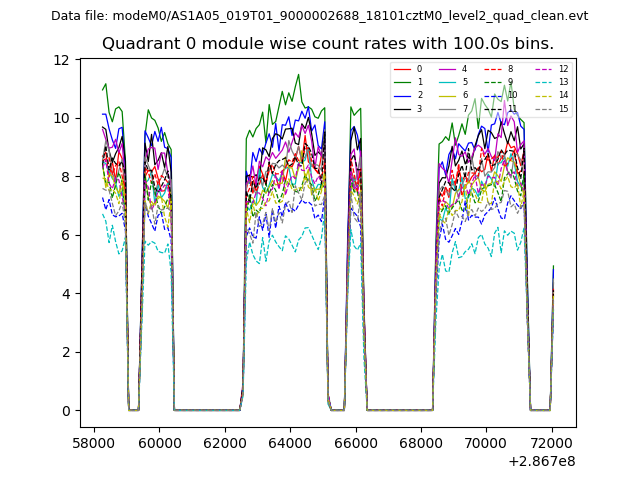
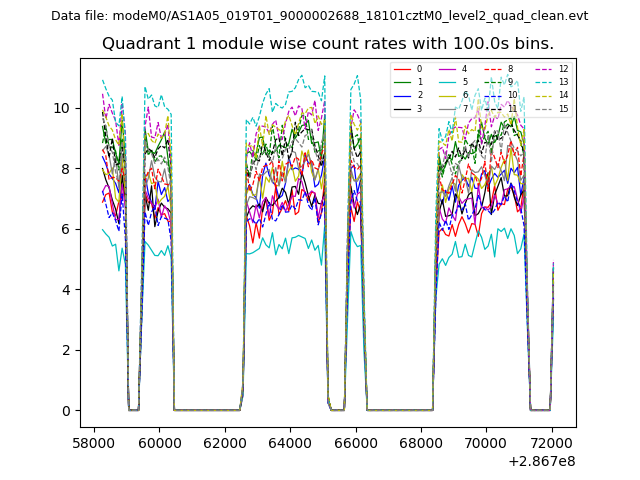
| Module-wise count rates for Quadrant A Data is divided into 100 sec bins |
 |
 |
| Module-wise count rates for Quadrant B Data is divided into 100 sec bins |
 |
 |
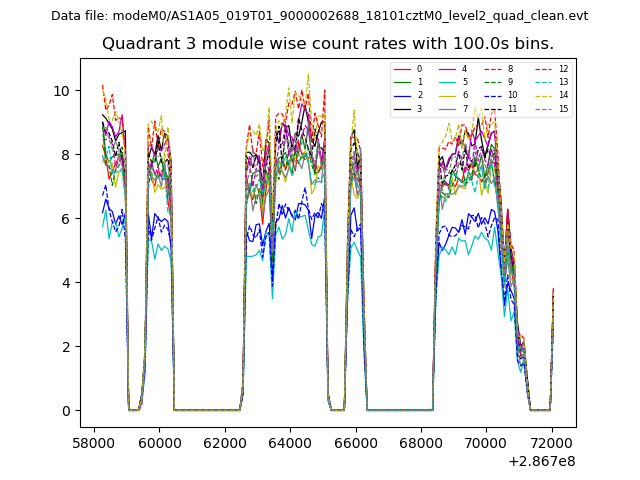
| Module-wise count rates for Quadrant C Data is divided into 100 sec bins |
 |
 |
| Module-wise count rates for Quadrant D Data is divided into 100 sec bins |
 |
 |
| Parameter | Plot |
|---|---|
| CZT HV Monitor | 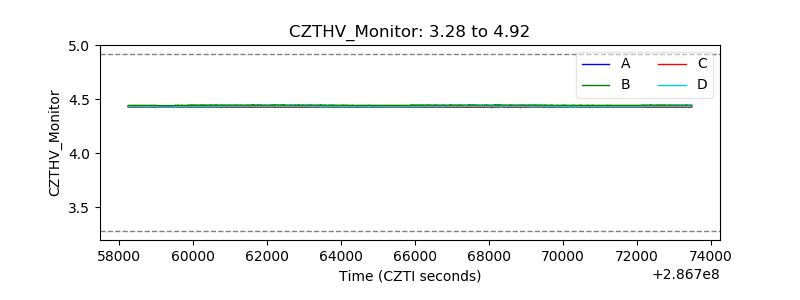 |
| D_VDD | 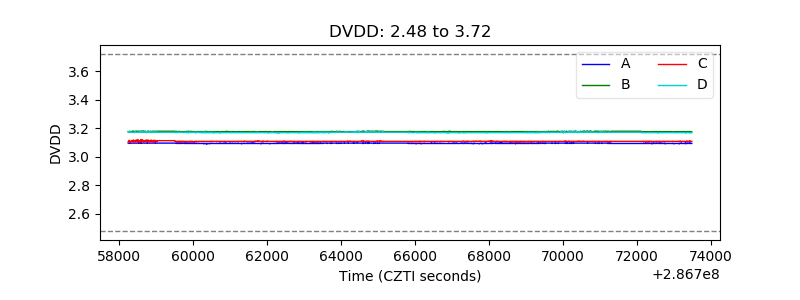 |
| Temperature 1 | 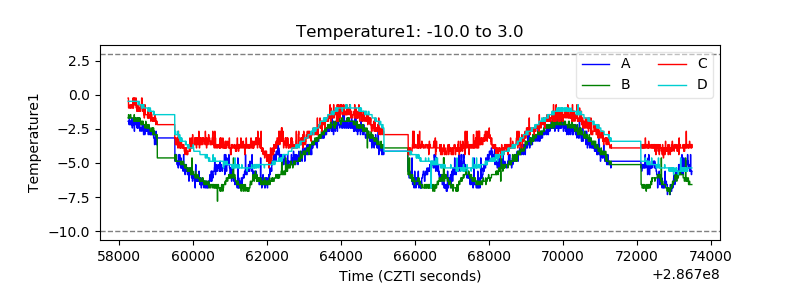 |
| Veto HV Monitor | 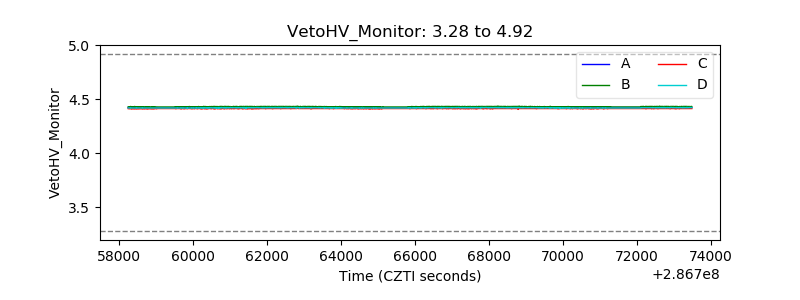 |
| Veto LLD | 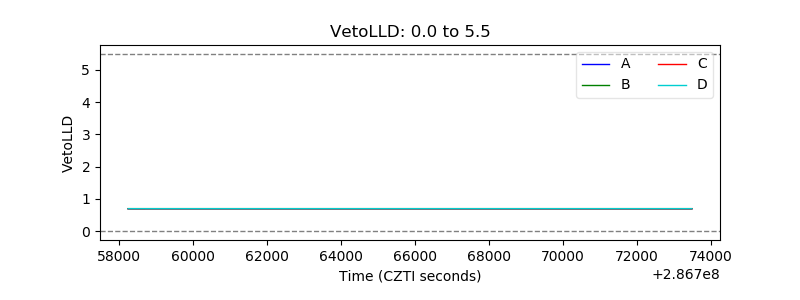 |
| Alpha Counter | 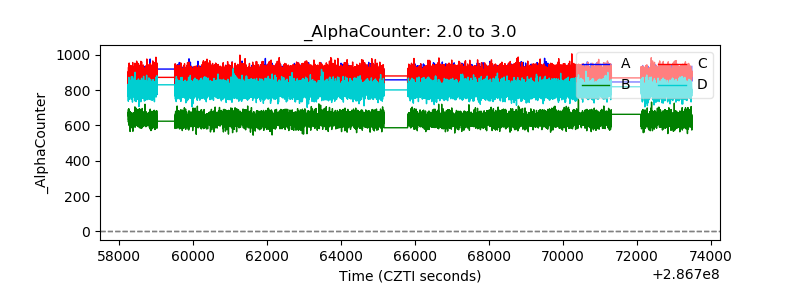 |
| _CPM_Rate |  |
| CZT Counter | 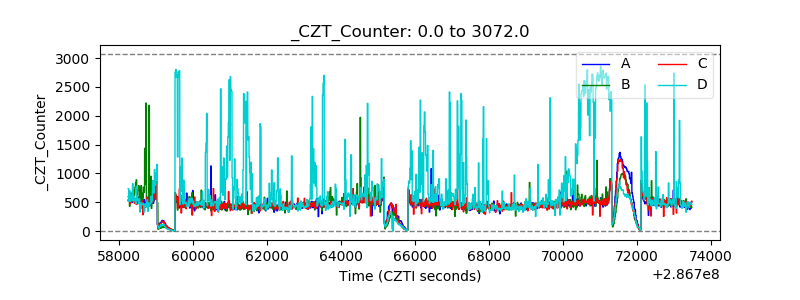 |
| +2.5 Volts monitor |  |
| +5 Volts monitor | 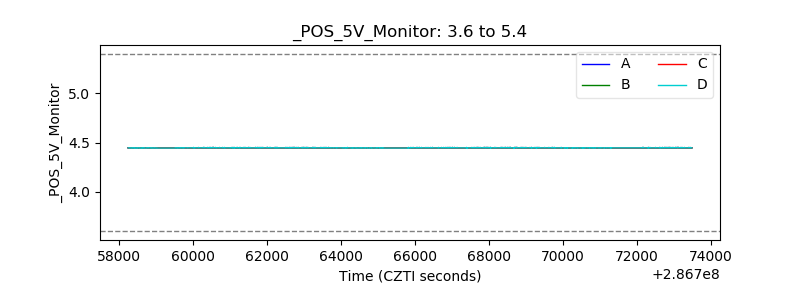 |
| _ROLL_ROT | 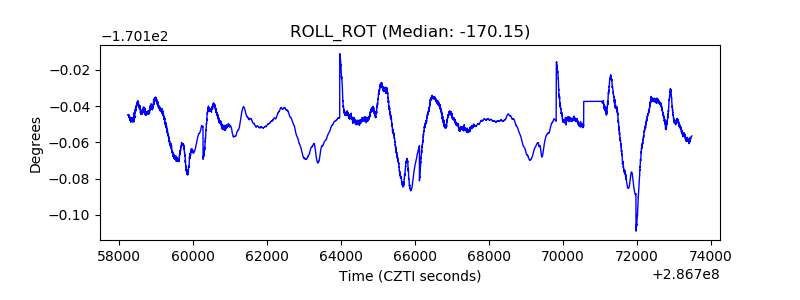 |
| _Roll_DEC | 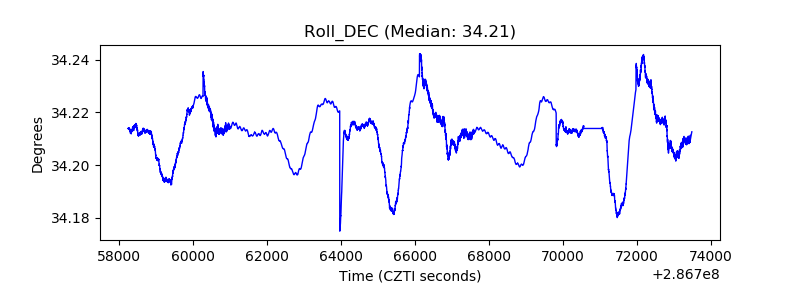 |
| _Roll_RA | 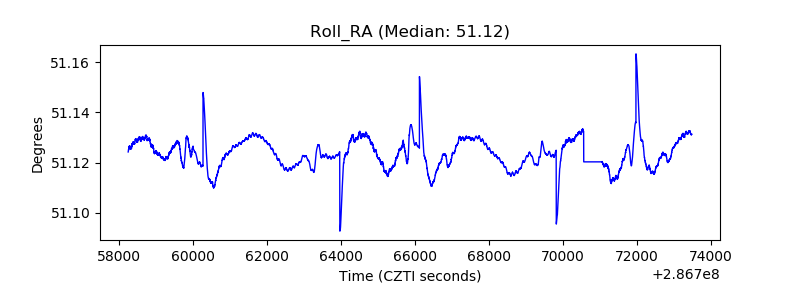 |
| Veto Counter | 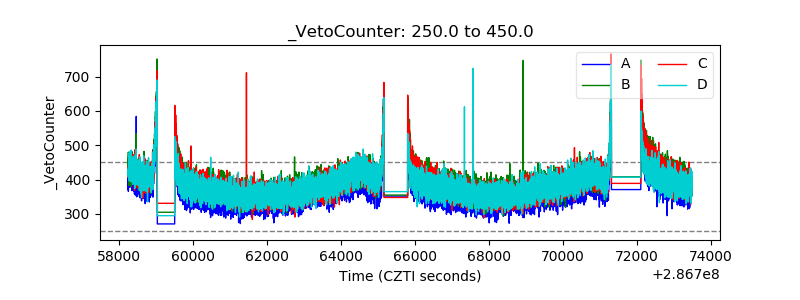 |