| Param | Original file | Final file |
|---|---|---|
| Filename | modeM0/AS1A05_019T01_9000002688_18102cztM0_level2.evt | modeM0/AS1A05_019T01_9000002688_18102cztM0_level2_quad_clean.evt |
| Size (bytes) | 592,505,280 | 76,311,360 |
| Size | 565.1 MB | 72.8 MB |
| Events in quadrant A | 3,483,690 | 477,531 |
| Events in quadrant B | 3,612,086 | 478,133 |
| Events in quadrant C | 3,559,670 | 456,772 |
| Events in quadrant D | 6,796,499 | 392,602 |
| Mode M0 | |||
|---|---|---|---|
| Quadrant | BADHDUFLAG | Total packets | Discarded packets |
| A | 0 | 14917 | 1 |
| B | 0 | 15154 | 1 |
| C | 0 | 15061 | 1 |
| D | 0 | 25174 | 1 |
| Mode M9 | |||
|---|---|---|---|
| Quadrant | BADHDUFLAG | Total packets | Discarded packets |
| A | 0 | 18 | 0 |
| B | 0 | 18 | 0 |
| C | 0 | 18 | 0 |
| D | 0 | 18 | 0 |
| Mode SS | |||
|---|---|---|---|
| Quadrant | BADHDUFLAG | Total packets | Discarded packets |
| A | 0 | 148 | 0 |
| B | 0 | 148 | 0 |
| C | 0 | 148 | 0 |
| D | 0 | 148 | 0 |
| Quadrant | Total seconds | Saturated seconds | Saturation percentage |
|---|---|---|---|
| A | 7262 | 75 | 1.032773% |
| B | 7262 | 101 | 1.390801% |
| C | 7262 | 108 | 1.487194% |
| D | 7263 | 1097 | 15.103952% |
Noise dominated data is calculated using 1-second bins in cleaned event files. If a bin has >2000 counts, and if more than 50% of those come from <1% of pixels, then it is considered to be noise-dominated and hence unusable.
| Quadrant | # 1 sec bins | Bins with >0 counts | Bins with >2000 counts | High rate bins dominated by noise | Noise dominated (total time) | Noise dominated (detector-on time) | Marked lightcurve |
|---|---|---|---|---|---|---|---|
| A | 9002 | 7264 | 1 | 1 | 0.01% | 0.01% | 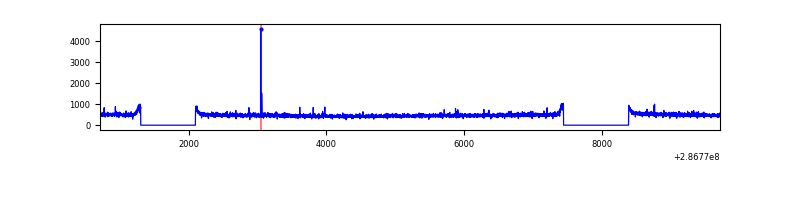 |
| B | 9002 | 7264 | 2 | 2 | 0.02% | 0.03% | 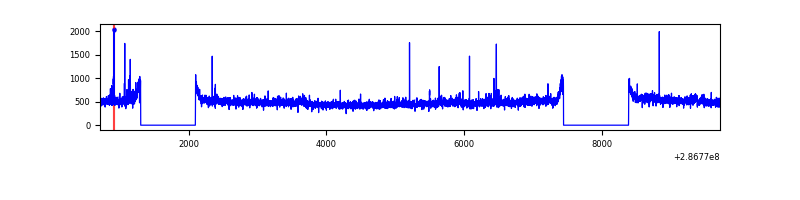 |
| C | 9002 | 7264 | 0 | 0 | 0.00% | 0.00% | 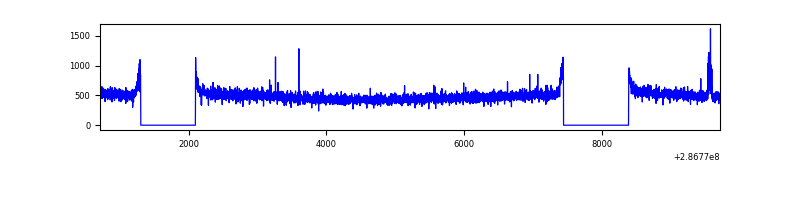 |
| D | 9003 | 7264 | 954 | 954 | 10.60% | 13.13% | 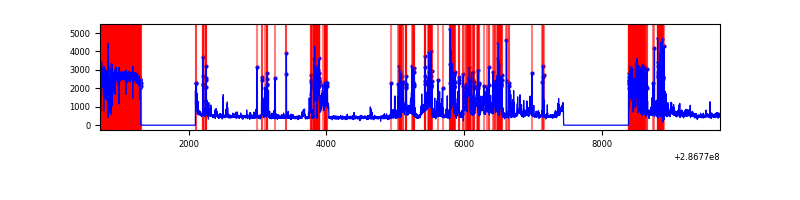 |
Top three noisy pixels from each quadrant. If the there are fewer than three noisy pixels in the level2.evt file, extra rows are filled as -1
| Pixel properties | Quadrant properties | ||||||
|---|---|---|---|---|---|---|---|
| Quadrant | DetID | PixID | Counts | Sigma | Mean | Median | Sigma |
| A | 4 | 2 | 18955 | 98.97 | 901 | 881 | 182.6 |
| A | 0 | 226 | 7799 | 37.88 | 901 | 881 | 182.6 |
| A | 3 | 137 | 6955 | 33.26 | 901 | 881 | 182.6 |
| B | 0 | 229 | 22843 | 125.91 | 898 | 873 | 174.5 |
| B | 12 | 111 | 20917 | 114.87 | 898 | 873 | 174.5 |
| B | 11 | 111 | 18335 | 100.07 | 898 | 873 | 174.5 |
| C | 14 | 238 | 133107 | 653.37 | 861 | 866 | 202.4 |
| C | 3 | 233 | 38761 | 187.23 | 861 | 866 | 202.4 |
| C | 9 | 160 | 13318 | 61.52 | 861 | 866 | 202.4 |
| D | 7 | 238 | 2466149 | 12562.11 | 803 | 778 | 196.3 |
| D | 11 | 176 | 721894 | 3674.39 | 803 | 778 | 196.3 |
| D | 13 | 104 | 255043 | 1295.59 | 803 | 778 | 196.3 |
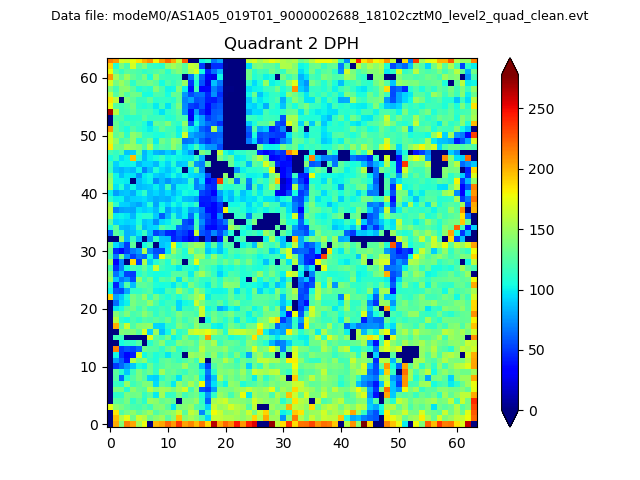
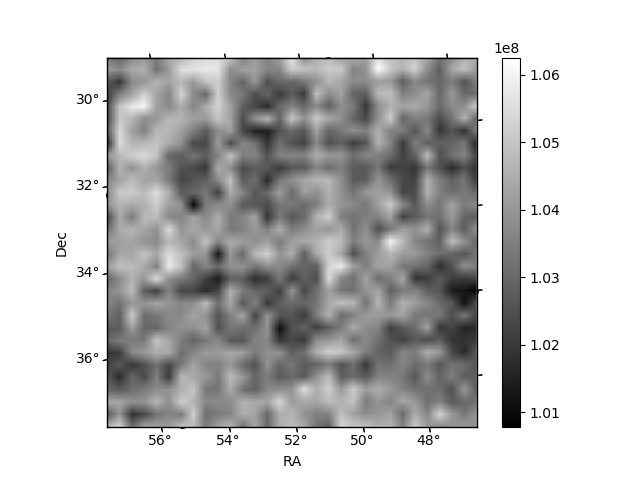
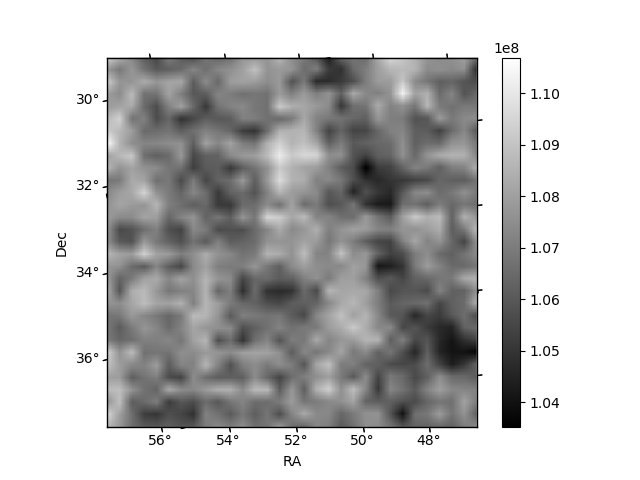
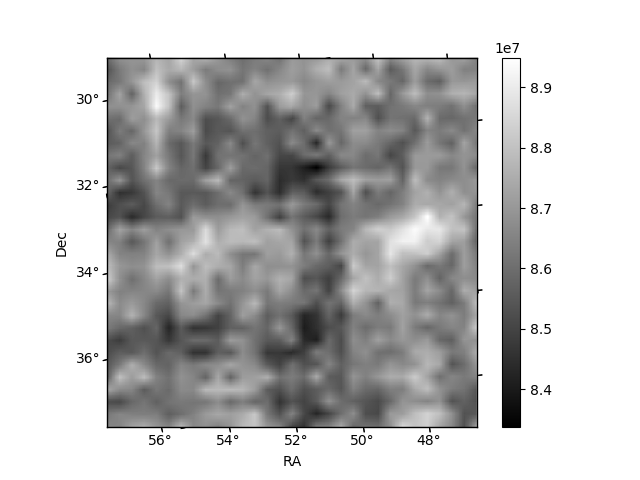
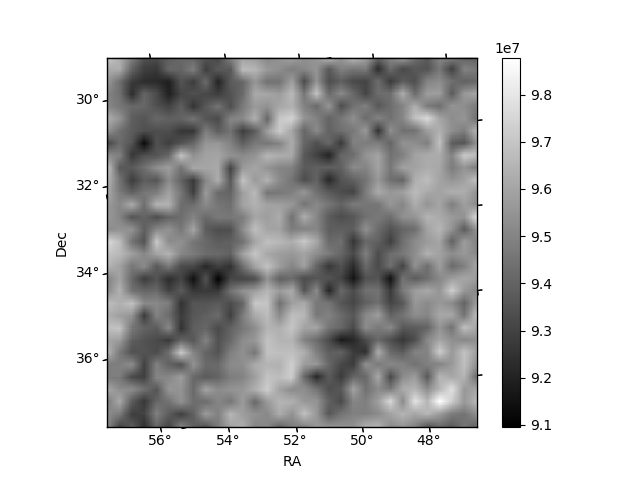
Histogram calculated using DETX and DETY for each event in the final _common_clean file
| Quadrant A | 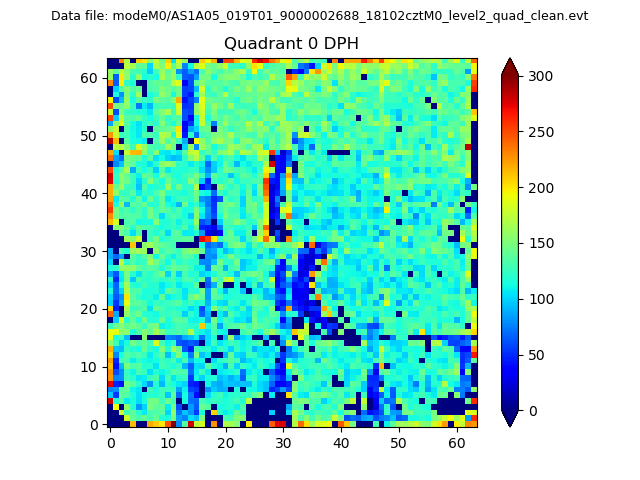 |
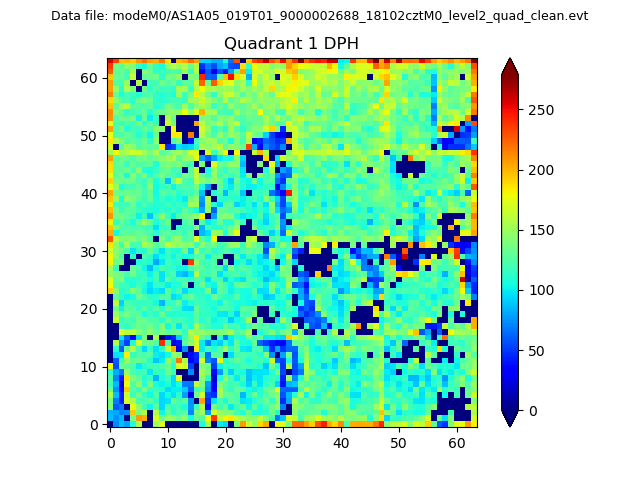 |
Quadrant B |
|---|---|---|---|
| Quadrant D | 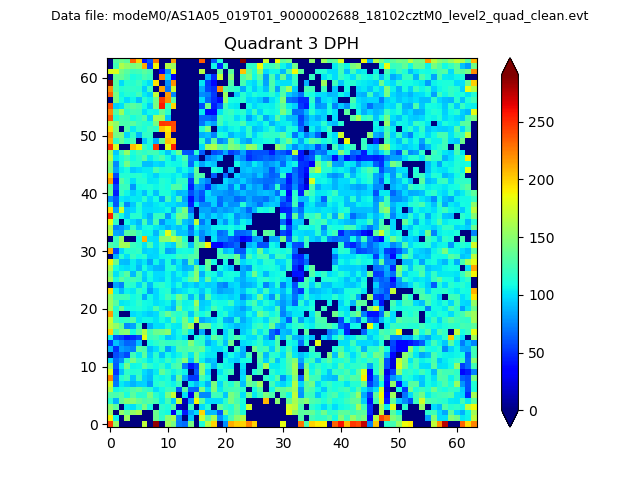 |
 |
Quadrant C |
| Plot type | Count rate plots | Images |
|---|---|---|
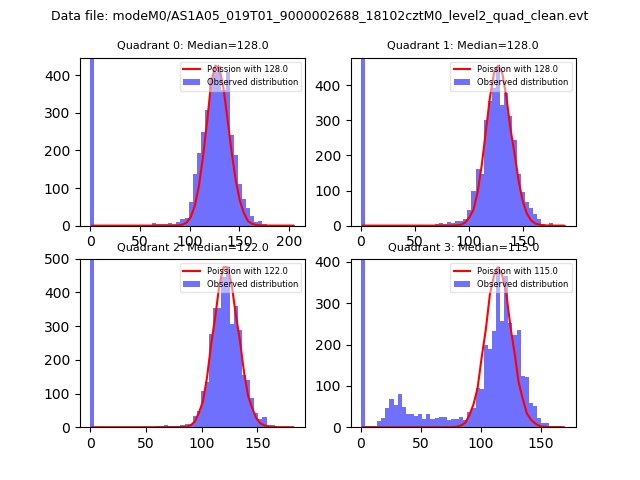
| Comparison with Poisson distribution Blue bars denote a histogram of data divided into 1 sec bins. Red curve is a Poisson curve with rate = median count rate of data. |
 |
 |
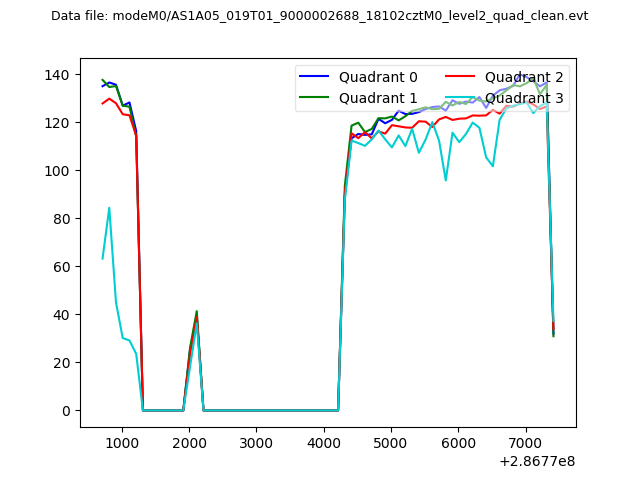
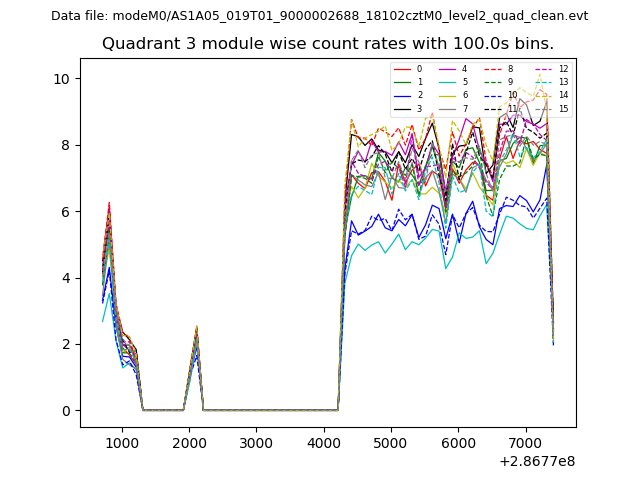
| Quadrant-wise count rates Data is divided into 100 sec bins |
 |
|
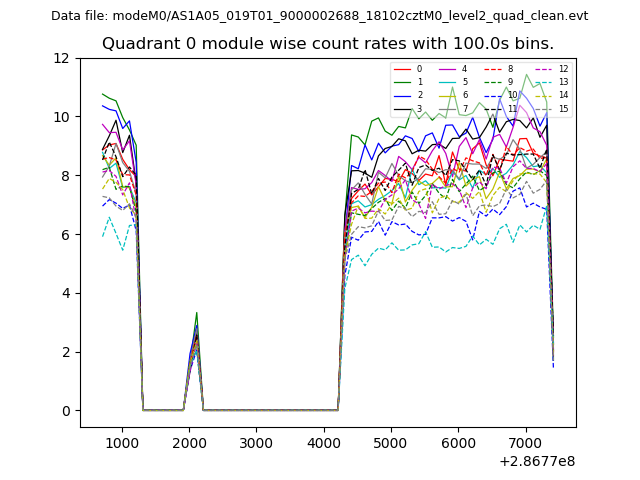
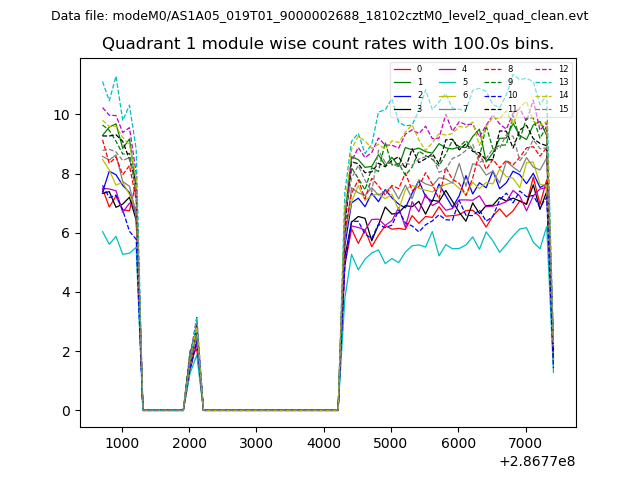
| Module-wise count rates for Quadrant A Data is divided into 100 sec bins |
 |
 |
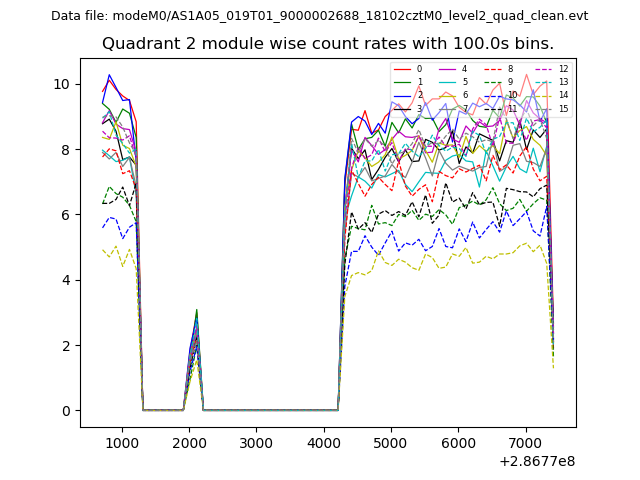
| Module-wise count rates for Quadrant B Data is divided into 100 sec bins |
 |
 |
| Module-wise count rates for Quadrant C Data is divided into 100 sec bins |
 |
 |
| Module-wise count rates for Quadrant D Data is divided into 100 sec bins |
 |
 |
| Parameter | Plot |
|---|---|
| CZT HV Monitor | 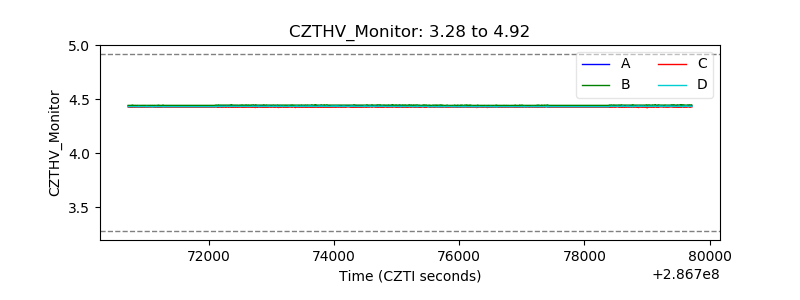 |
| D_VDD | 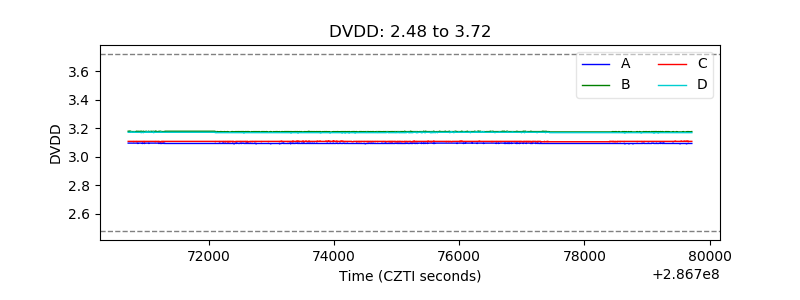 |
| Temperature 1 | 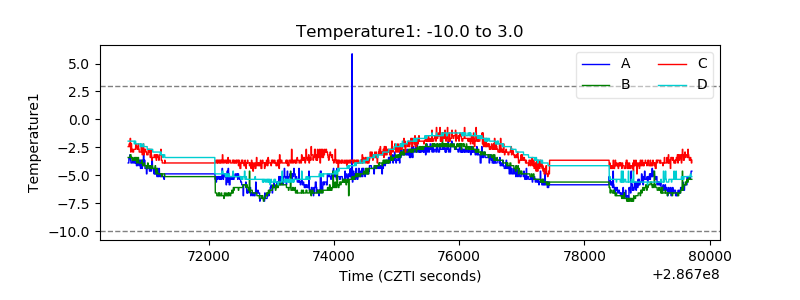 |
| Veto HV Monitor | 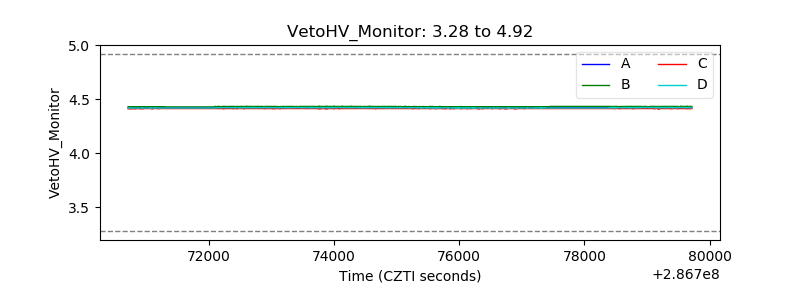 |
| Veto LLD | 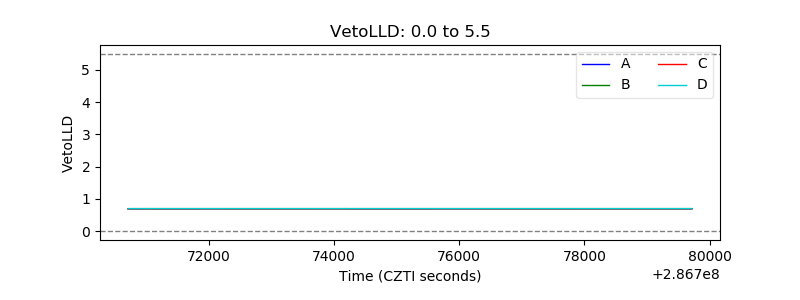 |
| Alpha Counter | 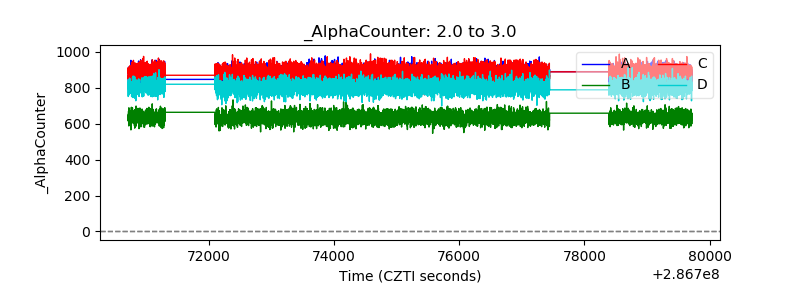 |
| _CPM_Rate | 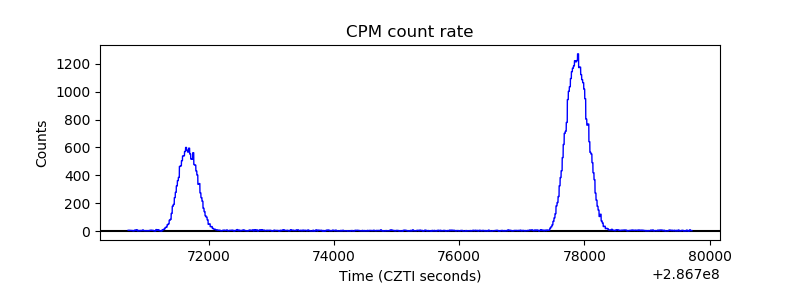 |
| CZT Counter | 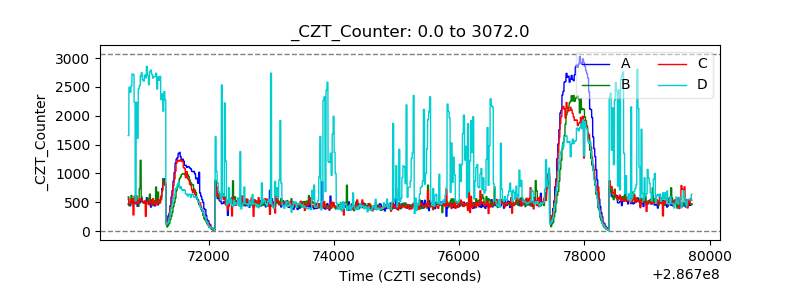 |
| +2.5 Volts monitor |  |
| +5 Volts monitor |  |
| _ROLL_ROT | 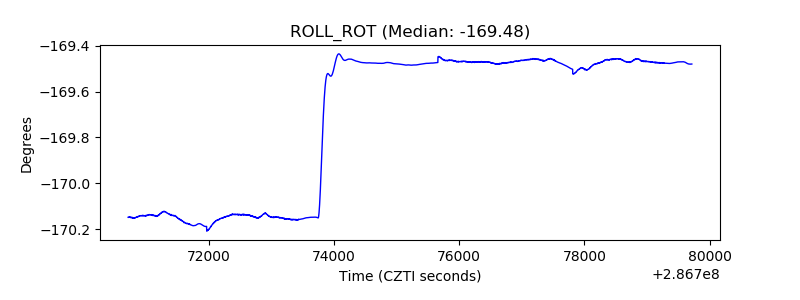 |
| _Roll_DEC | 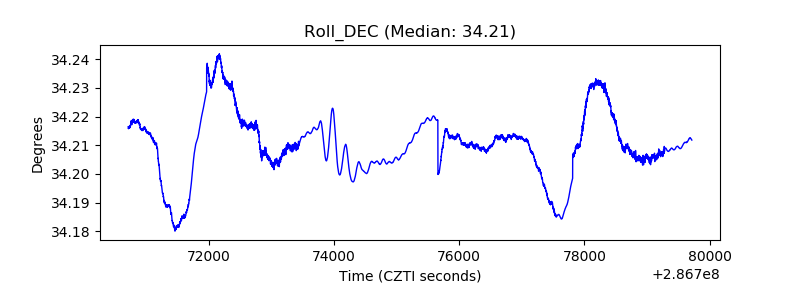 |
| _Roll_RA | 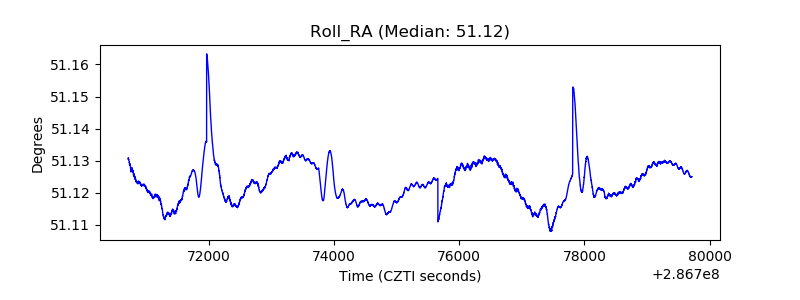 |
| Veto Counter | 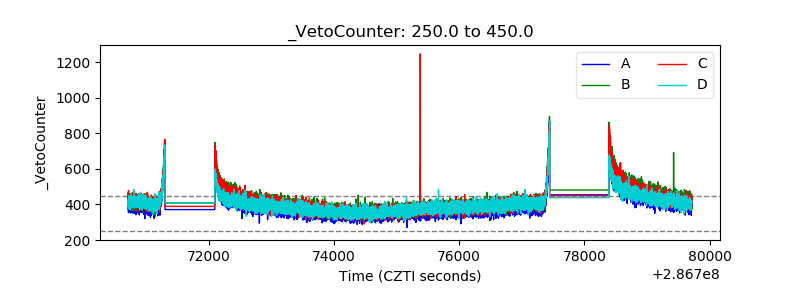 |