| Param | Original file | Final file |
|---|---|---|
| Filename | modeM0/AS1A05_019T01_9000002688_18103cztM0_level2.evt | modeM0/AS1A05_019T01_9000002688_18103cztM0_level2_quad_clean.evt |
| Size (bytes) | 589,818,240 | 69,744,960 |
| Size | 562.5 MB | 66.5 MB |
| Events in quadrant A | 3,229,204 | 439,859 |
| Events in quadrant B | 3,368,511 | 442,500 |
| Events in quadrant C | 3,276,602 | 421,608 |
| Events in quadrant D | 7,545,075 | 351,154 |
| Mode M0 | |||
|---|---|---|---|
| Quadrant | BADHDUFLAG | Total packets | Discarded packets |
| A | 0 | 13735 | 1 |
| B | 0 | 14038 | 1 |
| C | 0 | 13784 | 1 |
| D | 0 | 26833 | 1 |
| Mode M9 | |||
|---|---|---|---|
| Quadrant | BADHDUFLAG | Total packets | Discarded packets |
| A | 0 | 11 | 0 |
| B | 0 | 11 | 0 |
| C | 0 | 11 | 0 |
| D | 0 | 11 | 0 |
| Mode SS | |||
|---|---|---|---|
| Quadrant | BADHDUFLAG | Total packets | Discarded packets |
| A | 0 | 132 | 0 |
| B | 0 | 132 | 0 |
| C | 0 | 132 | 0 |
| D | 0 | 132 | 0 |
| Quadrant | Total seconds | Saturated seconds | Saturation percentage |
|---|---|---|---|
| A | 6543 | 39 | 0.596057% |
| B | 6544 | 50 | 0.764059% |
| C | 6544 | 57 | 0.871027% |
| D | 6544 | 1443 | 22.050733% |
Noise dominated data is calculated using 1-second bins in cleaned event files. If a bin has >2000 counts, and if more than 50% of those come from <1% of pixels, then it is considered to be noise-dominated and hence unusable.
| Quadrant | # 1 sec bins | Bins with >0 counts | Bins with >2000 counts | High rate bins dominated by noise | Noise dominated (total time) | Noise dominated (detector-on time) | Marked lightcurve |
|---|---|---|---|---|---|---|---|
| A | 7643 | 6544 | 0 | 0 | 0.00% | 0.00% | 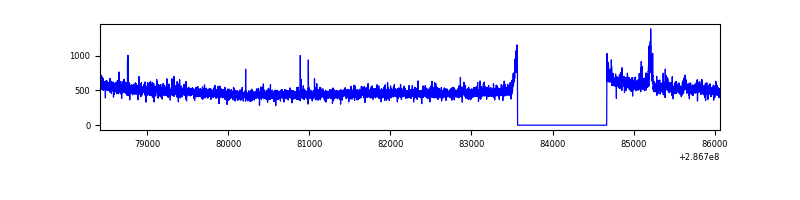 |
| B | 7644 | 6545 | 1 | 1 | 0.01% | 0.02% | 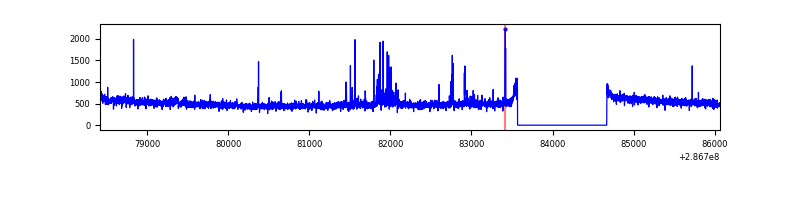 |
| C | 7644 | 6545 | 0 | 0 | 0.00% | 0.00% | 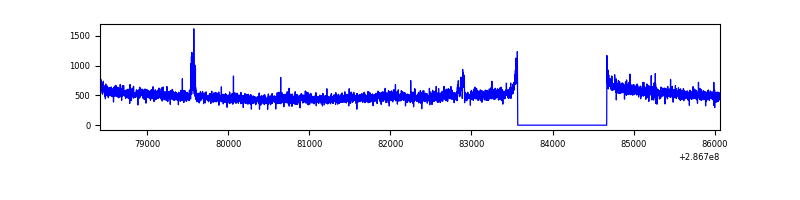 |
| D | 7644 | 6545 | 1279 | 1279 | 16.73% | 19.54% | 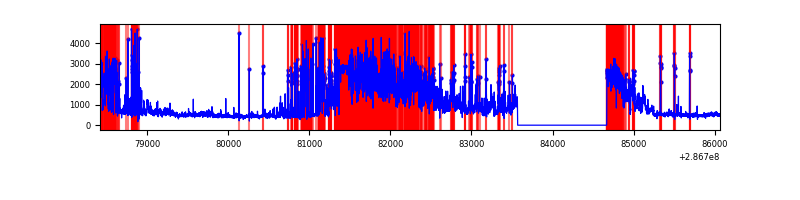 |
Top three noisy pixels from each quadrant. If the there are fewer than three noisy pixels in the level2.evt file, extra rows are filled as -1
| Pixel properties | Quadrant properties | ||||||
|---|---|---|---|---|---|---|---|
| Quadrant | DetID | PixID | Counts | Sigma | Mean | Median | Sigma |
| A | 15 | 174 | 36675 | 214.13 | 831 | 815 | 167.5 |
| A | 0 | 226 | 7230 | 38.31 | 831 | 815 | 167.5 |
| A | 3 | 137 | 6152 | 31.87 | 831 | 815 | 167.5 |
| B | 7 | 220 | 49182 | 306.03 | 829 | 809 | 158.1 |
| B | 0 | 189 | 19530 | 118.44 | 829 | 809 | 158.1 |
| B | 12 | 111 | 18900 | 114.45 | 829 | 809 | 158.1 |
| C | 14 | 238 | 124070 | 673.46 | 788 | 794 | 183.0 |
| C | 3 | 233 | 56674 | 305.27 | 788 | 794 | 183.0 |
| C | 9 | 160 | 14208 | 73.28 | 788 | 794 | 183.0 |
| D | 7 | 238 | 3778075 | 21487.24 | 722 | 701 | 175.8 |
| D | 11 | 176 | 507564 | 2883.24 | 722 | 701 | 175.8 |
| D | 13 | 104 | 204860 | 1161.34 | 722 | 701 | 175.8 |
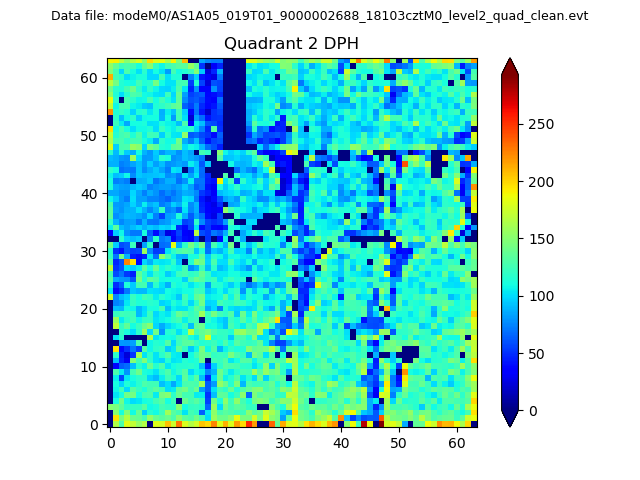
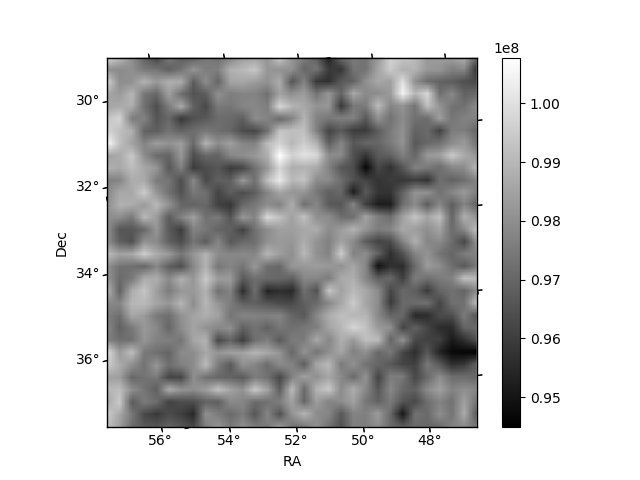
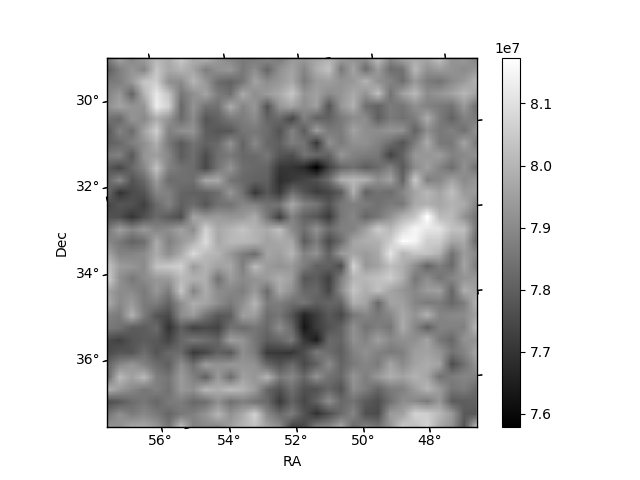
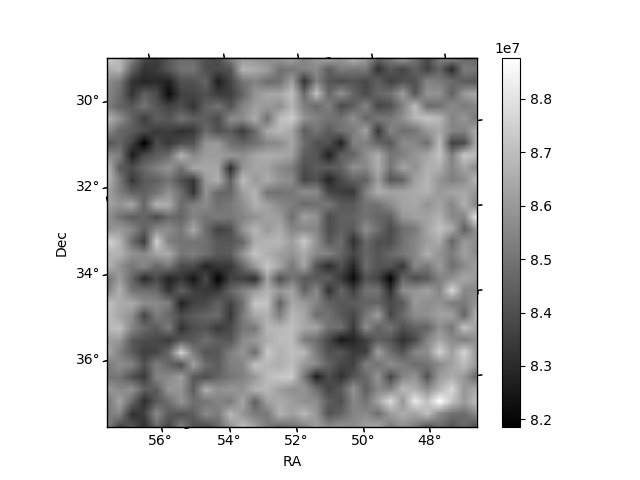
Histogram calculated using DETX and DETY for each event in the final _common_clean file
| Quadrant A | 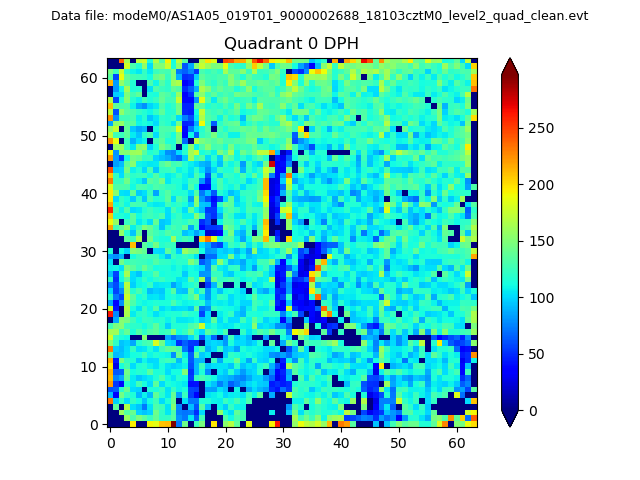 |
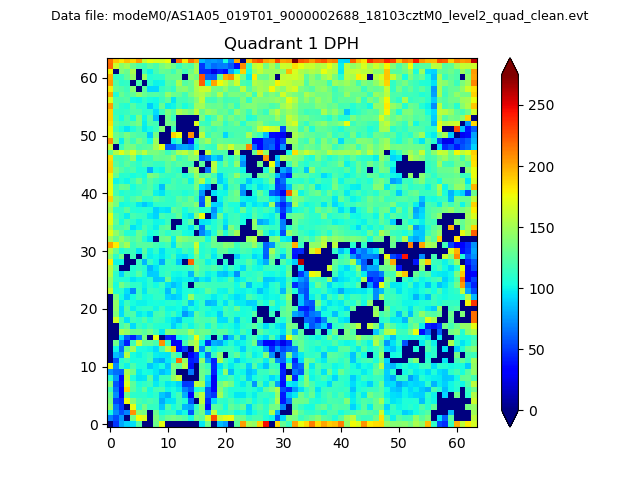 |
Quadrant B |
|---|---|---|---|
| Quadrant D | 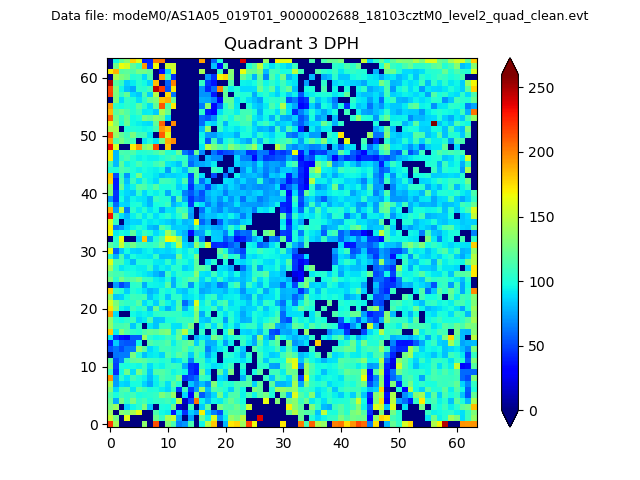 |
 |
Quadrant C |
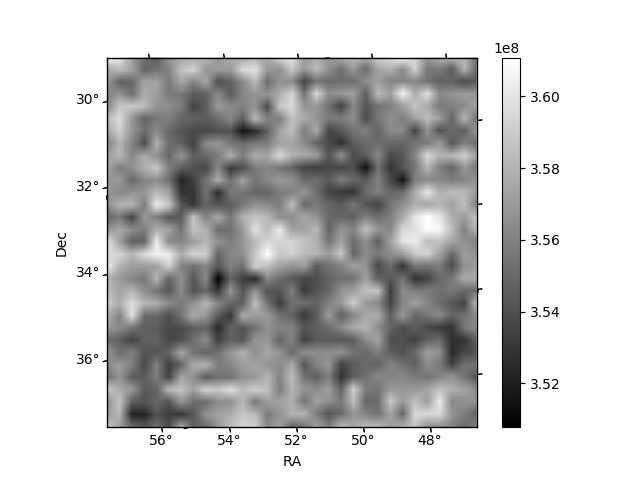
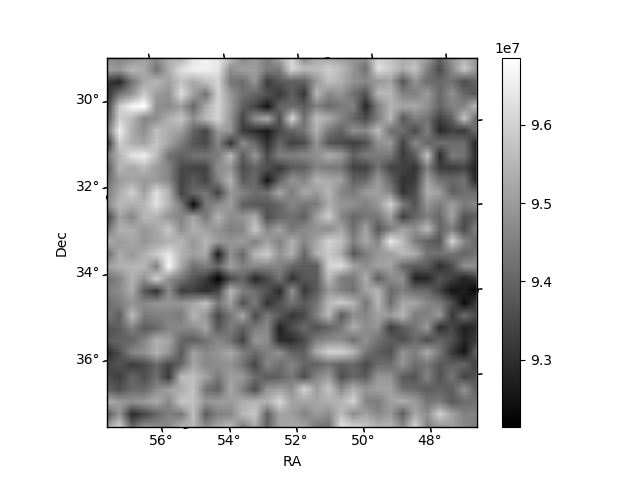
| Plot type | Count rate plots | Images |
|---|---|---|
| Comparison with Poisson distribution Blue bars denote a histogram of data divided into 1 sec bins. Red curve is a Poisson curve with rate = median count rate of data. |
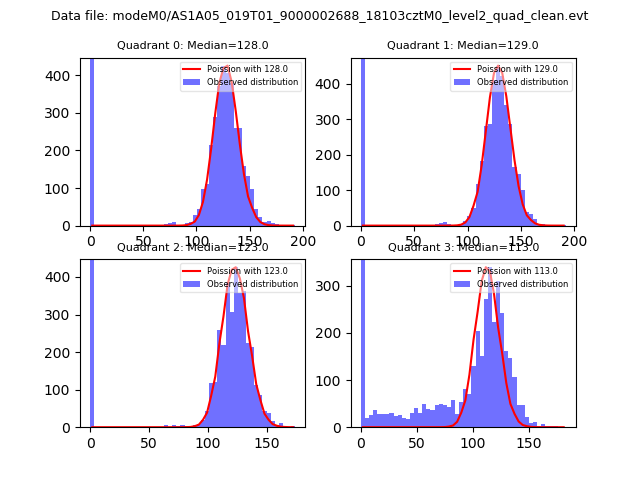 |
 |
| Quadrant-wise count rates Data is divided into 100 sec bins |
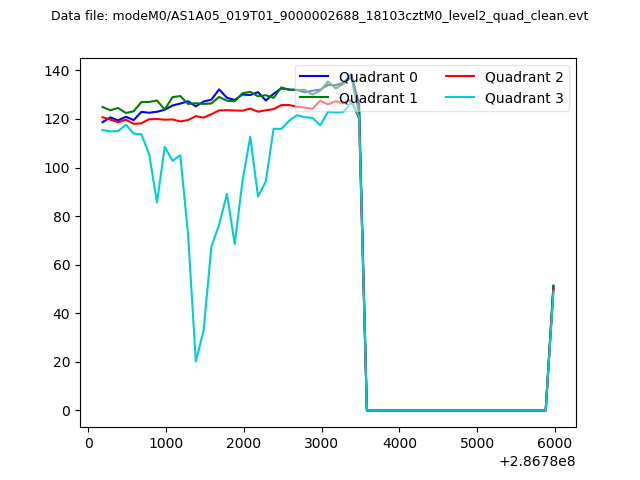 |
|
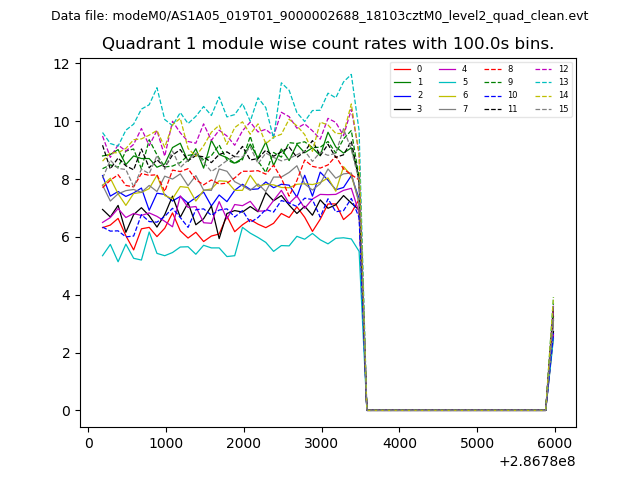
| Module-wise count rates for Quadrant A Data is divided into 100 sec bins |
 |
 |
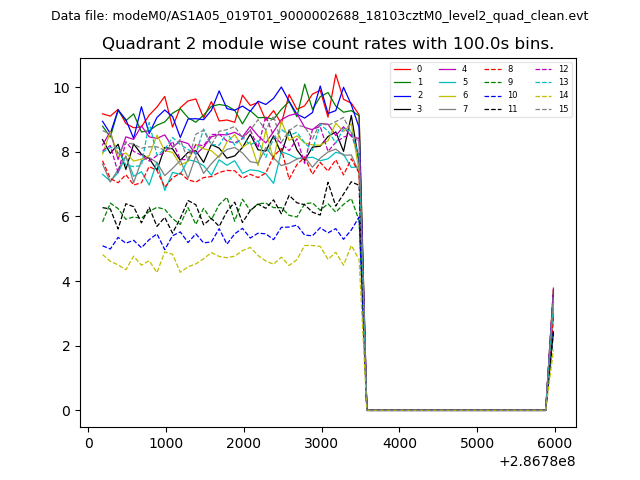
| Module-wise count rates for Quadrant B Data is divided into 100 sec bins |
 |
 |
| Module-wise count rates for Quadrant C Data is divided into 100 sec bins |
 |
 |
| Module-wise count rates for Quadrant D Data is divided into 100 sec bins |
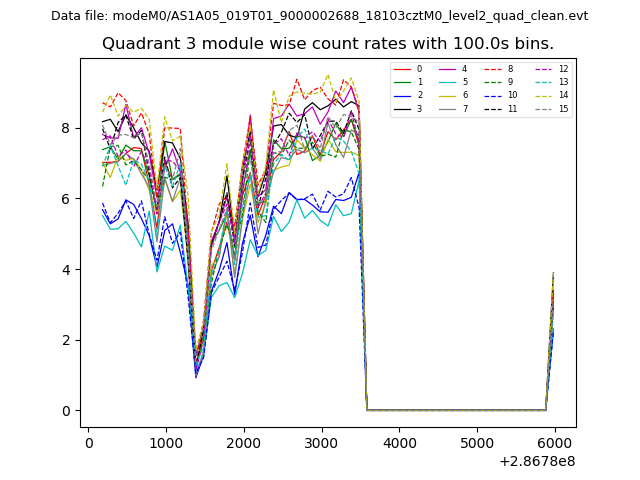 |
 |
| Parameter | Plot |
|---|---|
| CZT HV Monitor | 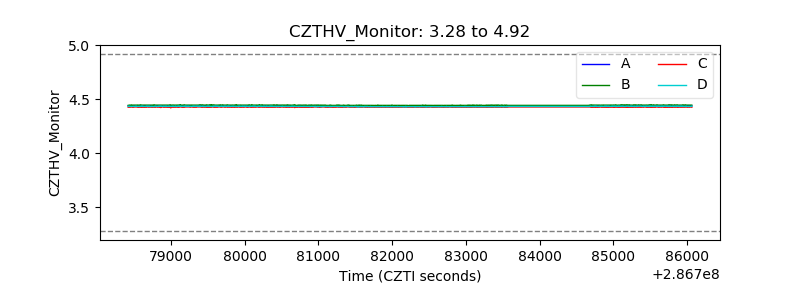 |
| D_VDD | 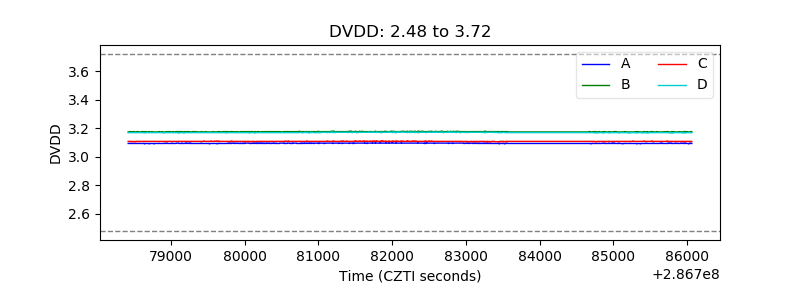 |
| Temperature 1 | 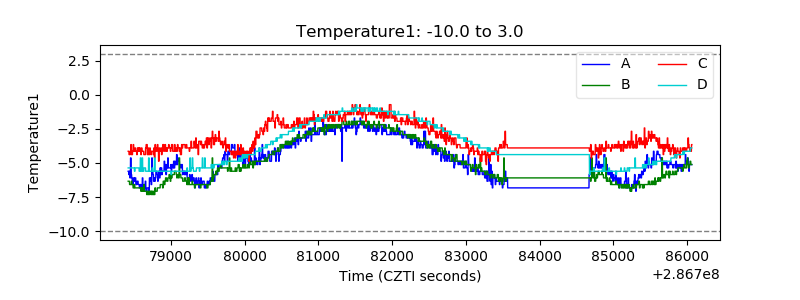 |
| Veto HV Monitor | 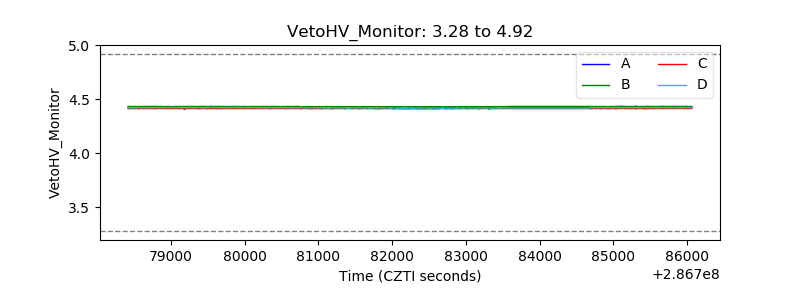 |
| Veto LLD | 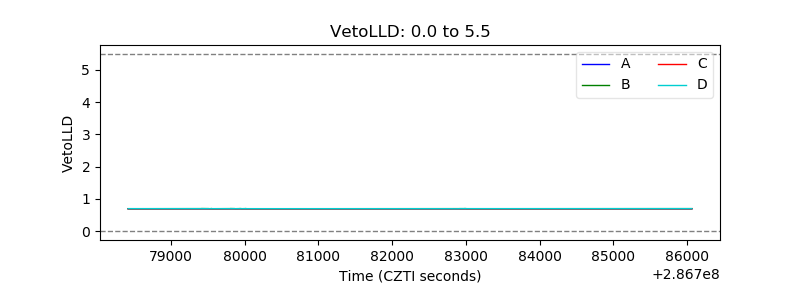 |
| Alpha Counter | 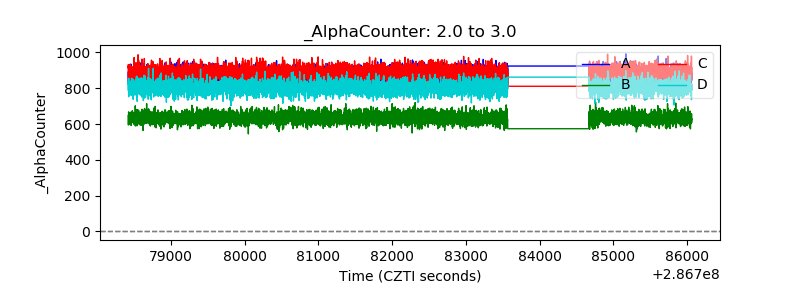 |
| _CPM_Rate | 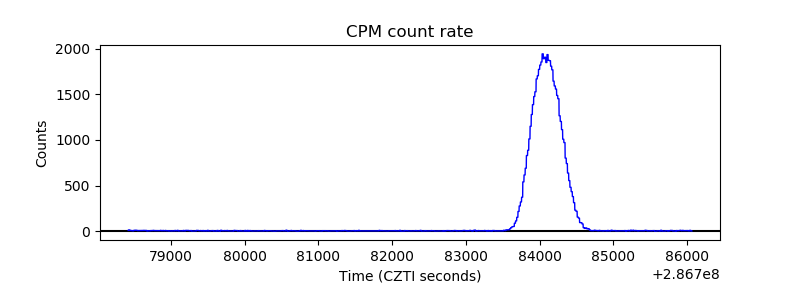 |
| CZT Counter |  |
| +2.5 Volts monitor |  |
| +5 Volts monitor |  |
| _ROLL_ROT | 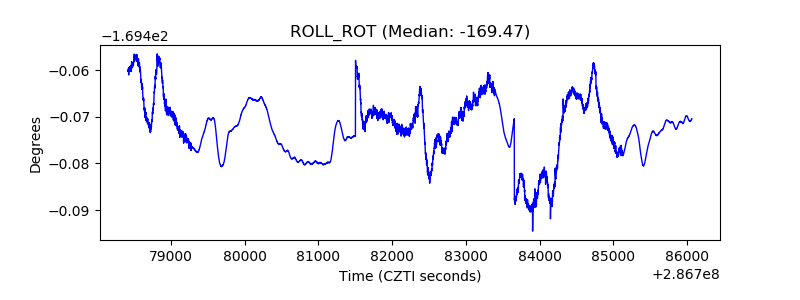 |
| _Roll_DEC | 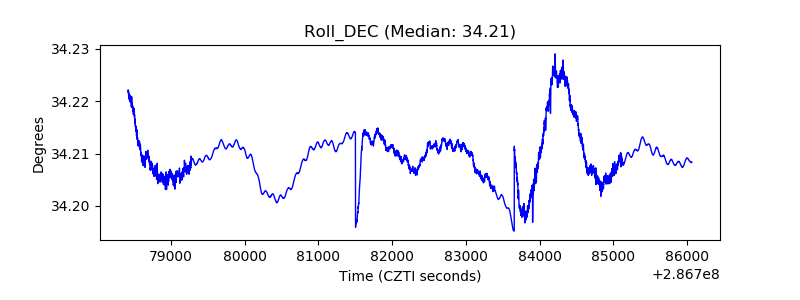 |
| _Roll_RA | 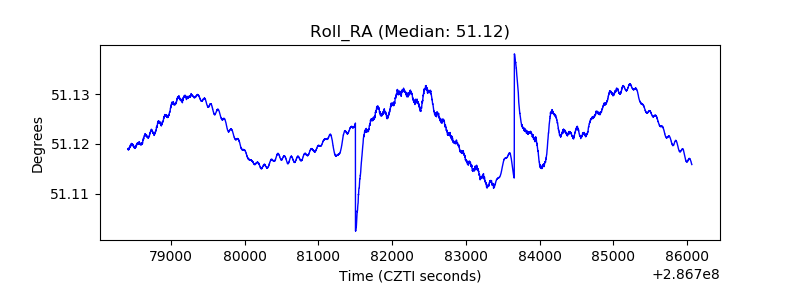 |
| Veto Counter | 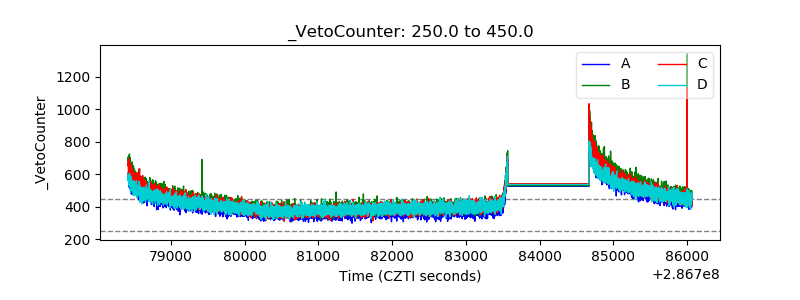 |