| Param | Original file | Final file |
|---|---|---|
| Filename | modeM0/AS1A05_019T01_9000002688_18107cztM0_level2.evt | modeM0/AS1A05_019T01_9000002688_18107cztM0_level2_quad_clean.evt |
| Size (bytes) | 581,901,120 | 106,706,880 |
| Size | 554.9 MB | 101.8 MB |
| Events in quadrant A | 3,439,612 | 742,901 |
| Events in quadrant B | 3,707,066 | 739,205 |
| Events in quadrant C | 3,275,736 | 688,062 |
| Events in quadrant D | 6,780,058 | 627,926 |
| Mode M0 | |||
|---|---|---|---|
| Quadrant | BADHDUFLAG | Total packets | Discarded packets |
| A | 0 | 14127 | 2 |
| B | 0 | 14859 | 2 |
| C | 0 | 13483 | 2 |
| D | 0 | 24448 | 2 |
| Mode M9 | |||
|---|---|---|---|
| Quadrant | BADHDUFLAG | Total packets | Discarded packets |
| A | 0 | 19 | 0 |
| B | 0 | 20 | 0 |
| C | 0 | 20 | 0 |
| D | 0 | 20 | 0 |
| Mode SS | |||
|---|---|---|---|
| Quadrant | BADHDUFLAG | Total packets | Discarded packets |
| A | 0 | 128 | 0 |
| B | 0 | 128 | 0 |
| C | 0 | 128 | 0 |
| D | 0 | 128 | 0 |
| Quadrant | Total seconds | Saturated seconds | Saturation percentage |
|---|---|---|---|
| A | 6200 | 115 | 1.854839% |
| B | 6200 | 201 | 3.241935% |
| C | 6200 | 127 | 2.048387% |
| D | 6200 | 1063 | 17.145161% |
Noise dominated data is calculated using 1-second bins in cleaned event files. If a bin has >2000 counts, and if more than 50% of those come from <1% of pixels, then it is considered to be noise-dominated and hence unusable.
| Quadrant | # 1 sec bins | Bins with >0 counts | Bins with >2000 counts | High rate bins dominated by noise | Noise dominated (total time) | Noise dominated (detector-on time) | Marked lightcurve |
|---|---|---|---|---|---|---|---|
| A | 7530 | 6200 | 7 | 7 | 0.09% | 0.11% | 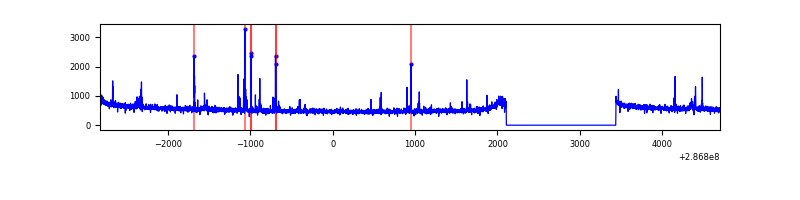 |
| B | 7530 | 6200 | 66 | 66 | 0.88% | 1.06% | 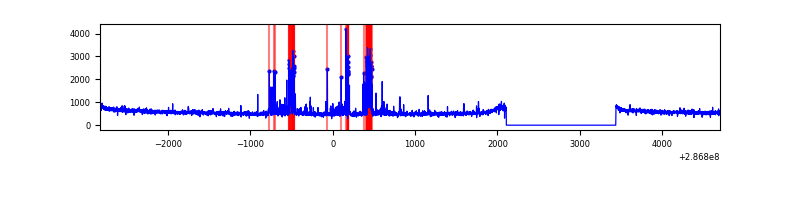 |
| C | 7530 | 6201 | 5 | 5 | 0.07% | 0.08% | 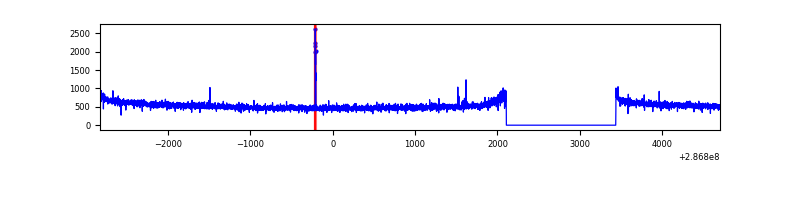 |
| D | 7530 | 6201 | 880 | 880 | 11.69% | 14.19% | 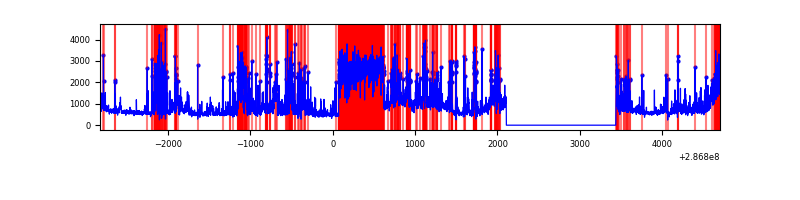 |
Top three noisy pixels from each quadrant. If the there are fewer than three noisy pixels in the level2.evt file, extra rows are filled as -1
| Pixel properties | Quadrant properties | ||||||
|---|---|---|---|---|---|---|---|
| Quadrant | DetID | PixID | Counts | Sigma | Mean | Median | Sigma |
| A | 4 | 2 | 83441 | 481.04 | 865 | 850 | 171.7 |
| A | 15 | 174 | 31482 | 178.41 | 865 | 850 | 171.7 |
| A | 0 | 226 | 7715 | 39.98 | 865 | 850 | 171.7 |
| B | 7 | 220 | 318575 | 1981.51 | 848 | 829 | 160.4 |
| B | 0 | 189 | 27262 | 164.84 | 848 | 829 | 160.4 |
| B | 3 | 209 | 18144 | 107.98 | 848 | 829 | 160.4 |
| C | 14 | 238 | 127436 | 687.42 | 800 | 808 | 184.2 |
| C | 0 | 207 | 18119 | 93.98 | 800 | 808 | 184.2 |
| C | 9 | 160 | 6302 | 29.82 | 800 | 808 | 184.2 |
| D | 7 | 238 | 1882356 | 10035.38 | 783 | 761 | 187.5 |
| D | 11 | 176 | 981194 | 5229.08 | 783 | 761 | 187.5 |
| D | 10 | 70 | 438278 | 2333.47 | 783 | 761 | 187.5 |
Histogram calculated using DETX and DETY for each event in the final _common_clean file
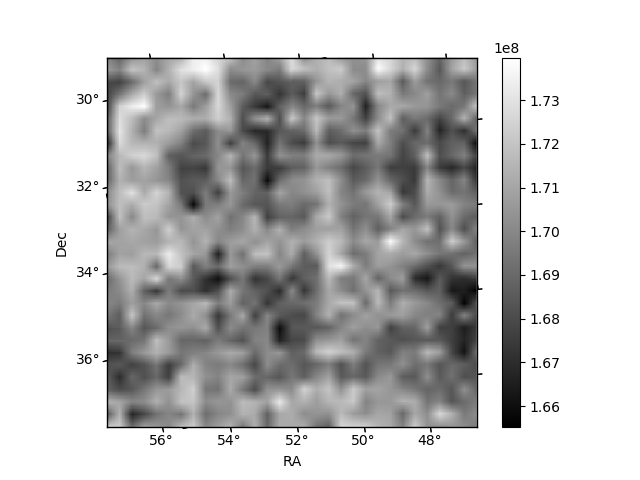
| Quadrant A | 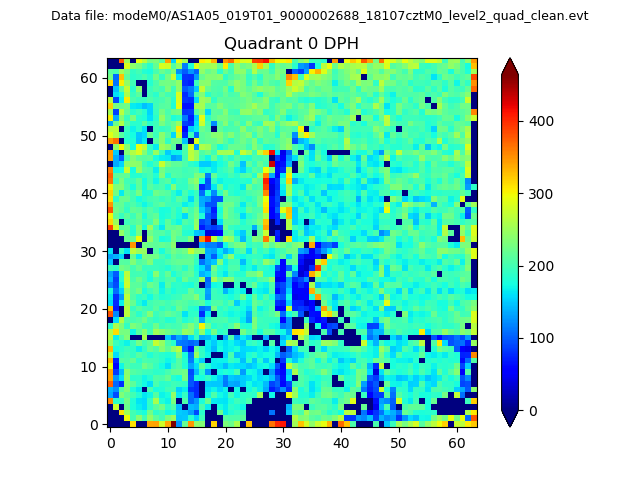 |
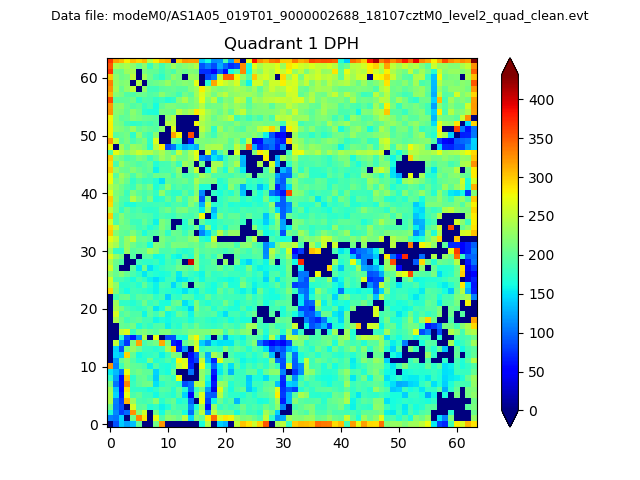 |
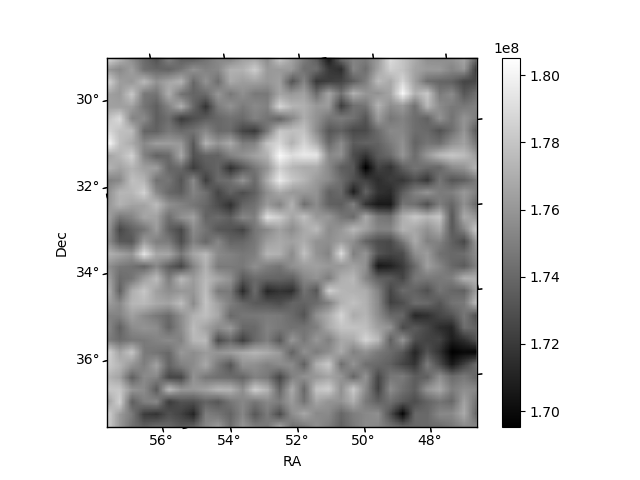
Quadrant B |
|---|---|---|---|
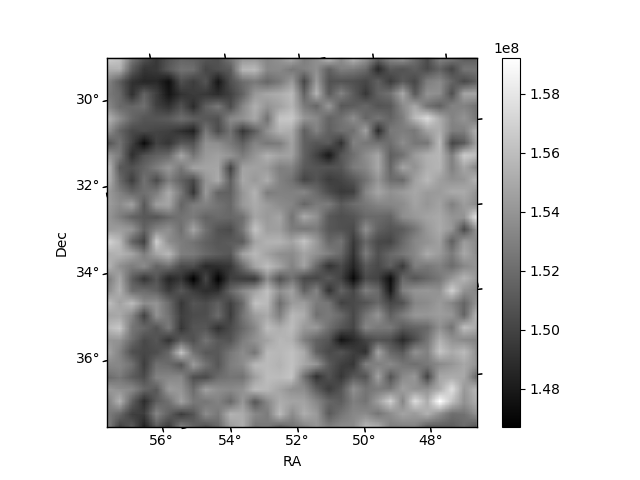
| Quadrant D | 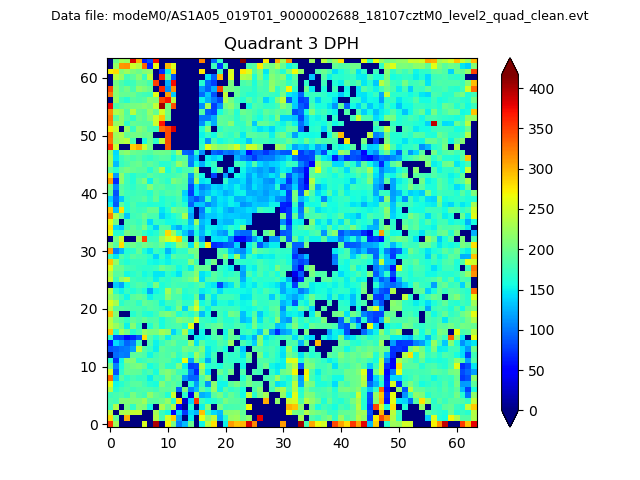 |
 |
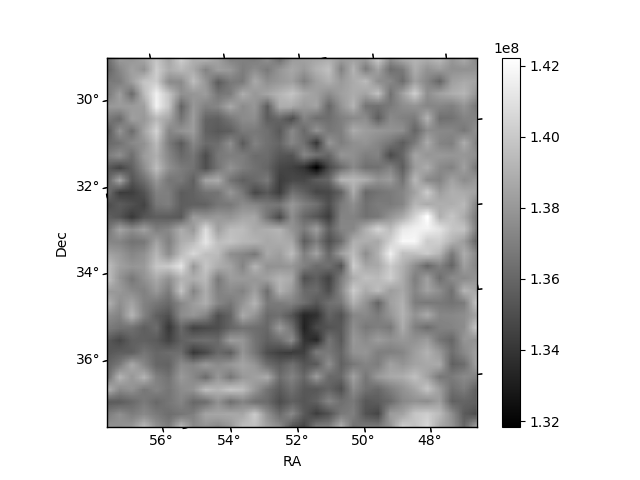
Quadrant C |
| Plot type | Count rate plots | Images |
|---|---|---|
| Comparison with Poisson distribution Blue bars denote a histogram of data divided into 1 sec bins. Red curve is a Poisson curve with rate = median count rate of data. |
 |
 |
| Quadrant-wise count rates Data is divided into 100 sec bins |
 |
|
| Module-wise count rates for Quadrant A Data is divided into 100 sec bins |
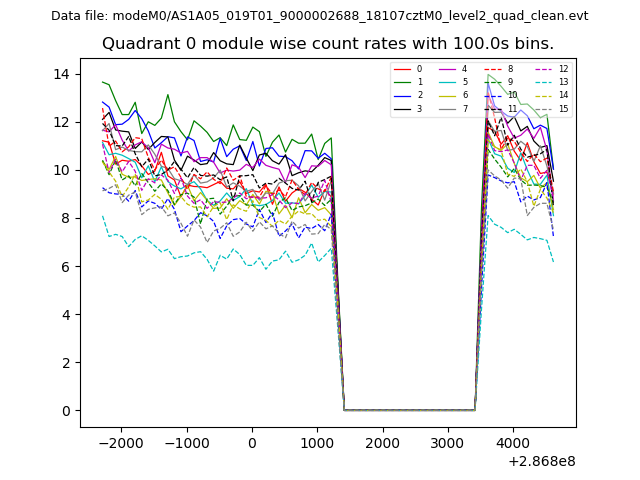 |
 |
| Module-wise count rates for Quadrant B Data is divided into 100 sec bins |
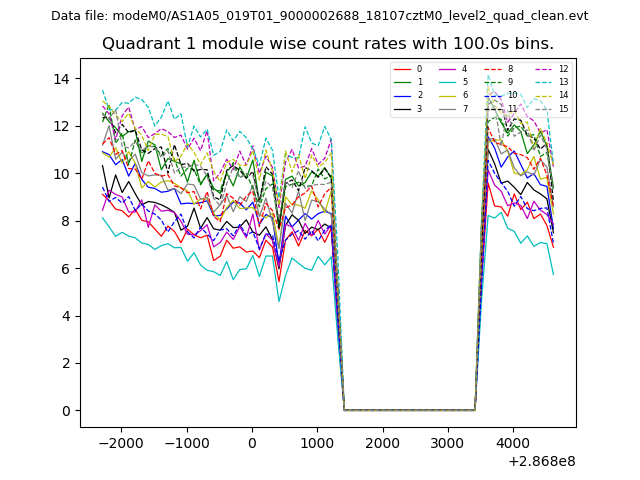 |
 |
| Module-wise count rates for Quadrant C Data is divided into 100 sec bins |
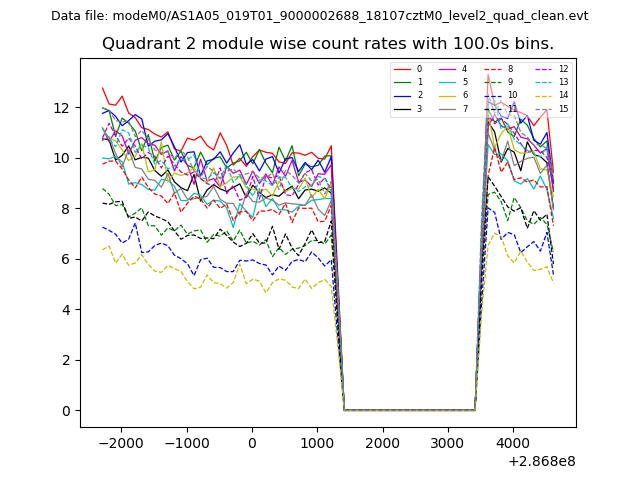 |
 |
| Module-wise count rates for Quadrant D Data is divided into 100 sec bins |
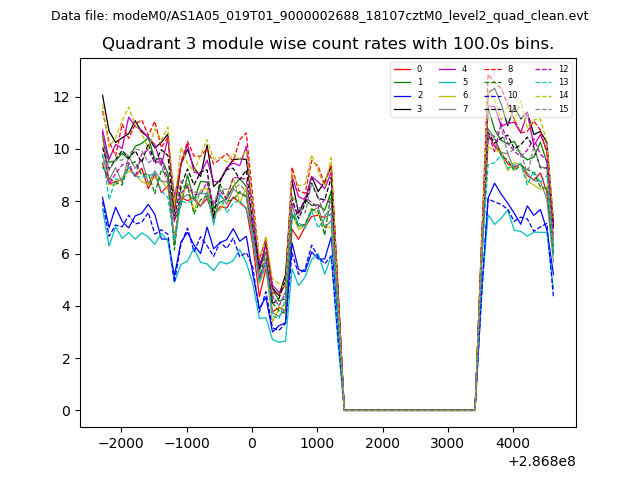 |
 |
| Parameter | Plot |
|---|---|
| CZT HV Monitor | 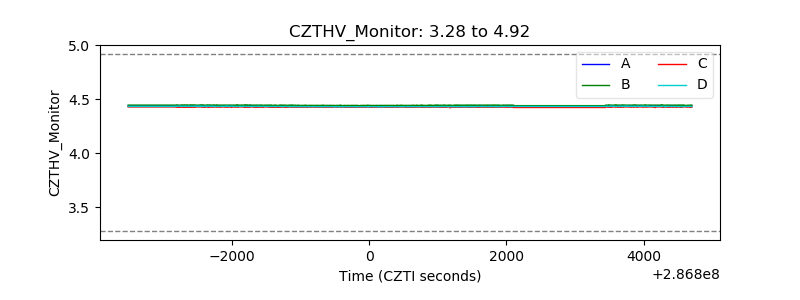 |
| D_VDD | 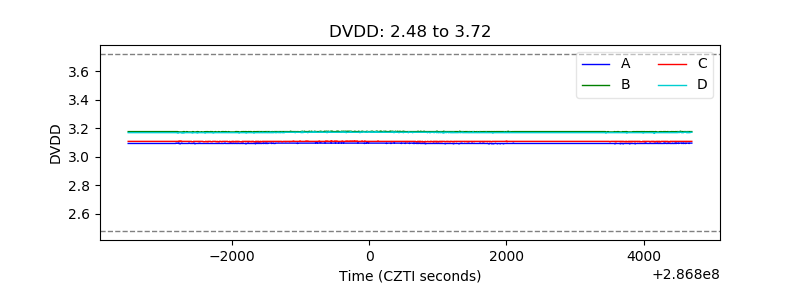 |
| Temperature 1 | 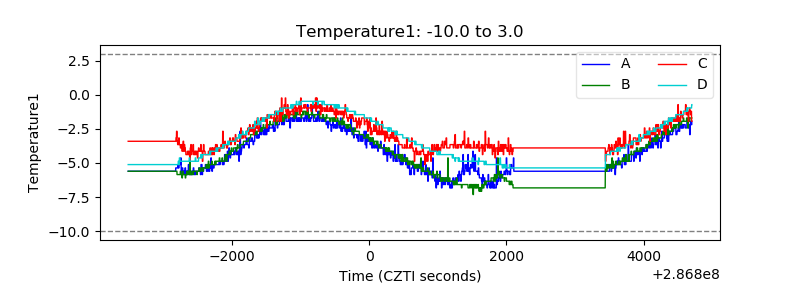 |
| Veto HV Monitor | 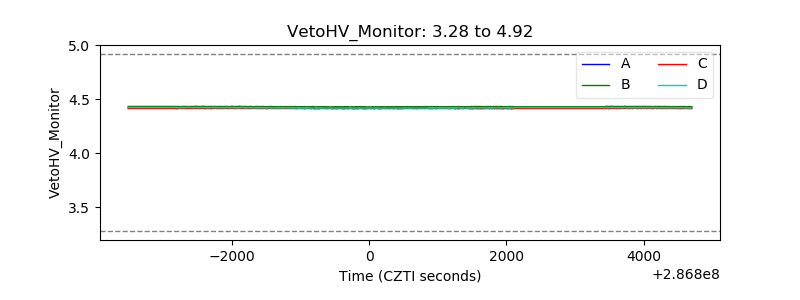 |
| Veto LLD | 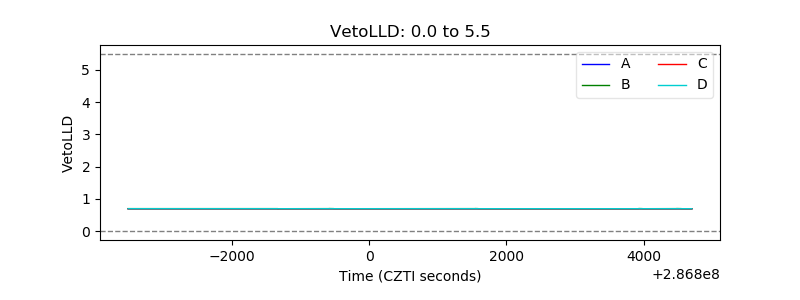 |
| Alpha Counter | 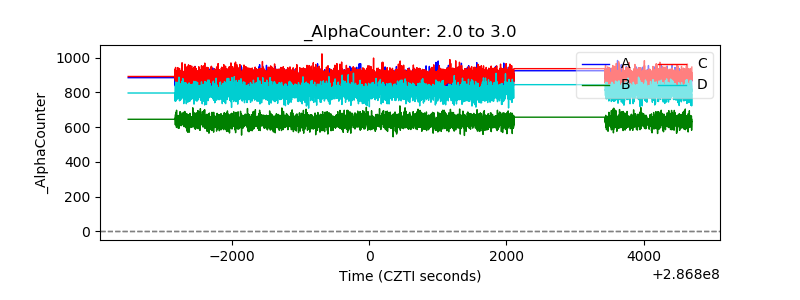 |
| _CPM_Rate | 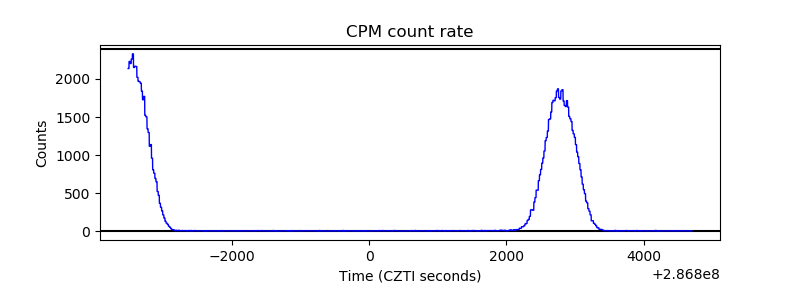 |
| CZT Counter | 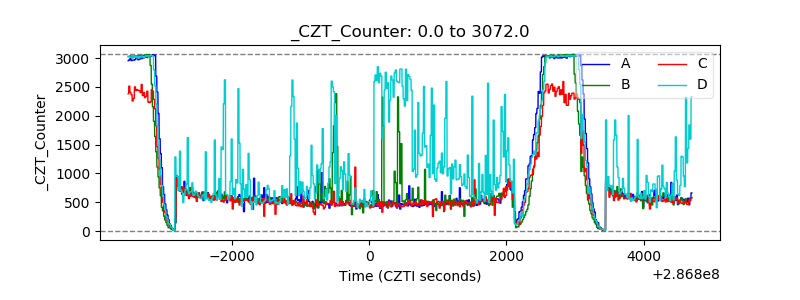 |
| +2.5 Volts monitor |  |
| +5 Volts monitor |  |
| _ROLL_ROT | 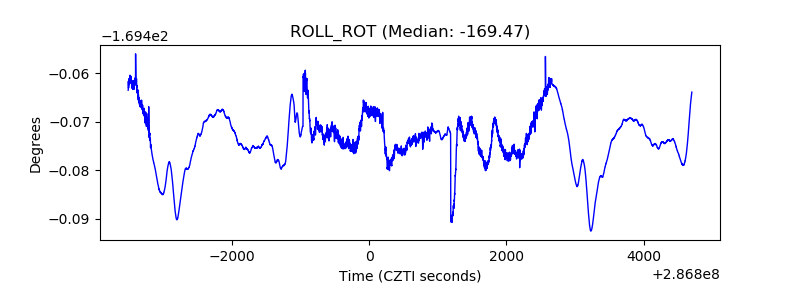 |
| _Roll_DEC | 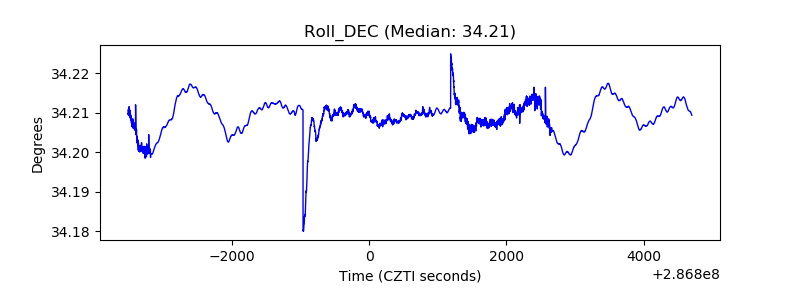 |
| _Roll_RA | 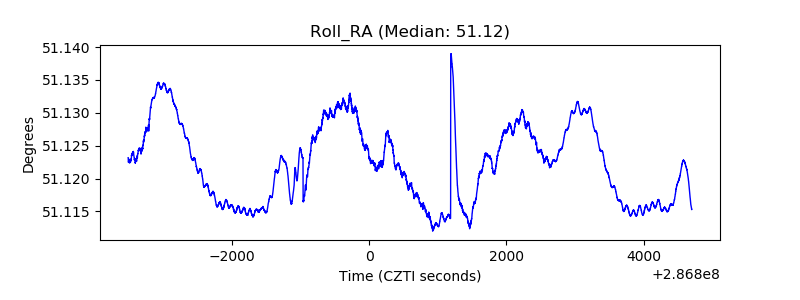 |
| Veto Counter |  |