| Param | Original file | Final file |
|---|---|---|
| Filename | modeM0/AS1A05_019T01_9000002688_18108cztM0_level2.evt | modeM0/AS1A05_019T01_9000002688_18108cztM0_level2_quad_clean.evt |
| Size (bytes) | 573,215,040 | 110,249,280 |
| Size | 546.7 MB | 105.1 MB |
| Events in quadrant A | 3,322,261 | 767,096 |
| Events in quadrant B | 3,487,150 | 767,437 |
| Events in quadrant C | 3,214,005 | 708,021 |
| Events in quadrant D | 6,910,419 | 657,436 |
| Mode M0 | |||
|---|---|---|---|
| Quadrant | BADHDUFLAG | Total packets | Discarded packets |
| A | 0 | 13750 | 2 |
| B | 0 | 14213 | 2 |
| C | 0 | 13325 | 3 |
| D | 0 | 24930 | 2 |
| Mode M9 | |||
|---|---|---|---|
| Quadrant | BADHDUFLAG | Total packets | Discarded packets |
| A | 0 | 21 | 0 |
| B | 0 | 22 | 0 |
| C | 0 | 22 | 0 |
| D | 0 | 22 | 0 |
| Mode SS | |||
|---|---|---|---|
| Quadrant | BADHDUFLAG | Total packets | Discarded packets |
| A | 0 | 128 | 0 |
| B | 0 | 128 | 0 |
| C | 0 | 128 | 0 |
| D | 0 | 128 | 0 |
| Quadrant | Total seconds | Saturated seconds | Saturation percentage |
|---|---|---|---|
| A | 6286 | 122 | 1.940821% |
| B | 6286 | 139 | 2.211263% |
| C | 6285 | 134 | 2.132060% |
| D | 6285 | 996 | 15.847255% |
Noise dominated data is calculated using 1-second bins in cleaned event files. If a bin has >2000 counts, and if more than 50% of those come from <1% of pixels, then it is considered to be noise-dominated and hence unusable.
| Quadrant | # 1 sec bins | Bins with >0 counts | Bins with >2000 counts | High rate bins dominated by noise | Noise dominated (total time) | Noise dominated (detector-on time) | Marked lightcurve |
|---|---|---|---|---|---|---|---|
| A | 7561 | 6287 | 1 | 1 | 0.01% | 0.02% | 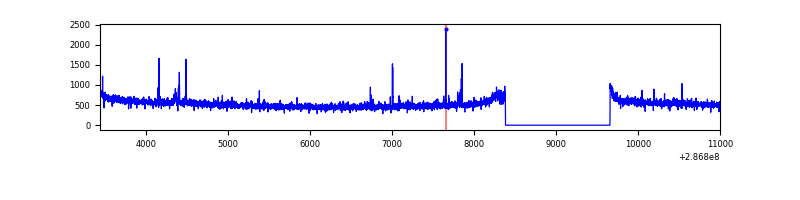 |
| B | 7561 | 6287 | 21 | 21 | 0.28% | 0.33% | 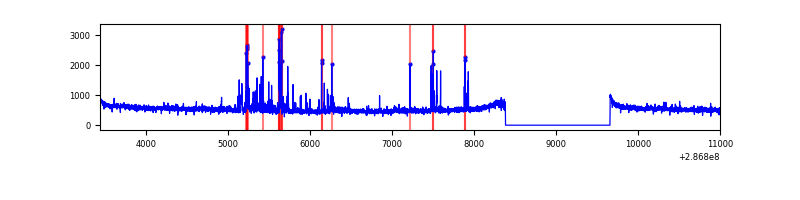 |
| C | 7560 | 6285 | 0 | 0 | 0.00% | 0.00% | 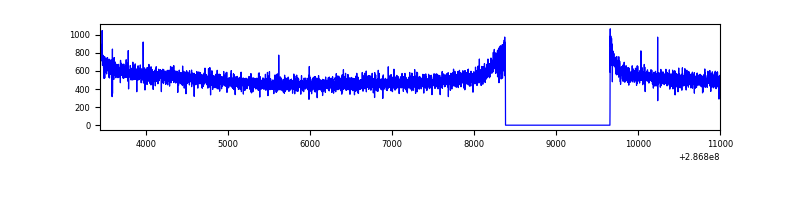 |
| D | 7560 | 6286 | 788 | 788 | 10.42% | 12.54% | 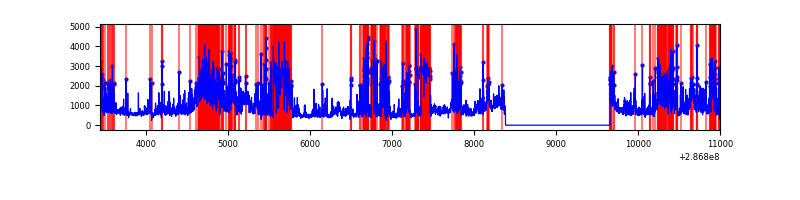 |
Top three noisy pixels from each quadrant. If the there are fewer than three noisy pixels in the level2.evt file, extra rows are filled as -1
| Pixel properties | Quadrant properties | ||||||
|---|---|---|---|---|---|---|---|
| Quadrant | DetID | PixID | Counts | Sigma | Mean | Median | Sigma |
| A | 15 | 174 | 36193 | 210.55 | 851 | 835 | 167.9 |
| A | 4 | 2 | 16607 | 93.92 | 851 | 835 | 167.9 |
| A | 0 | 226 | 7677 | 40.74 | 851 | 835 | 167.9 |
| B | 7 | 220 | 143550 | 909.75 | 836 | 816 | 156.9 |
| B | 3 | 64 | 28693 | 177.68 | 836 | 816 | 156.9 |
| B | 0 | 189 | 22381 | 137.45 | 836 | 816 | 156.9 |
| C | 14 | 238 | 127387 | 697.82 | 788 | 796 | 181.4 |
| C | 3 | 233 | 7047 | 34.46 | 788 | 796 | 181.4 |
| C | 13 | 61 | 5432 | 25.56 | 788 | 796 | 181.4 |
| D | 7 | 238 | 1436954 | 7786.01 | 770 | 749 | 184.5 |
| D | 11 | 176 | 1373158 | 7440.16 | 770 | 749 | 184.5 |
| D | 10 | 70 | 636003 | 3443.86 | 770 | 749 | 184.5 |
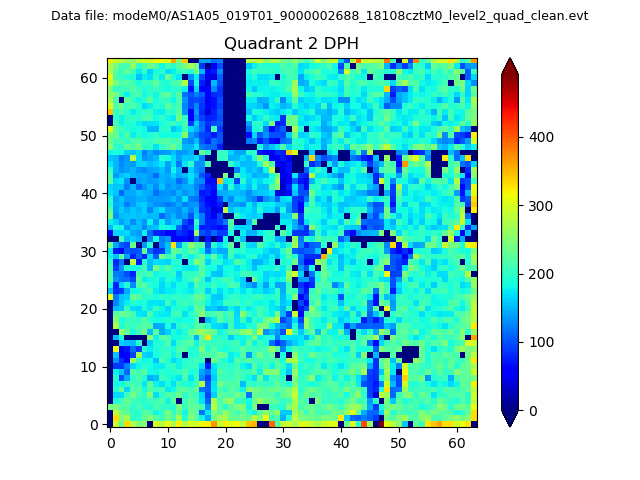
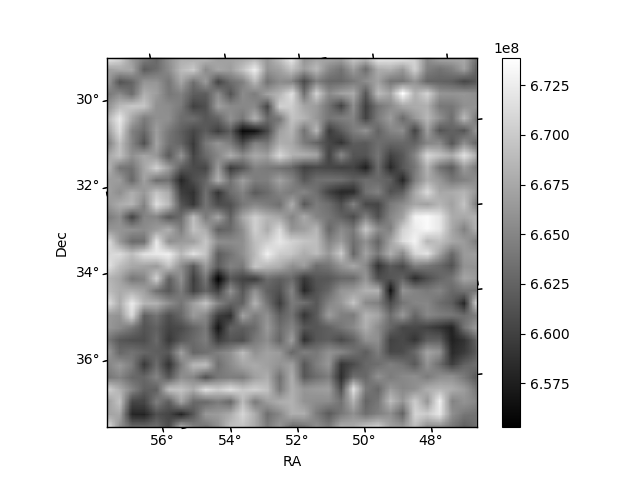
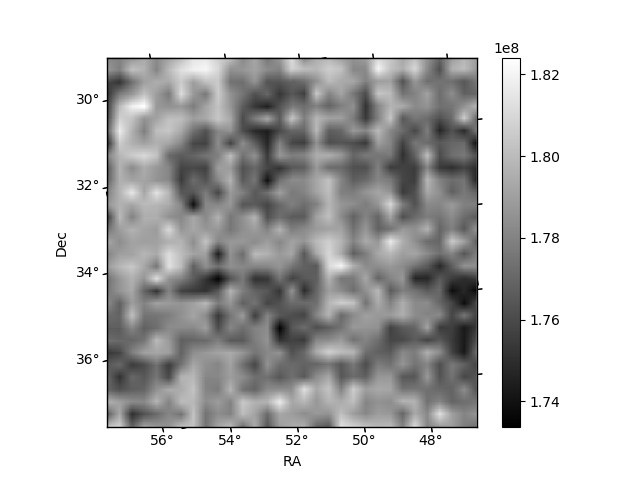
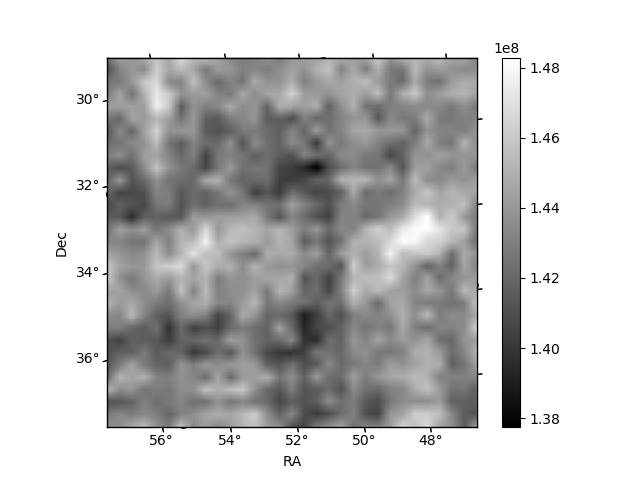
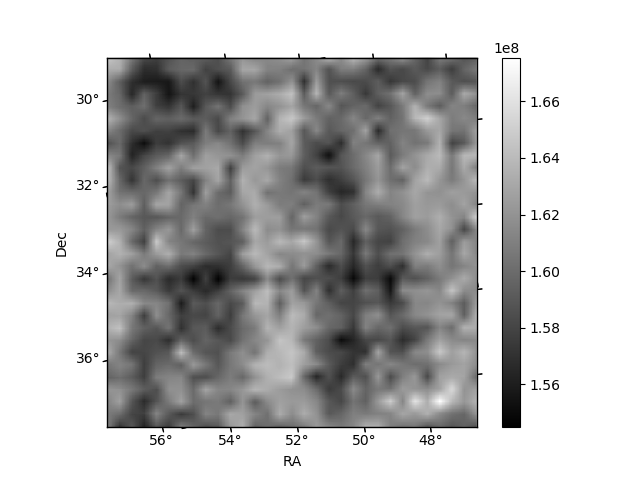
Histogram calculated using DETX and DETY for each event in the final _common_clean file
| Quadrant A | 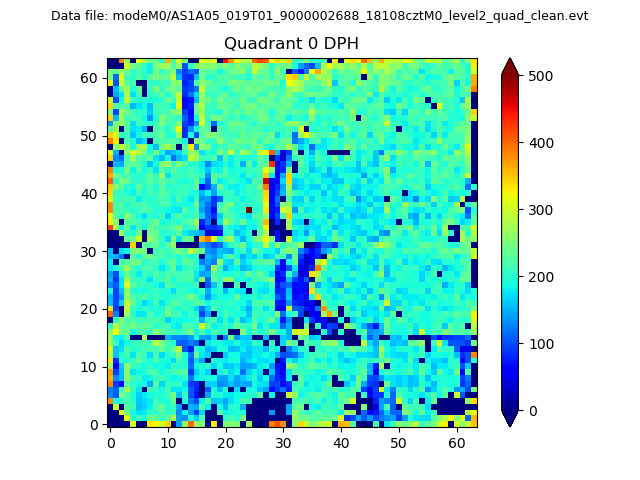 |
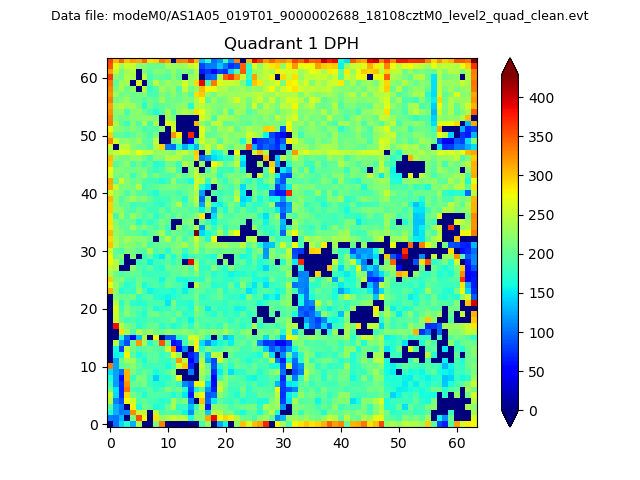 |
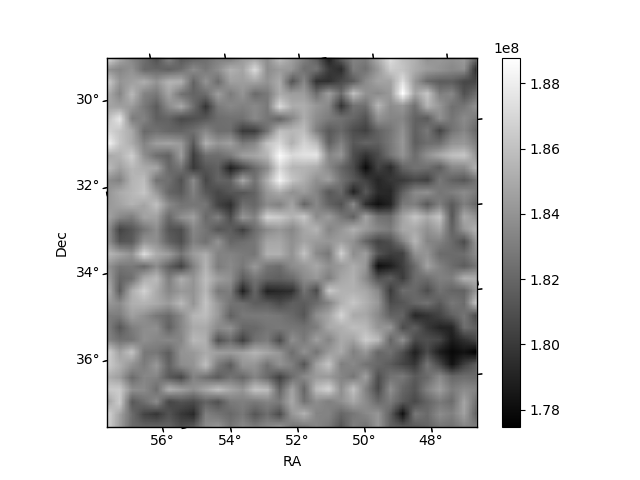
Quadrant B |
|---|---|---|---|
| Quadrant D | 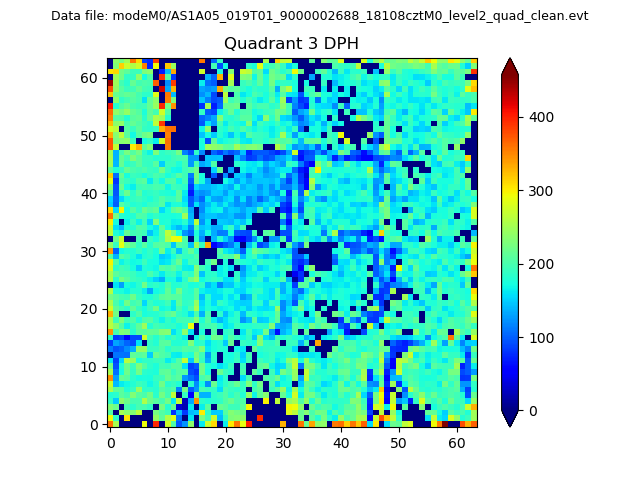 |
 |
Quadrant C |
| Plot type | Count rate plots | Images |
|---|---|---|
| Comparison with Poisson distribution Blue bars denote a histogram of data divided into 1 sec bins. Red curve is a Poisson curve with rate = median count rate of data. |
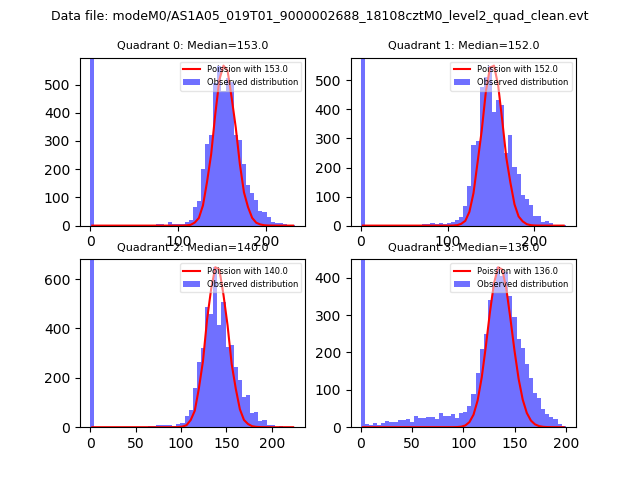 |
 |
| Quadrant-wise count rates Data is divided into 100 sec bins |
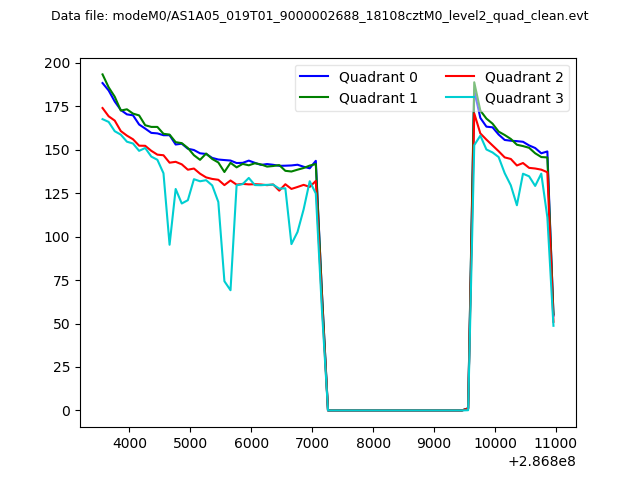 |
|
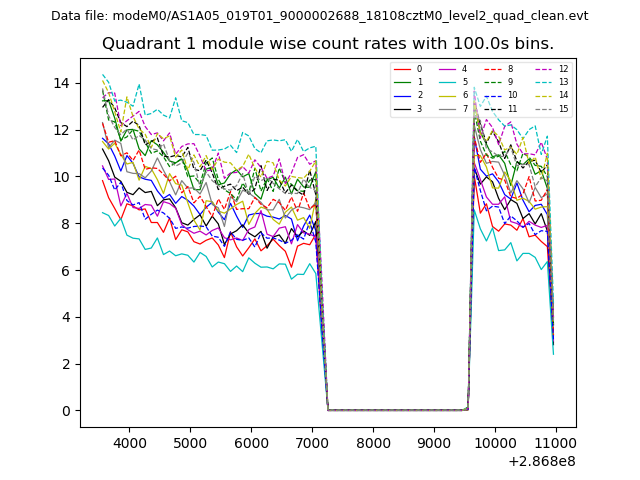
| Module-wise count rates for Quadrant A Data is divided into 100 sec bins |
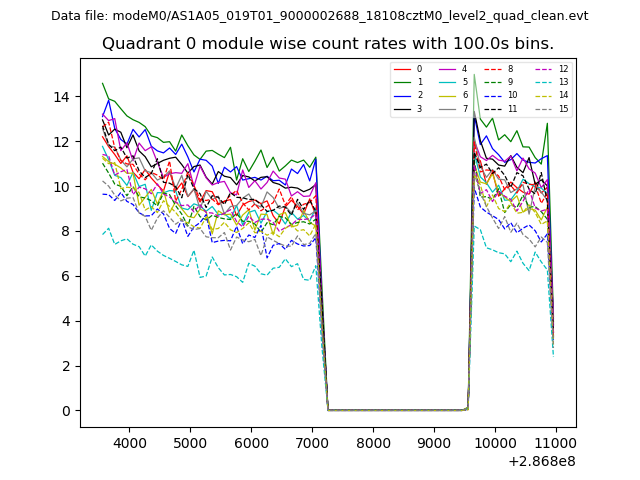 |
 |
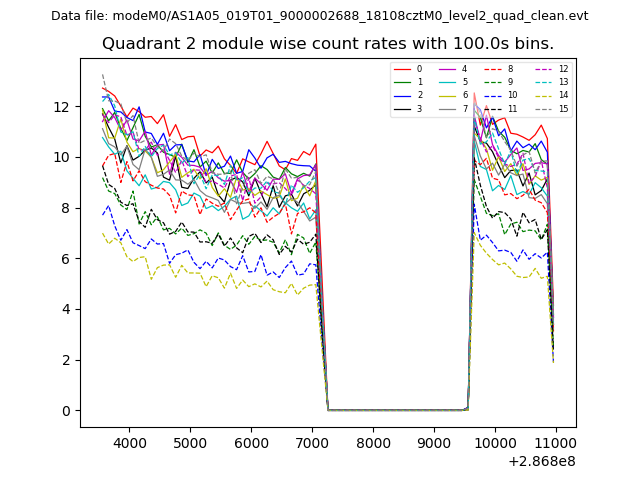
| Module-wise count rates for Quadrant B Data is divided into 100 sec bins |
 |
 |
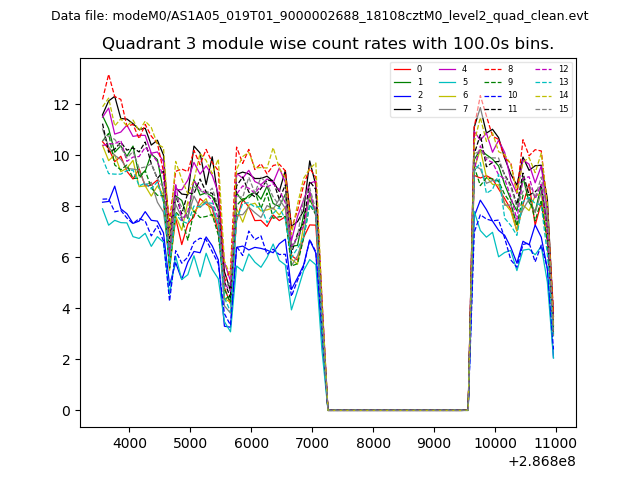
| Module-wise count rates for Quadrant C Data is divided into 100 sec bins |
 |
 |
| Module-wise count rates for Quadrant D Data is divided into 100 sec bins |
 |
 |
| Parameter | Plot |
|---|---|
| CZT HV Monitor | 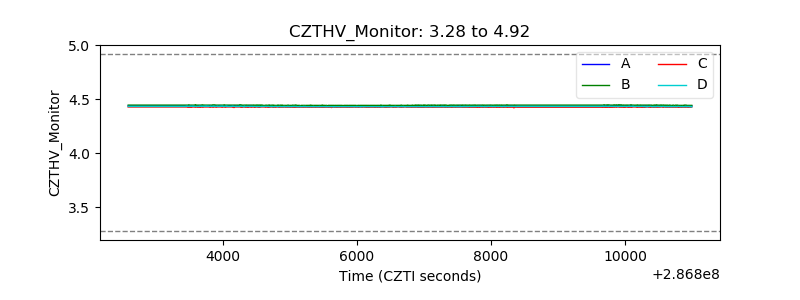 |
| D_VDD | 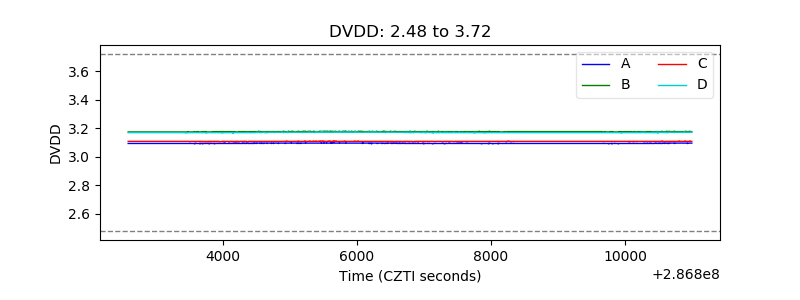 |
| Temperature 1 | 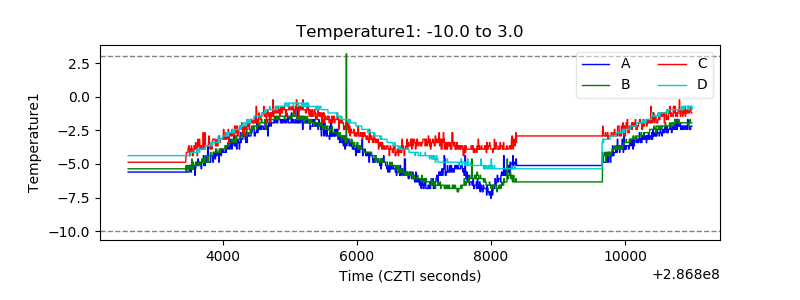 |
| Veto HV Monitor | 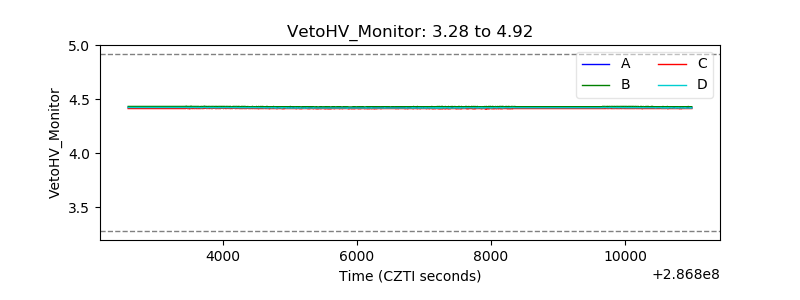 |
| Veto LLD | 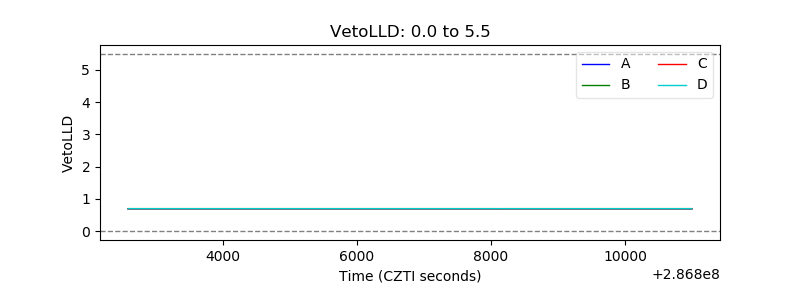 |
| Alpha Counter | 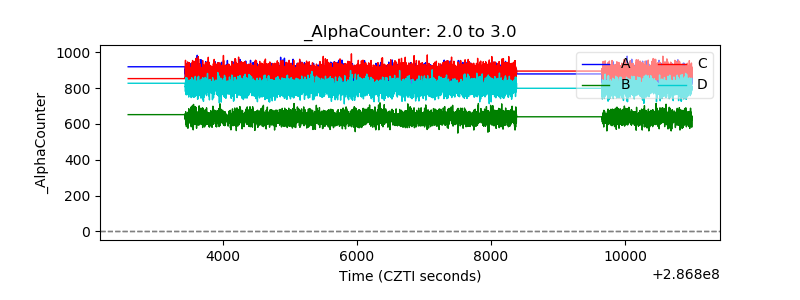 |
| _CPM_Rate | 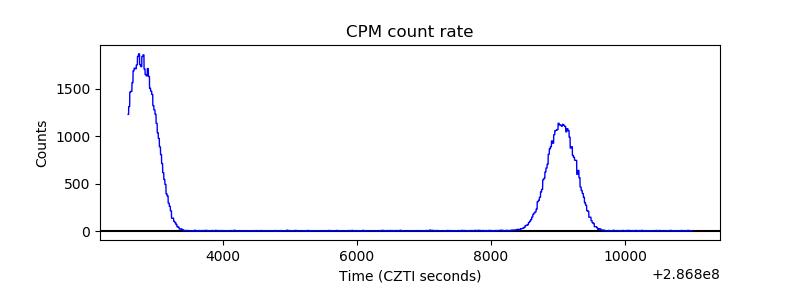 |
| CZT Counter | 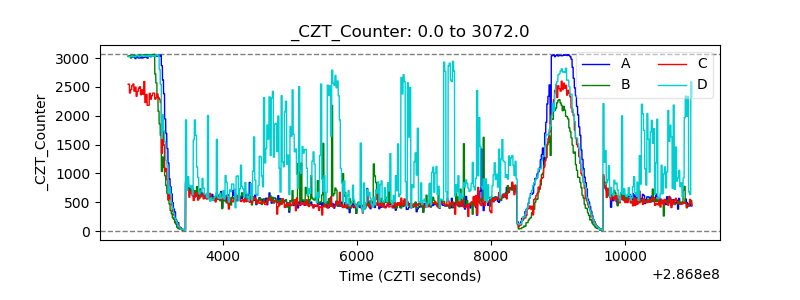 |
| +2.5 Volts monitor |  |
| +5 Volts monitor |  |
| _ROLL_ROT | 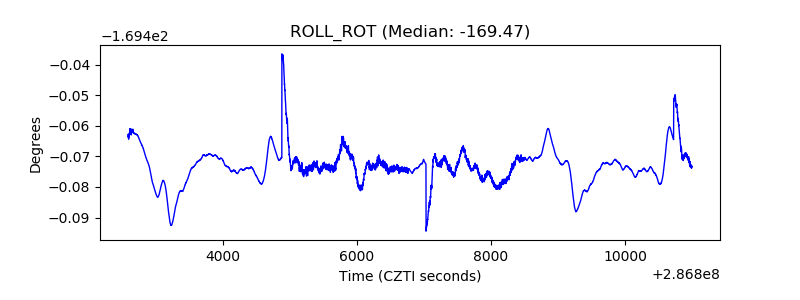 |
| _Roll_DEC | 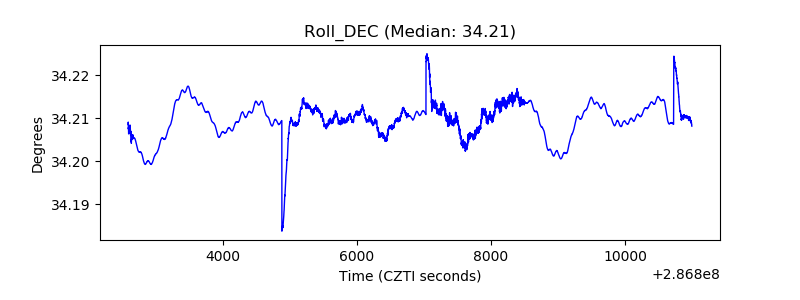 |
| _Roll_RA | 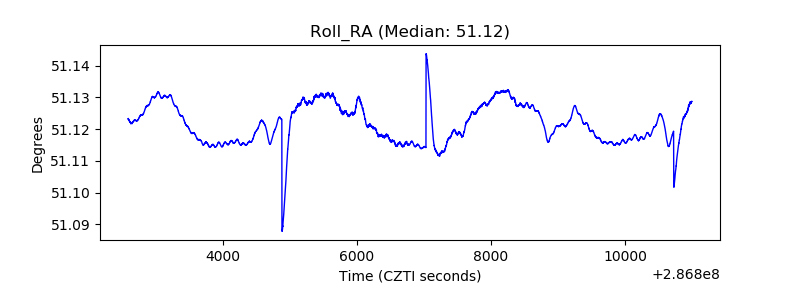 |
| Veto Counter | 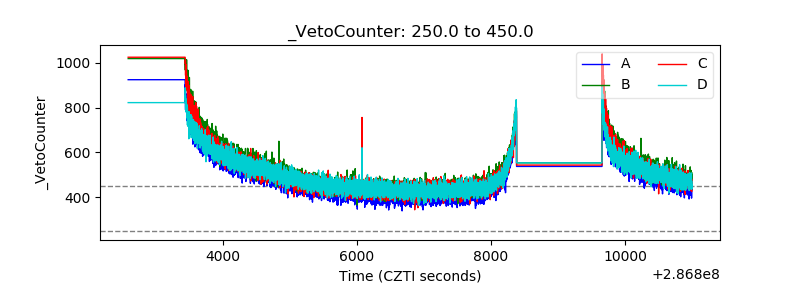 |