| Param | Original file | Final file |
|---|---|---|
| Filename | modeM0/AS1A05_019T01_9000002688_18109cztM0_level2.evt | modeM0/AS1A05_019T01_9000002688_18109cztM0_level2_quad_clean.evt |
| Size (bytes) | 585,420,480 | 94,783,680 |
| Size | 558.3 MB | 90.4 MB |
| Events in quadrant A | 3,136,732 | 648,866 |
| Events in quadrant B | 3,302,392 | 644,108 |
| Events in quadrant C | 3,081,971 | 605,647 |
| Events in quadrant D | 7,778,153 | 528,482 |
| Mode M0 | |||
|---|---|---|---|
| Quadrant | BADHDUFLAG | Total packets | Discarded packets |
| A | 0 | 13272 | 0 |
| B | 0 | 13662 | 0 |
| C | 0 | 13111 | 0 |
| D | 0 | 27398 | 0 |
| Mode M9 | |||
|---|---|---|---|
| Quadrant | BADHDUFLAG | Total packets | Discarded packets |
| A | 0 | 11 | 0 |
| B | 0 | 11 | 0 |
| C | 0 | 11 | 0 |
| D | 0 | 11 | 0 |
| Mode SS | |||
|---|---|---|---|
| Quadrant | BADHDUFLAG | Total packets | Discarded packets |
| A | 0 | 128 | 0 |
| B | 0 | 128 | 0 |
| C | 0 | 128 | 0 |
| D | 0 | 128 | 0 |
| Quadrant | Total seconds | Saturated seconds | Saturation percentage |
|---|---|---|---|
| A | 6349 | 106 | 1.669554% |
| B | 6350 | 124 | 1.952756% |
| C | 6350 | 131 | 2.062992% |
| D | 6350 | 1437 | 22.629921% |
Noise dominated data is calculated using 1-second bins in cleaned event files. If a bin has >2000 counts, and if more than 50% of those come from <1% of pixels, then it is considered to be noise-dominated and hence unusable.
| Quadrant | # 1 sec bins | Bins with >0 counts | Bins with >2000 counts | High rate bins dominated by noise | Noise dominated (total time) | Noise dominated (detector-on time) | Marked lightcurve |
|---|---|---|---|---|---|---|---|
| A | 7439 | 6350 | 2 | 2 | 0.03% | 0.03% | 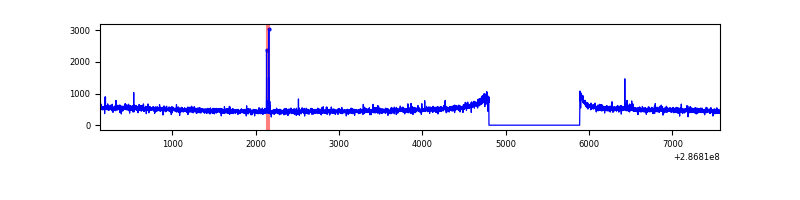 |
| B | 7440 | 6351 | 13 | 13 | 0.17% | 0.20% | 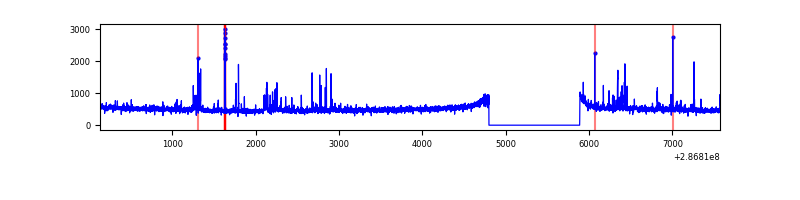 |
| C | 7440 | 6351 | 0 | 0 | 0.00% | 0.00% | 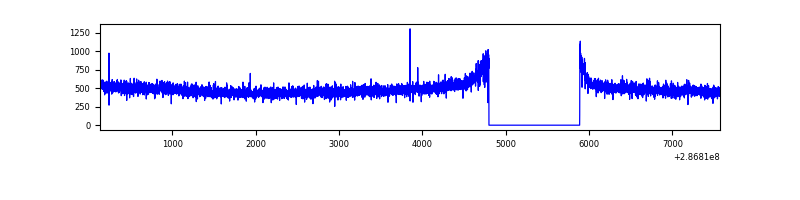 |
| D | 7440 | 6351 | 1296 | 1296 | 17.42% | 20.41% | 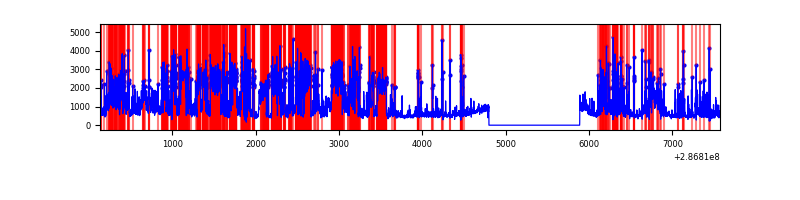 |
Top three noisy pixels from each quadrant. If the there are fewer than three noisy pixels in the level2.evt file, extra rows are filled as -1
| Pixel properties | Quadrant properties | ||||||
|---|---|---|---|---|---|---|---|
| Quadrant | DetID | PixID | Counts | Sigma | Mean | Median | Sigma |
| A | 15 | 174 | 23602 | 141.45 | 807 | 791 | 161.3 |
| A | 4 | 2 | 9513 | 54.09 | 807 | 791 | 161.3 |
| A | 0 | 226 | 7141 | 39.38 | 807 | 791 | 161.3 |
| B | 6 | 36 | 35782 | 229.65 | 794 | 774 | 152.4 |
| B | 7 | 220 | 32986 | 211.31 | 794 | 774 | 152.4 |
| B | 3 | 64 | 31958 | 204.57 | 794 | 774 | 152.4 |
| C | 14 | 238 | 119789 | 670.88 | 758 | 762 | 177.4 |
| C | 13 | 61 | 5387 | 26.07 | 758 | 762 | 177.4 |
| C | 5 | 218 | 3122 | 13.3 | 758 | 762 | 177.4 |
| D | 7 | 238 | 2834212 | 16152.26 | 723 | 703 | 175.4 |
| D | 11 | 176 | 1131794 | 6447.72 | 723 | 703 | 175.4 |
| D | 10 | 70 | 557223 | 3172.41 | 723 | 703 | 175.4 |
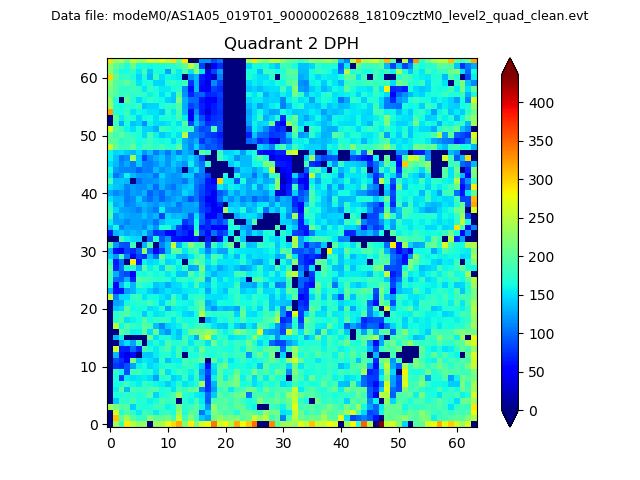
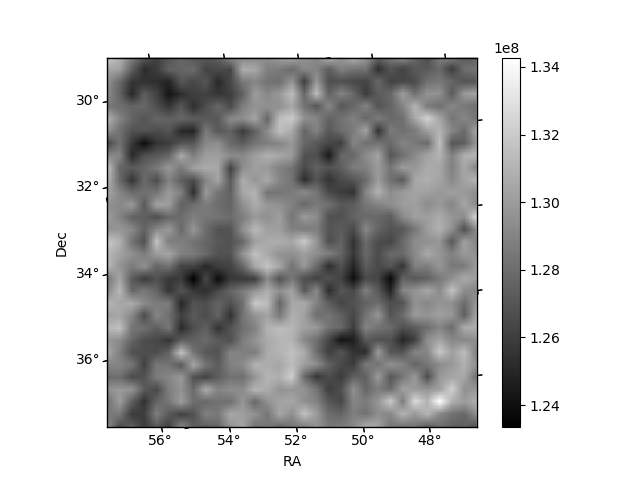
Histogram calculated using DETX and DETY for each event in the final _common_clean file
| Quadrant A | 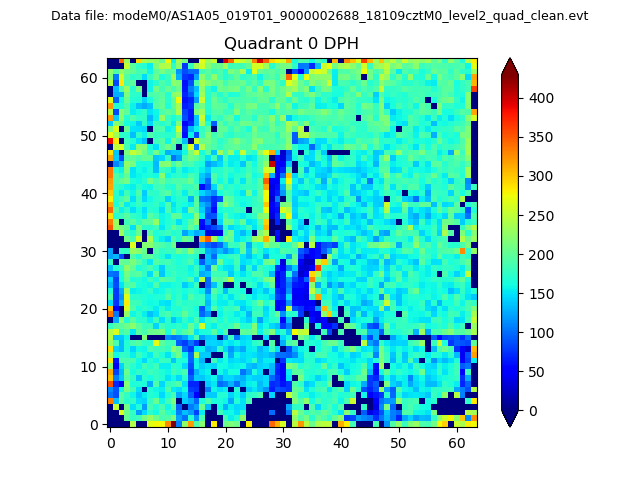 |
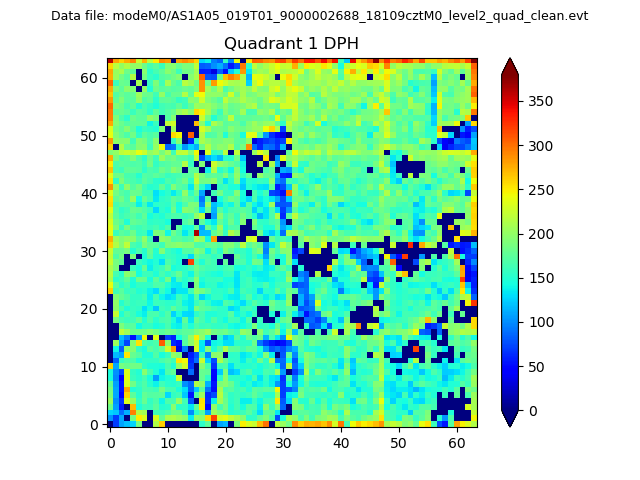 |
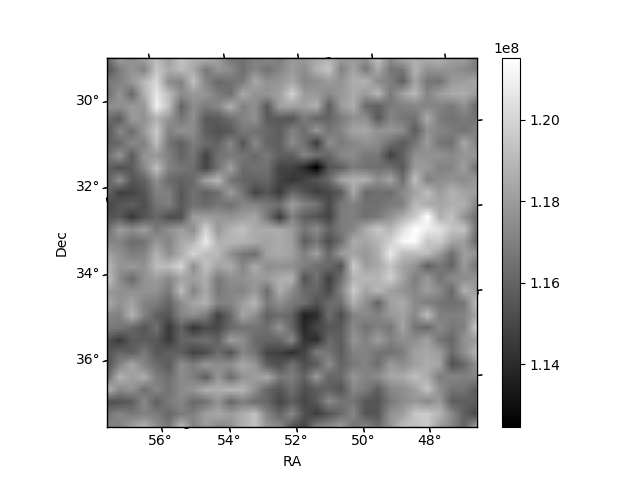
Quadrant B |
|---|---|---|---|
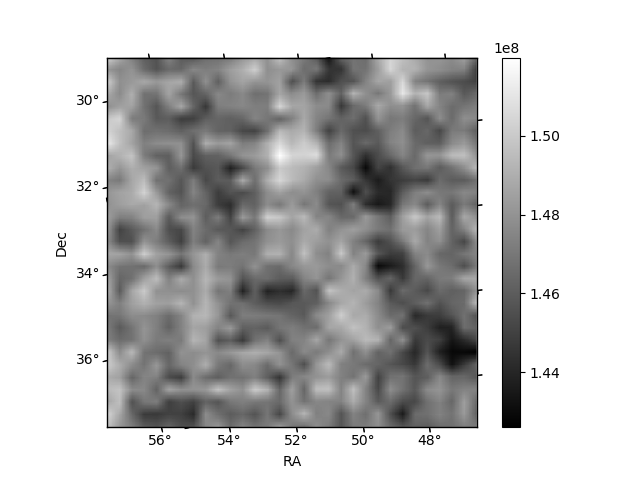
| Quadrant D | 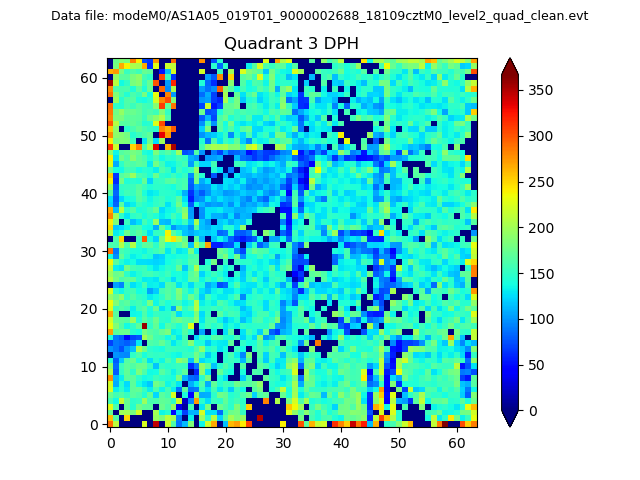 |
 |
Quadrant C |
| Plot type | Count rate plots | Images |
|---|---|---|
| Comparison with Poisson distribution Blue bars denote a histogram of data divided into 1 sec bins. Red curve is a Poisson curve with rate = median count rate of data. |
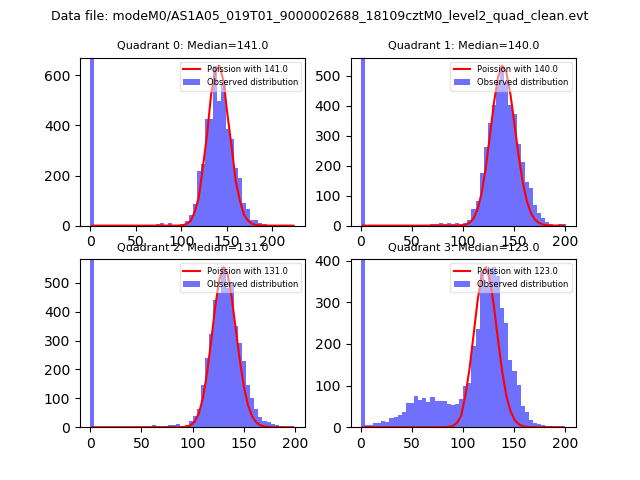 |
 |
| Quadrant-wise count rates Data is divided into 100 sec bins |
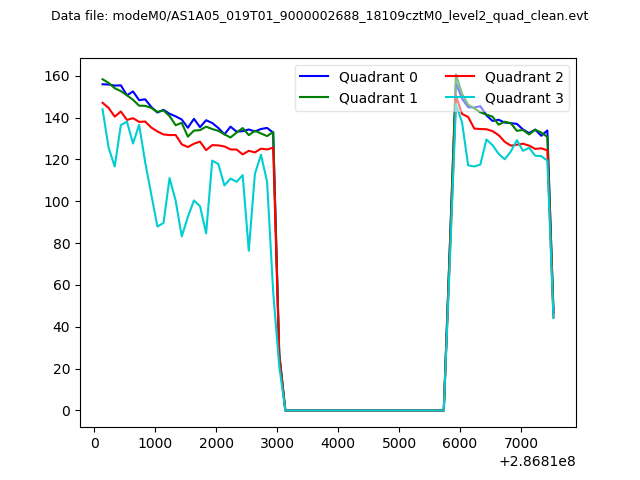 |
|
| Module-wise count rates for Quadrant A Data is divided into 100 sec bins |
 |
 |
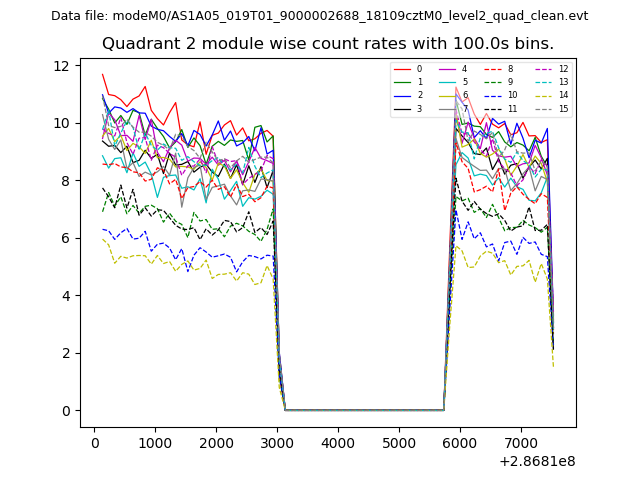
| Module-wise count rates for Quadrant B Data is divided into 100 sec bins |
 |
 |
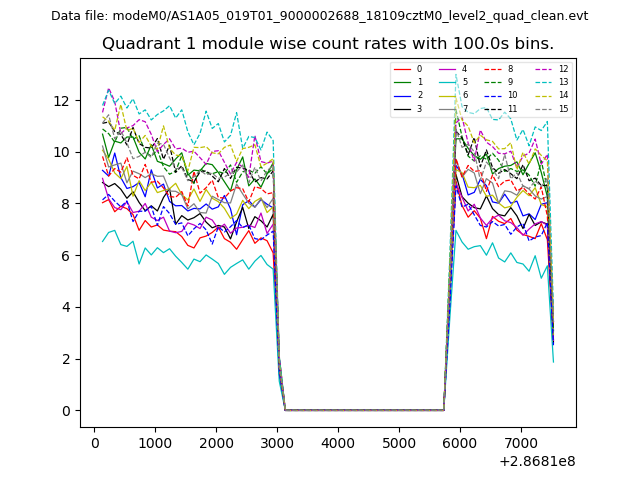
| Module-wise count rates for Quadrant C Data is divided into 100 sec bins |
 |
 |
| Module-wise count rates for Quadrant D Data is divided into 100 sec bins |
 |
 |
| Parameter | Plot |
|---|---|
| CZT HV Monitor | 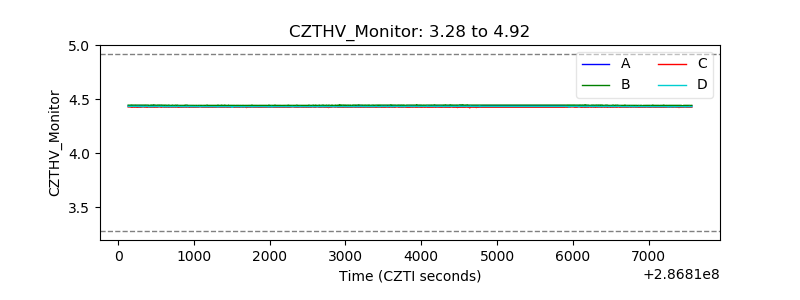 |
| D_VDD | 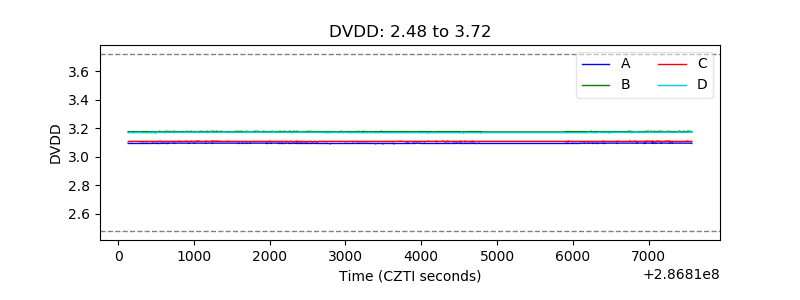 |
| Temperature 1 | 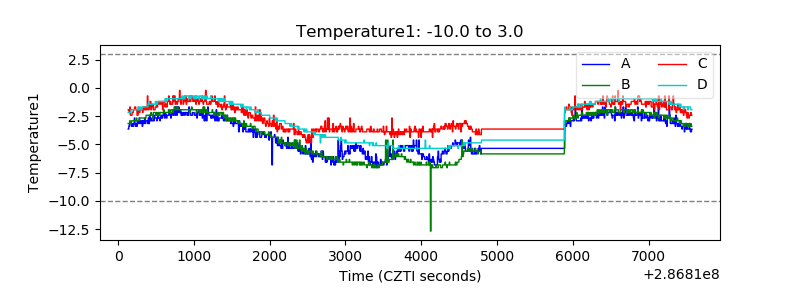 |
| Veto HV Monitor | 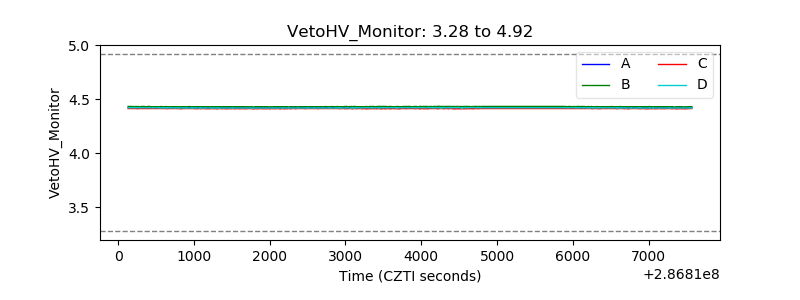 |
| Veto LLD | 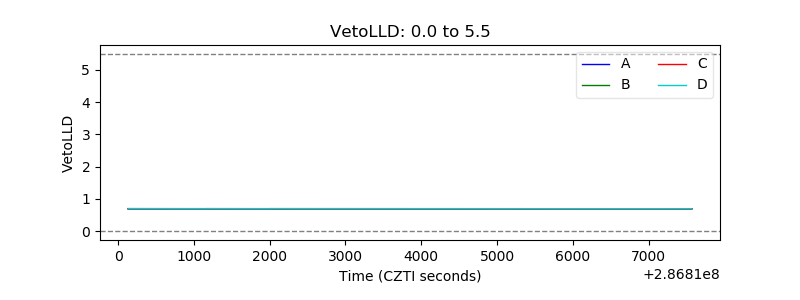 |
| Alpha Counter | 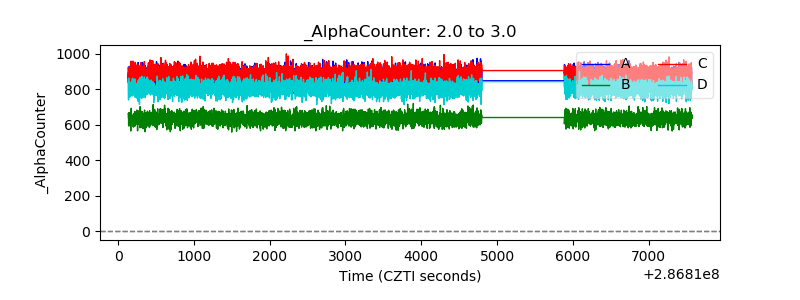 |
| _CPM_Rate | 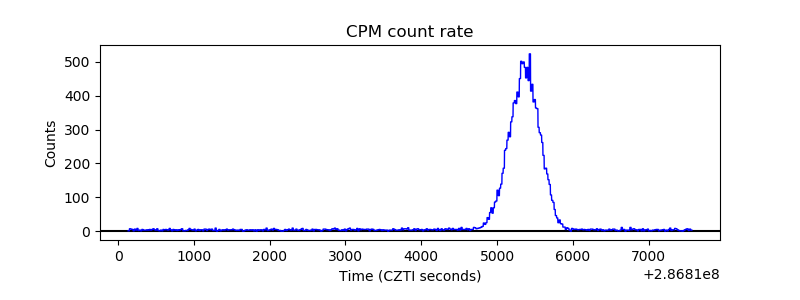 |
| CZT Counter | 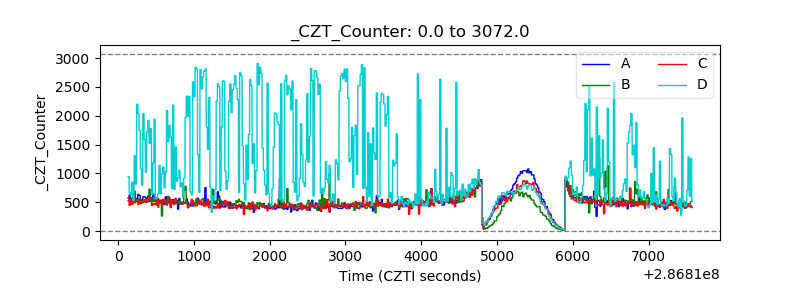 |
| +2.5 Volts monitor |  |
| +5 Volts monitor |  |
| _ROLL_ROT | 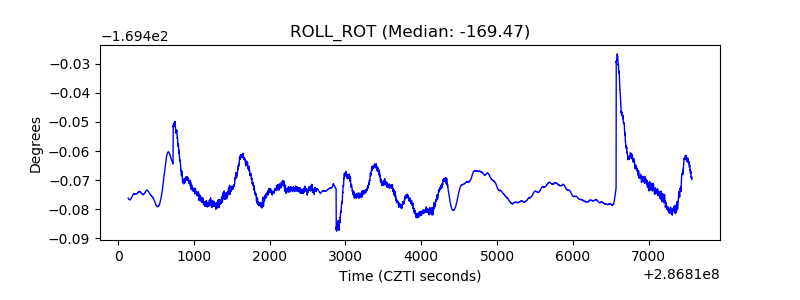 |
| _Roll_DEC | 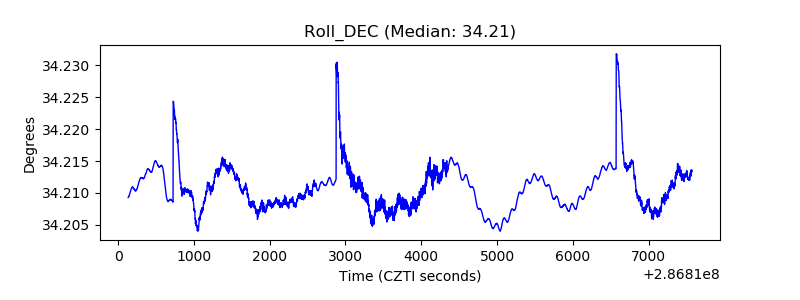 |
| _Roll_RA | 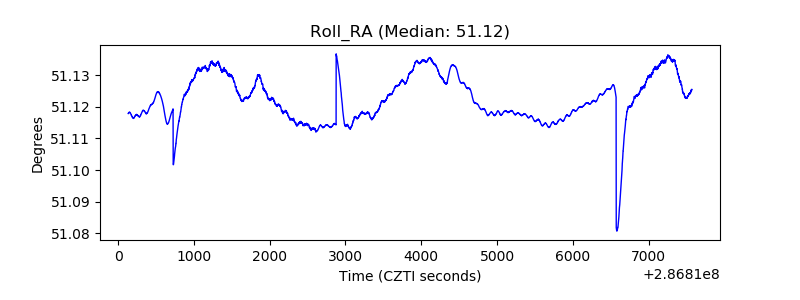 |
| Veto Counter | 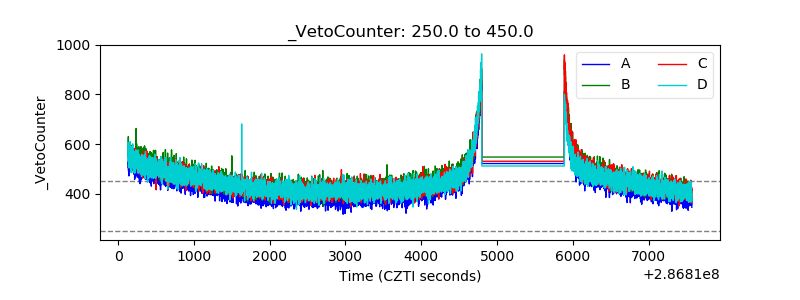 |