| Param | Original file | Final file |
|---|---|---|
| Filename | modeM0/AS1A05_019T01_9000002688_18110cztM0_level2.evt | modeM0/AS1A05_019T01_9000002688_18110cztM0_level2_quad_clean.evt |
| Size (bytes) | 529,015,680 | 92,646,720 |
| Size | 504.5 MB | 88.4 MB |
| Events in quadrant A | 3,211,857 | 606,976 |
| Events in quadrant B | 3,852,419 | 603,782 |
| Events in quadrant C | 3,212,779 | 574,658 |
| Events in quadrant D | 5,285,110 | 548,424 |
| Mode M0 | |||
|---|---|---|---|
| Quadrant | BADHDUFLAG | Total packets | Discarded packets |
| A | 0 | 13957 | 1 |
| B | 0 | 15743 | 1 |
| C | 0 | 13870 | 1 |
| D | 0 | 20191 | 1 |
| Mode M9 | |||
|---|---|---|---|
| Quadrant | BADHDUFLAG | Total packets | Discarded packets |
| A | 0 | 8 | 0 |
| B | 0 | 8 | 0 |
| C | 0 | 8 | 0 |
| D | 0 | 8 | 0 |
| Mode SS | |||
|---|---|---|---|
| Quadrant | BADHDUFLAG | Total packets | Discarded packets |
| A | 0 | 138 | 0 |
| B | 0 | 138 | 0 |
| C | 0 | 138 | 0 |
| D | 0 | 138 | 0 |
| Quadrant | Total seconds | Saturated seconds | Saturation percentage |
|---|---|---|---|
| A | 6765 | 51 | 0.753880% |
| B | 6765 | 240 | 3.547672% |
| C | 6766 | 77 | 1.138043% |
| D | 6765 | 413 | 6.104952% |
Noise dominated data is calculated using 1-second bins in cleaned event files. If a bin has >2000 counts, and if more than 50% of those come from <1% of pixels, then it is considered to be noise-dominated and hence unusable.
| Quadrant | # 1 sec bins | Bins with >0 counts | Bins with >2000 counts | High rate bins dominated by noise | Noise dominated (total time) | Noise dominated (detector-on time) | Marked lightcurve |
|---|---|---|---|---|---|---|---|
| A | 7580 | 6766 | 0 | 0 | 0.00% | 0.00% | 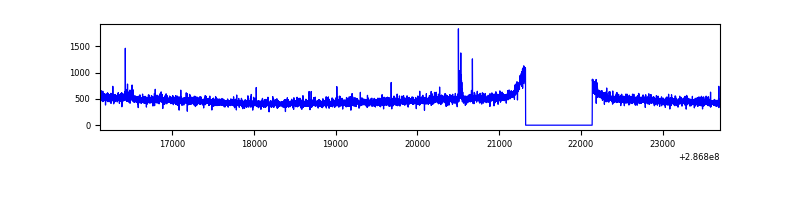 |
| B | 7580 | 6766 | 121 | 121 | 1.60% | 1.79% | 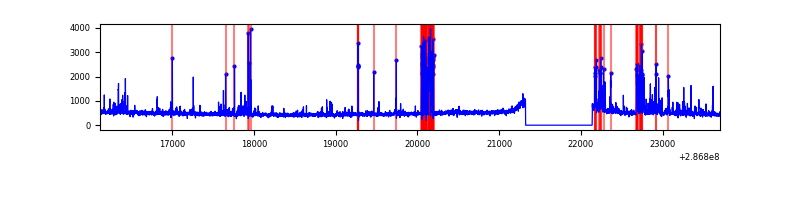 |
| C | 7581 | 6767 | 0 | 0 | 0.00% | 0.00% | 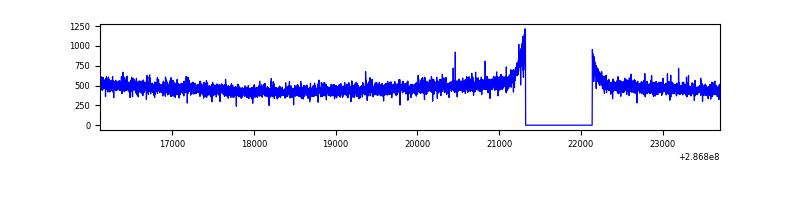 |
| D | 7580 | 6766 | 324 | 324 | 4.27% | 4.79% | 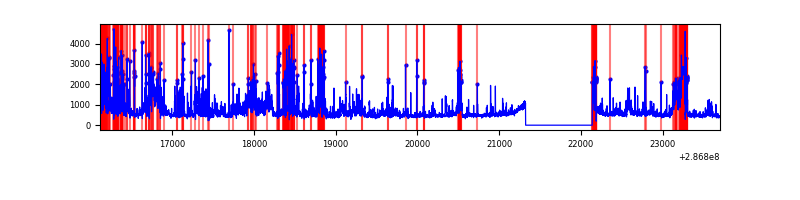 |
Top three noisy pixels from each quadrant. If the there are fewer than three noisy pixels in the level2.evt file, extra rows are filled as -1
| Pixel properties | Quadrant properties | ||||||
|---|---|---|---|---|---|---|---|
| Quadrant | DetID | PixID | Counts | Sigma | Mean | Median | Sigma |
| A | 4 | 2 | 17704 | 100.29 | 829 | 814 | 168.4 |
| A | 0 | 226 | 7291 | 38.46 | 829 | 814 | 168.4 |
| A | 3 | 137 | 6170 | 31.8 | 829 | 814 | 168.4 |
| B | 6 | 36 | 505043 | 3235.07 | 812 | 792 | 155.9 |
| B | 7 | 220 | 46849 | 295.48 | 812 | 792 | 155.9 |
| B | 4 | 171 | 35288 | 221.31 | 812 | 792 | 155.9 |
| C | 14 | 238 | 121710 | 648.88 | 789 | 794 | 186.3 |
| C | 5 | 218 | 7535 | 36.17 | 789 | 794 | 186.3 |
| C | 13 | 61 | 5484 | 25.17 | 789 | 794 | 186.3 |
| D | 7 | 238 | 868255 | 4562.67 | 788 | 768 | 190.1 |
| D | 10 | 70 | 590826 | 3103.49 | 788 | 768 | 190.1 |
| D | 11 | 176 | 398326 | 2091.01 | 788 | 768 | 190.1 |
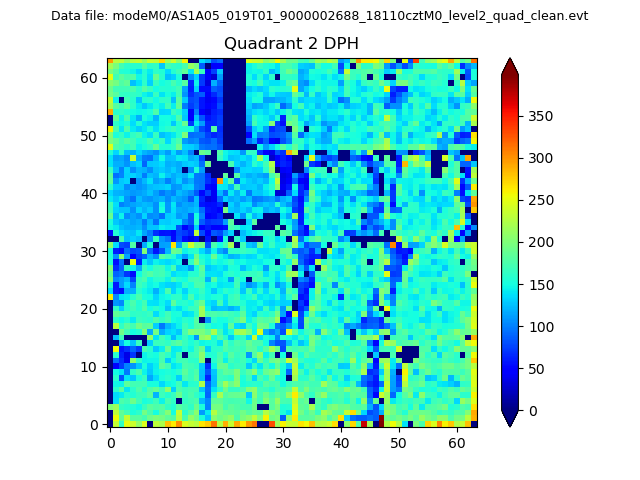
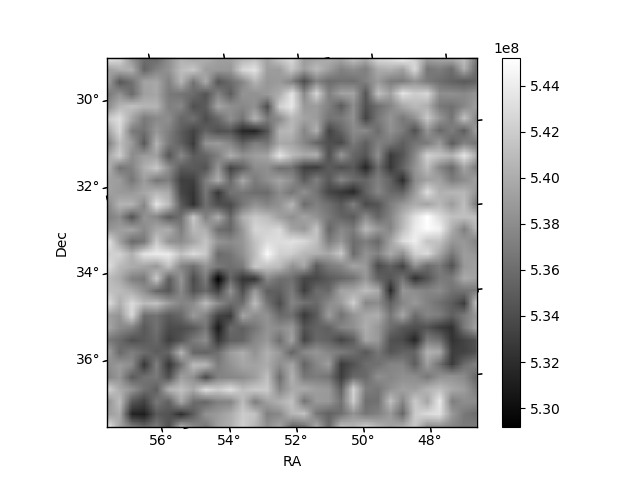
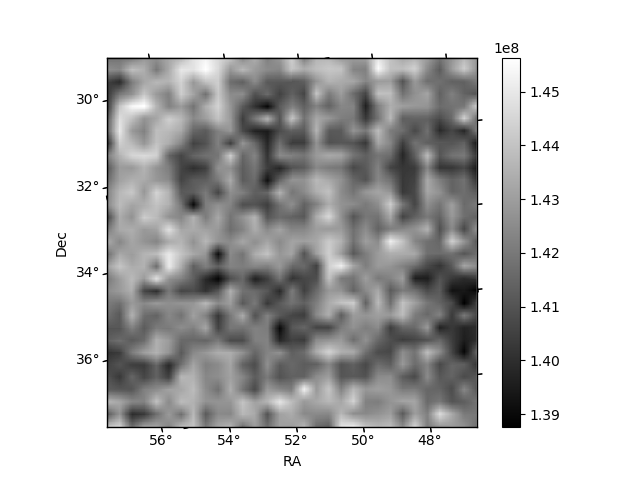
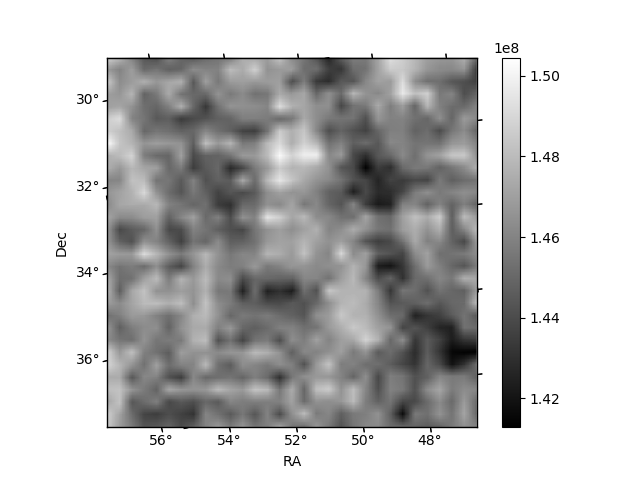
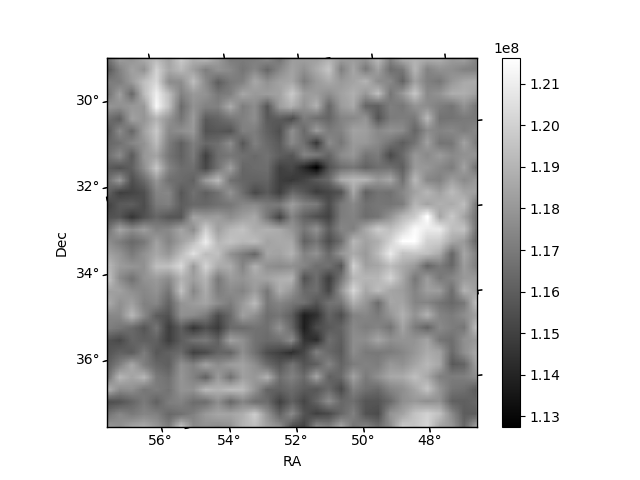
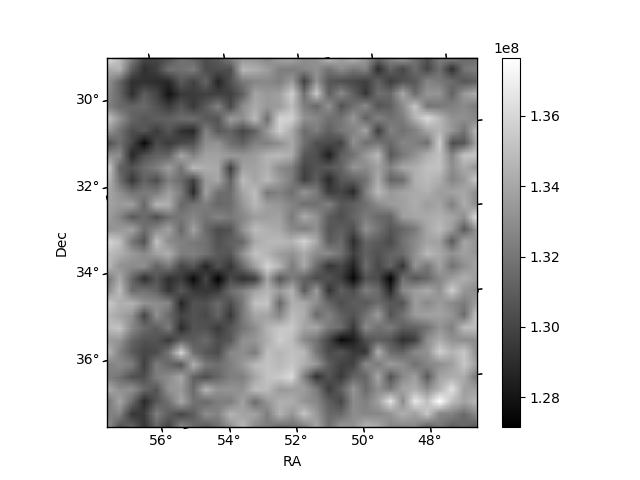
Histogram calculated using DETX and DETY for each event in the final _common_clean file
| Quadrant A | 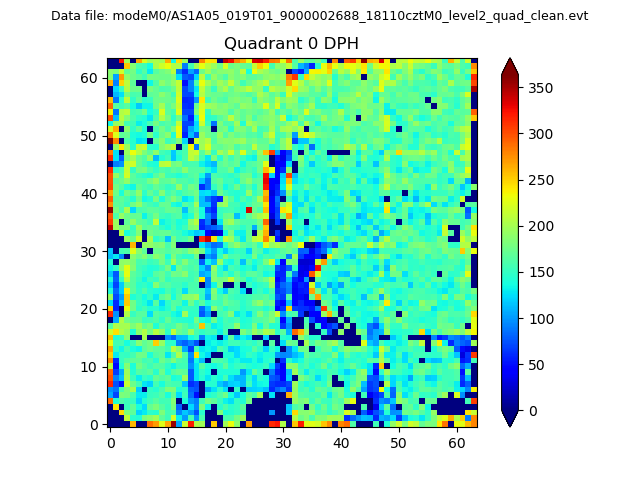 |
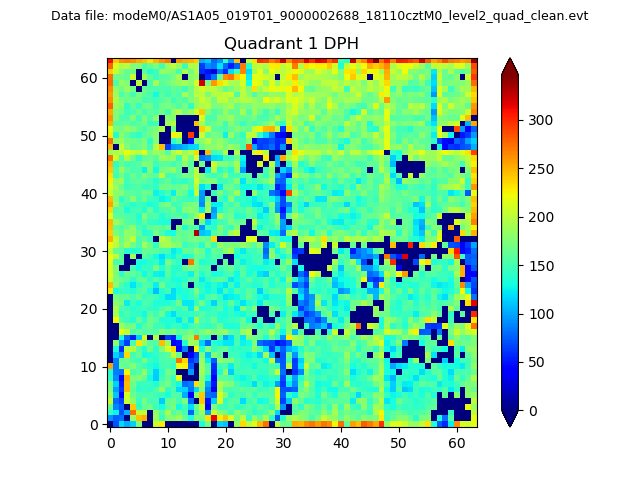 |
Quadrant B |
|---|---|---|---|
| Quadrant D | 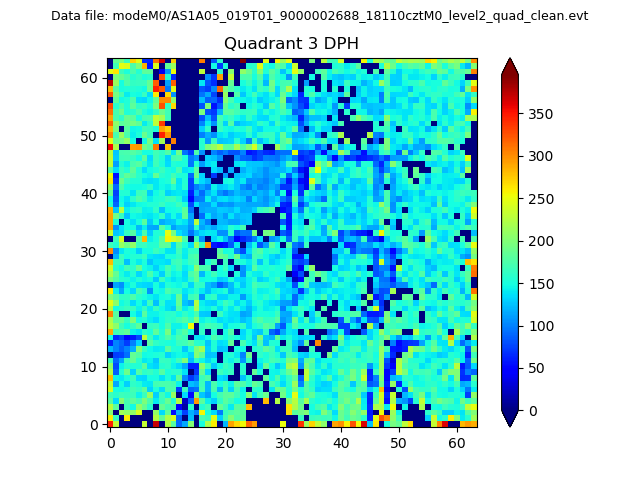 |
 |
Quadrant C |
| Plot type | Count rate plots | Images |
|---|---|---|
| Comparison with Poisson distribution Blue bars denote a histogram of data divided into 1 sec bins. Red curve is a Poisson curve with rate = median count rate of data. |
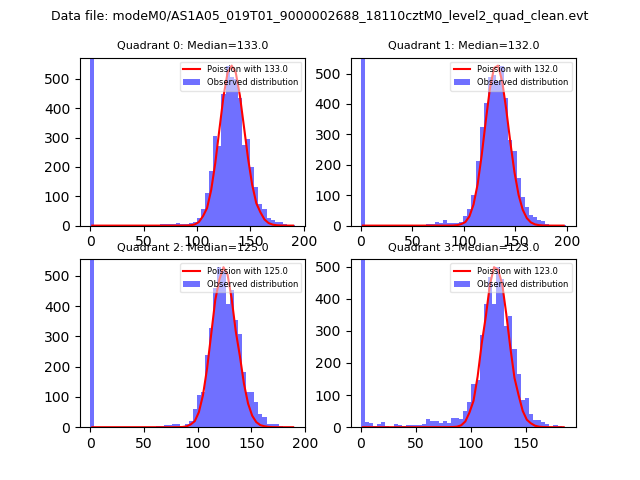 |
 |
| Quadrant-wise count rates Data is divided into 100 sec bins |
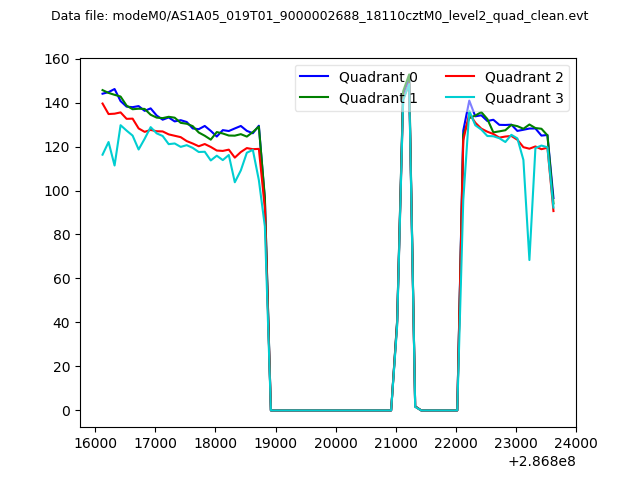 |
|
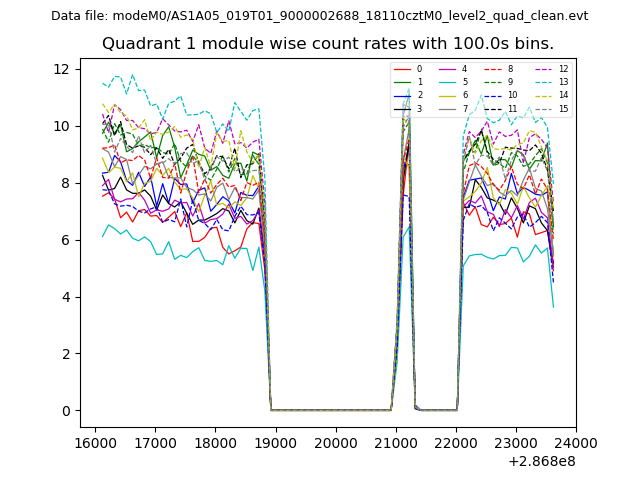
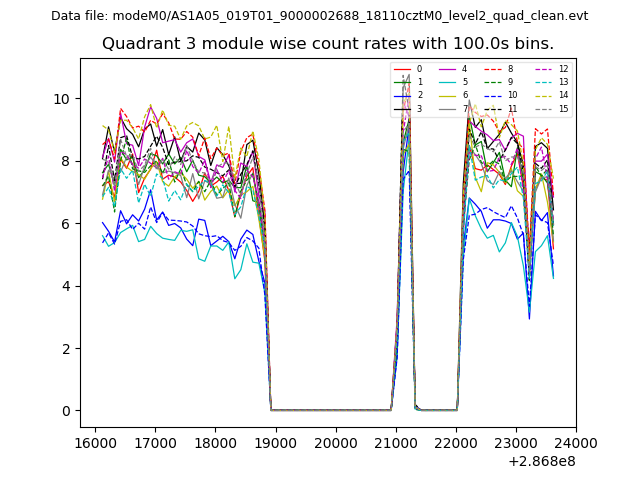
| Module-wise count rates for Quadrant A Data is divided into 100 sec bins |
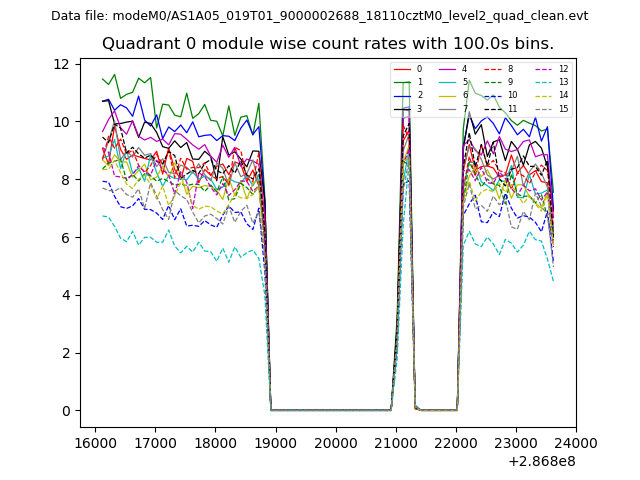 |
 |
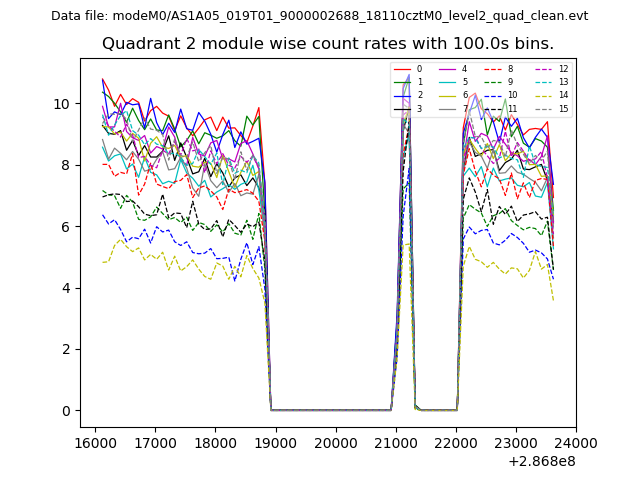
| Module-wise count rates for Quadrant B Data is divided into 100 sec bins |
 |
 |
| Module-wise count rates for Quadrant C Data is divided into 100 sec bins |
 |
 |
| Module-wise count rates for Quadrant D Data is divided into 100 sec bins |
 |
 |
| Parameter | Plot |
|---|---|
| CZT HV Monitor | 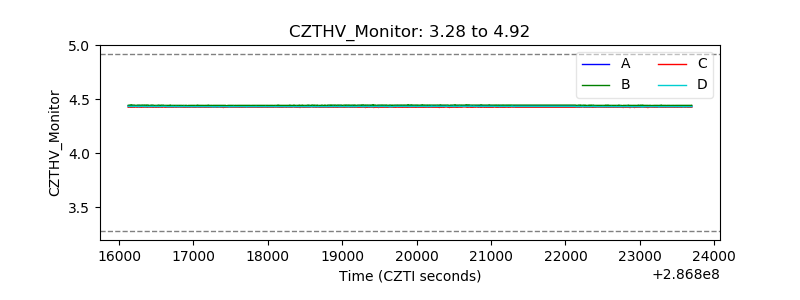 |
| D_VDD | 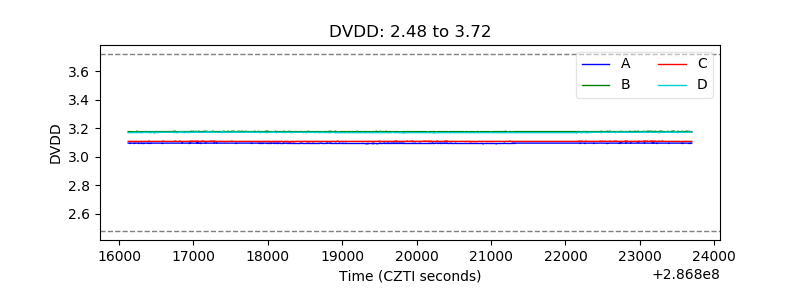 |
| Temperature 1 | 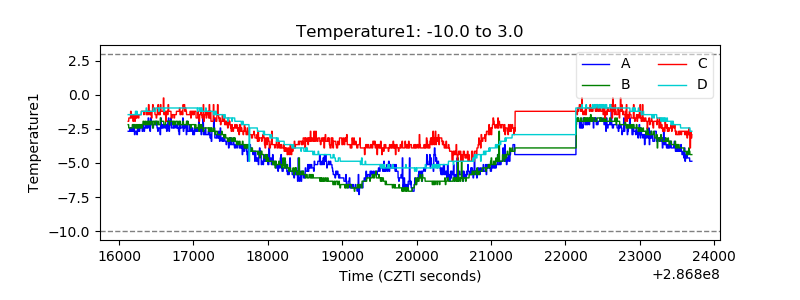 |
| Veto HV Monitor | 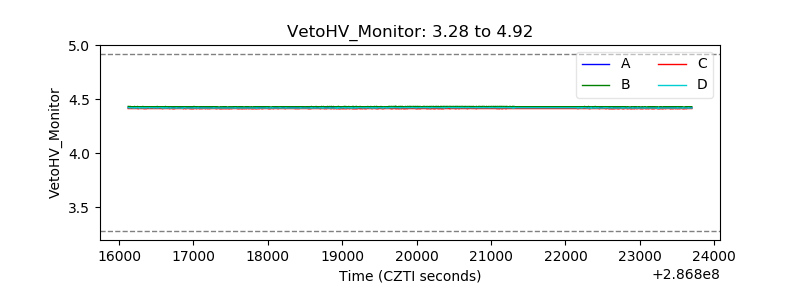 |
| Veto LLD | 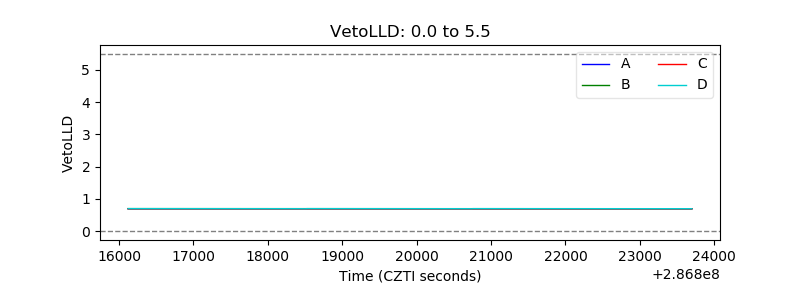 |
| Alpha Counter | 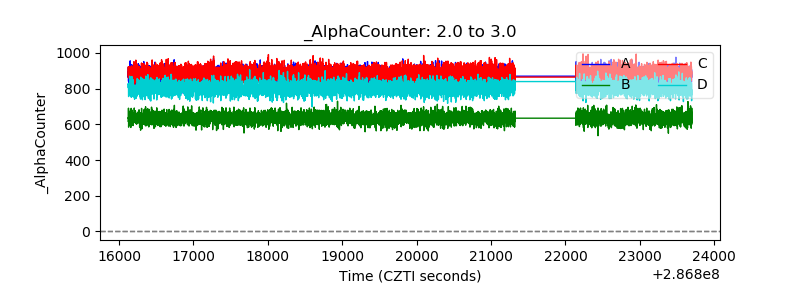 |
| _CPM_Rate | 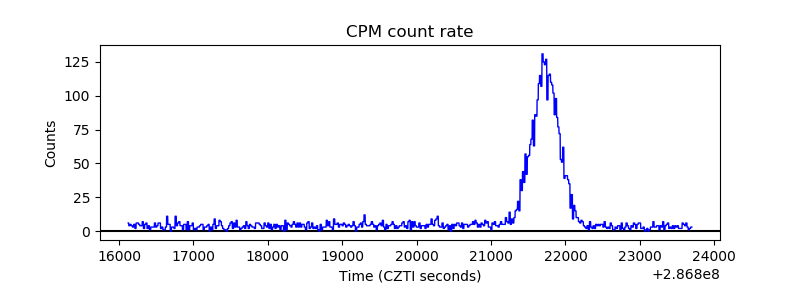 |
| CZT Counter | 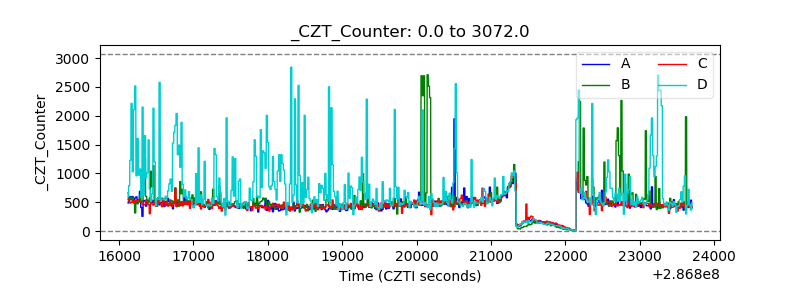 |
| +2.5 Volts monitor |  |
| +5 Volts monitor |  |
| _ROLL_ROT | 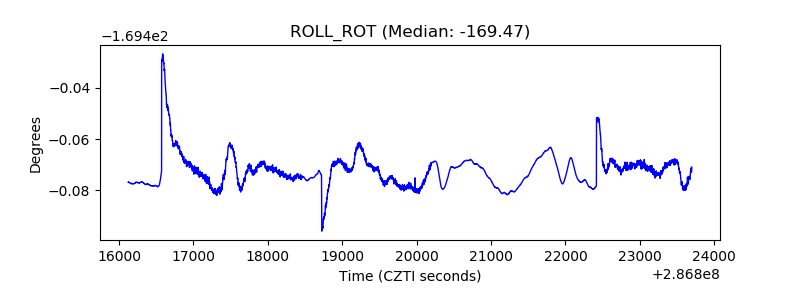 |
| _Roll_DEC | 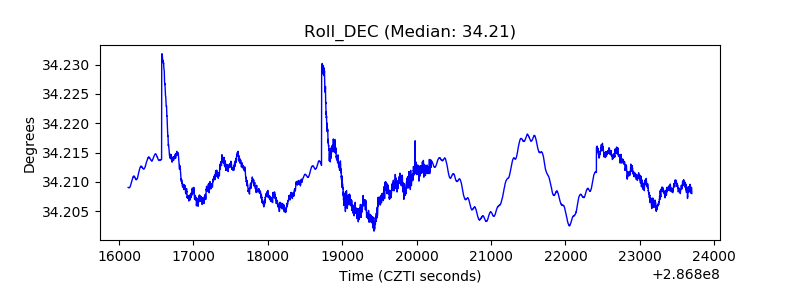 |
| _Roll_RA | 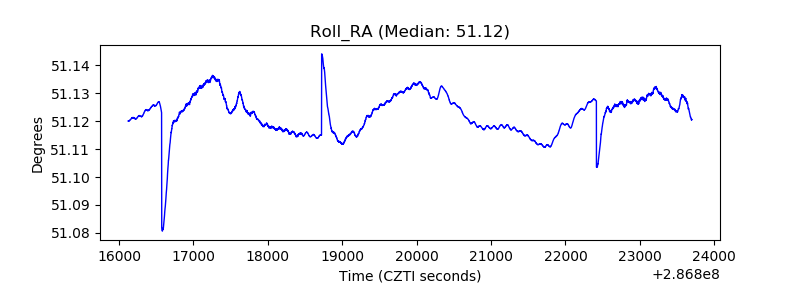 |
| Veto Counter | 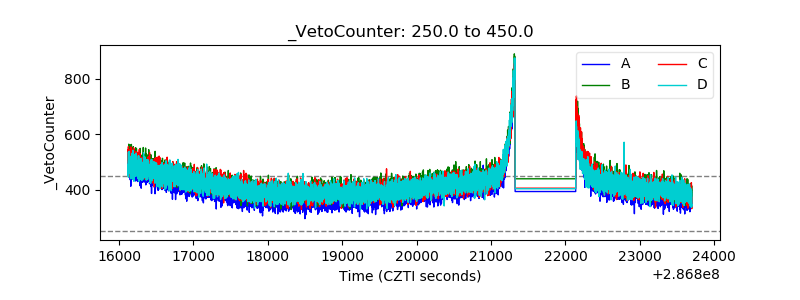 |