| Param | Original file | Final file |
|---|---|---|
| Filename | modeM0/AS1A05_019T01_9000002688_18112cztM0_level2.evt | modeM0/AS1A05_019T01_9000002688_18112cztM0_level2_quad_clean.evt |
| Size (bytes) | 694,500,480 | 107,118,720 |
| Size | 662.3 MB | 102.2 MB |
| Events in quadrant A | 4,864,729 | 691,655 |
| Events in quadrant B | 3,991,703 | 717,166 |
| Events in quadrant C | 3,667,707 | 681,602 |
| Events in quadrant D | 7,984,688 | 614,413 |
| Mode M0 | |||
|---|---|---|---|
| Quadrant | BADHDUFLAG | Total packets | Discarded packets |
| A | 0 | 19778 | 2 |
| B | 0 | 16996 | 2 |
| C | 0 | 16043 | 2 |
| D | 0 | 28895 | 2 |
| Mode M9 | |||
|---|---|---|---|
| Quadrant | BADHDUFLAG | Total packets | Discarded packets |
| A | 0 | 2 | 0 |
| B | 0 | 3 | 0 |
| C | 0 | 3 | 0 |
| D | 0 | 3 | 0 |
| Mode SS | |||
|---|---|---|---|
| Quadrant | BADHDUFLAG | Total packets | Discarded packets |
| A | 0 | 158 | 0 |
| B | 0 | 158 | 0 |
| C | 0 | 158 | 0 |
| D | 0 | 158 | 0 |
| Quadrant | Total seconds | Saturated seconds | Saturation percentage |
|---|---|---|---|
| A | 7744 | 529 | 6.831095% |
| B | 7744 | 136 | 1.756198% |
| C | 7744 | 115 | 1.485021% |
| D | 7744 | 1224 | 15.805785% |
Noise dominated data is calculated using 1-second bins in cleaned event files. If a bin has >2000 counts, and if more than 50% of those come from <1% of pixels, then it is considered to be noise-dominated and hence unusable.
| Quadrant | # 1 sec bins | Bins with >0 counts | Bins with >2000 counts | High rate bins dominated by noise | Noise dominated (total time) | Noise dominated (detector-on time) | Marked lightcurve |
|---|---|---|---|---|---|---|---|
| A | 7924 | 7746 | 237 | 237 | 2.99% | 3.06% | 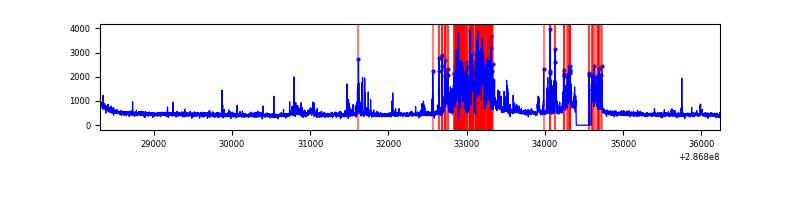 |
| B | 7924 | 7746 | 20 | 20 | 0.25% | 0.26% | 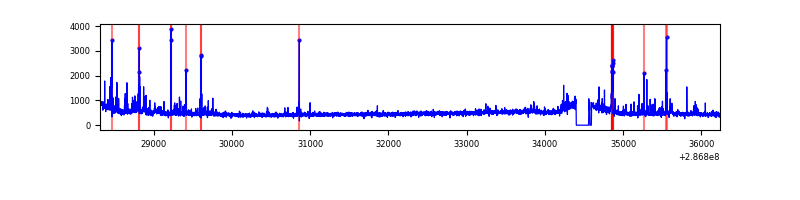 |
| C | 7924 | 7746 | 0 | 0 | 0.00% | 0.00% | 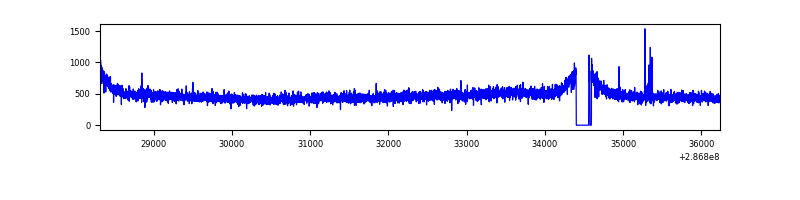 |
| D | 7924 | 7745 | 1014 | 1014 | 12.80% | 13.09% | 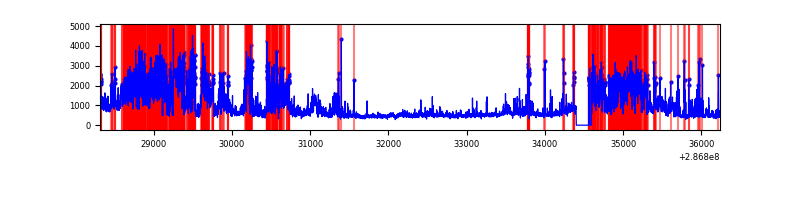 |
Top three noisy pixels from each quadrant. If the there are fewer than three noisy pixels in the level2.evt file, extra rows are filled as -1
| Pixel properties | Quadrant properties | ||||||
|---|---|---|---|---|---|---|---|
| Quadrant | DetID | PixID | Counts | Sigma | Mean | Median | Sigma |
| A | 4 | 2 | 1214531 | 6446.17 | 920 | 898 | 188.3 |
| A | 15 | 174 | 113785 | 599.6 | 920 | 898 | 188.3 |
| A | 0 | 226 | 7980 | 37.62 | 920 | 898 | 188.3 |
| B | 5 | 172 | 112273 | 618.14 | 934 | 909 | 180.2 |
| B | 7 | 220 | 104111 | 572.83 | 934 | 909 | 180.2 |
| B | 3 | 64 | 37195 | 201.41 | 934 | 909 | 180.2 |
| C | 14 | 238 | 137158 | 639.37 | 897 | 901 | 213.1 |
| C | 0 | 207 | 18139 | 80.89 | 897 | 901 | 213.1 |
| C | 3 | 233 | 13690 | 60.01 | 897 | 901 | 213.1 |
| D | 7 | 238 | 3646677 | 17132.44 | 866 | 839 | 212.8 |
| D | 13 | 104 | 277223 | 1298.78 | 866 | 839 | 212.8 |
| D | 1 | 52 | 254881 | 1193.79 | 866 | 839 | 212.8 |
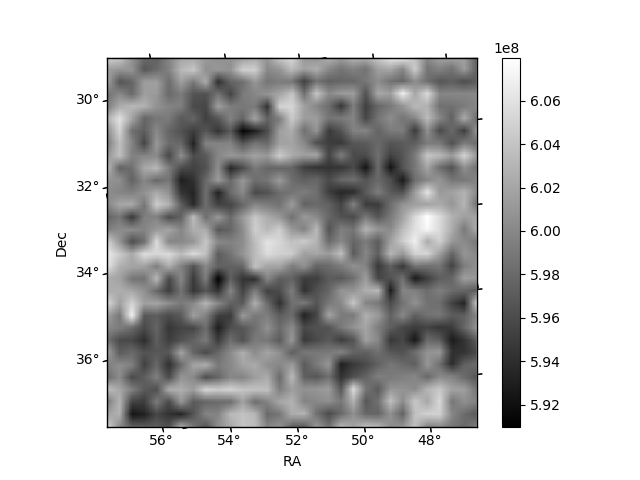
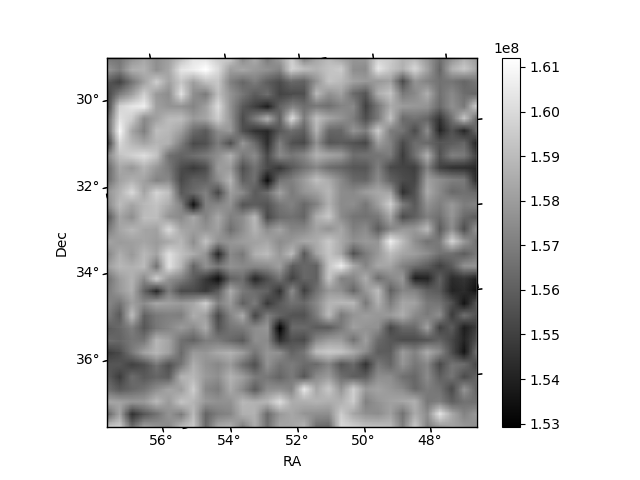
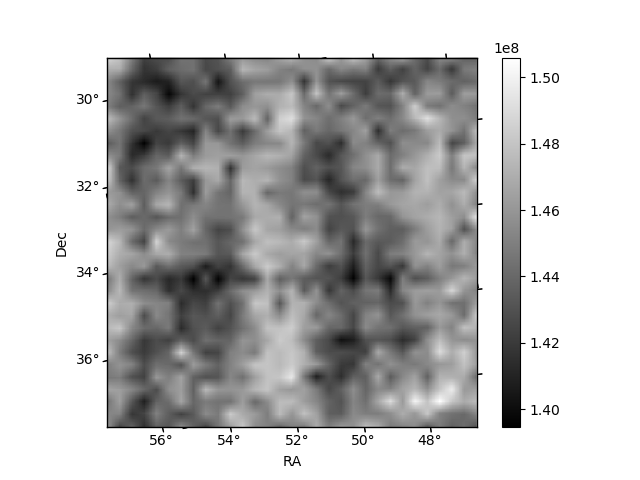
Histogram calculated using DETX and DETY for each event in the final _common_clean file
| Quadrant A | 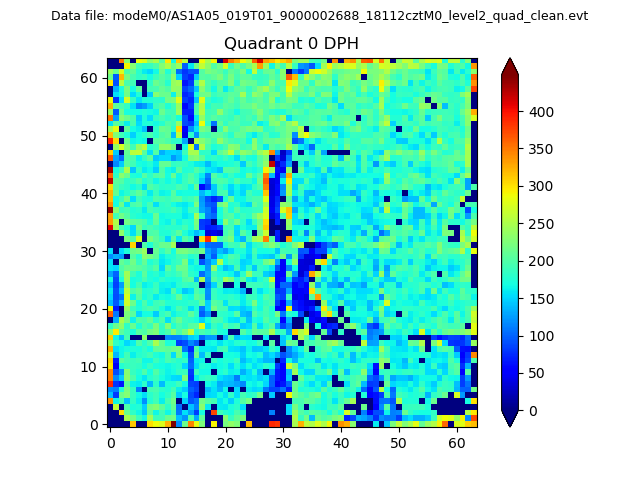 |
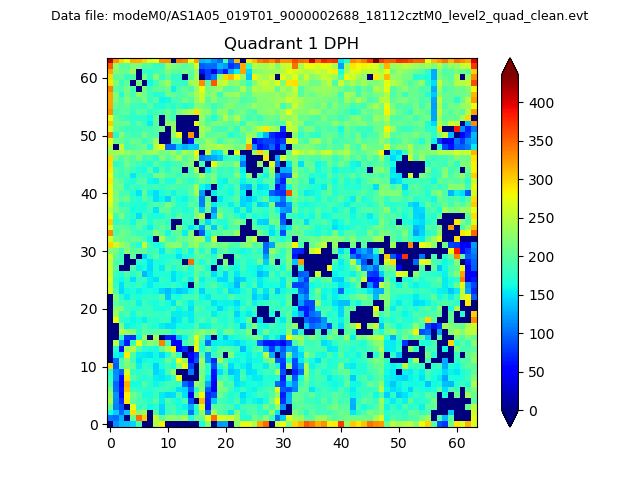 |
Quadrant B |
|---|---|---|---|
| Quadrant D |  |
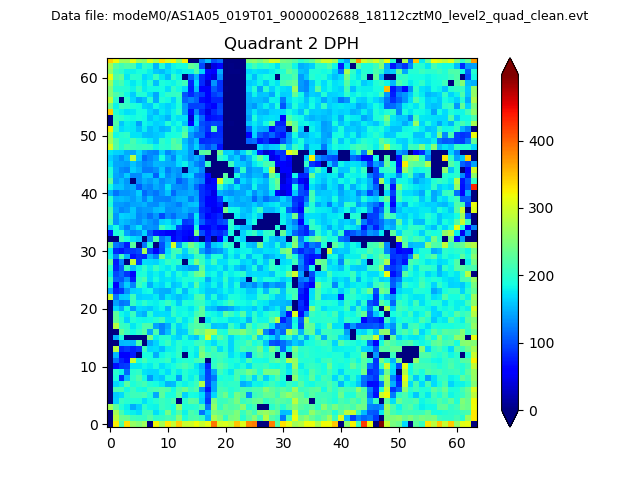 |
Quadrant C |
| Plot type | Count rate plots | Images |
|---|---|---|
| Comparison with Poisson distribution Blue bars denote a histogram of data divided into 1 sec bins. Red curve is a Poisson curve with rate = median count rate of data. |
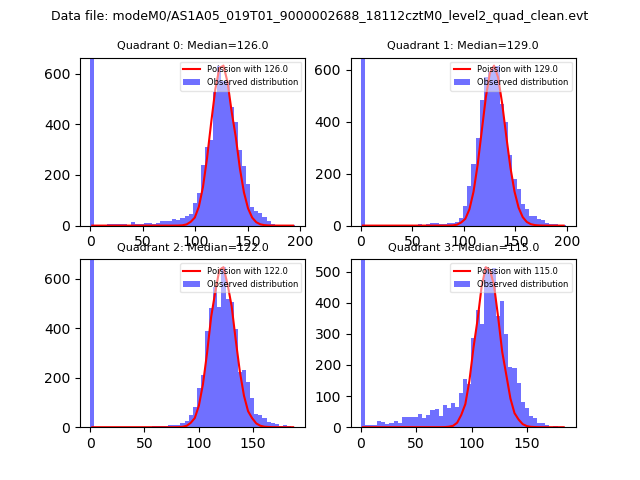 |
 |
| Quadrant-wise count rates Data is divided into 100 sec bins |
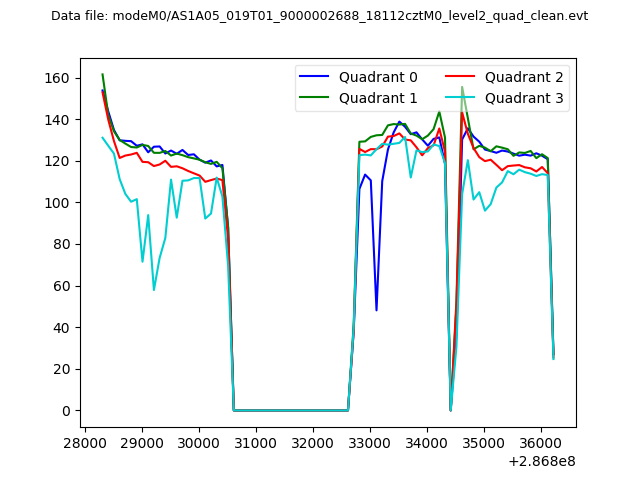 |
|
| Module-wise count rates for Quadrant A Data is divided into 100 sec bins |
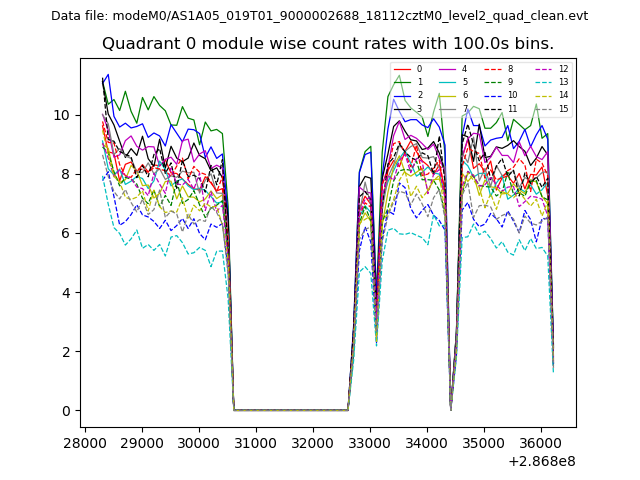 |
 |
| Module-wise count rates for Quadrant B Data is divided into 100 sec bins |
 |
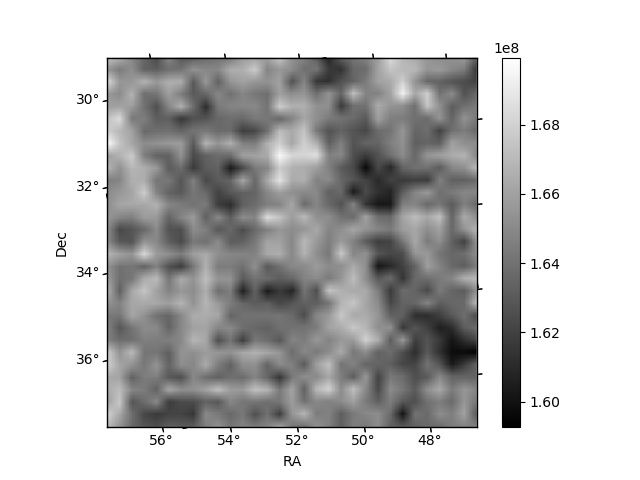 |
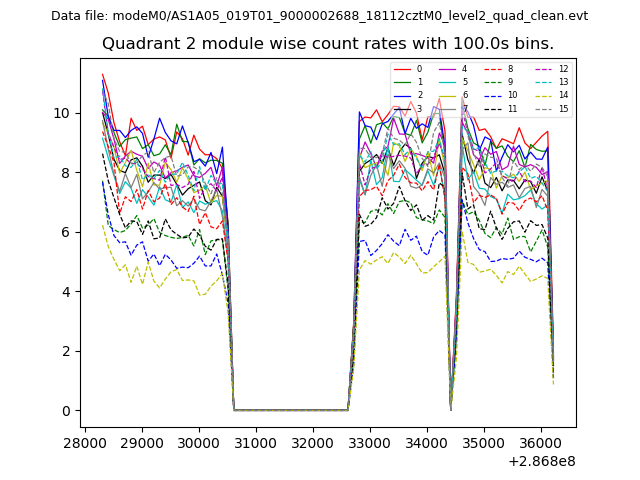
| Module-wise count rates for Quadrant C Data is divided into 100 sec bins |
 |
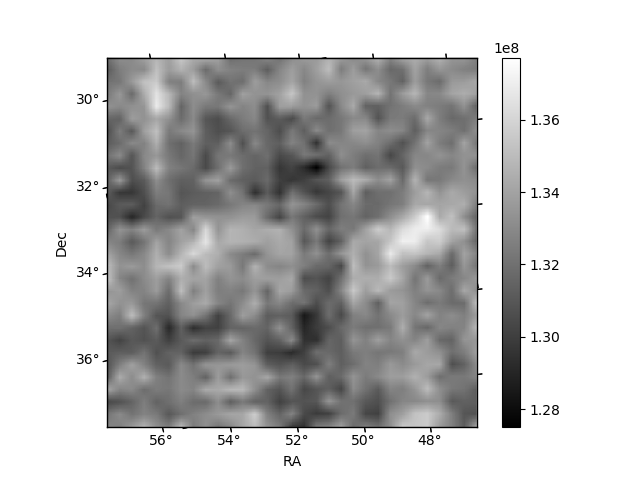 |
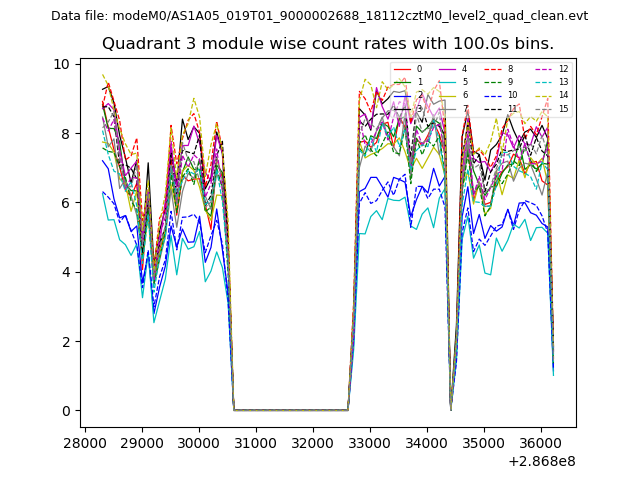
| Module-wise count rates for Quadrant D Data is divided into 100 sec bins |
 |
 |
| Parameter | Plot |
|---|---|
| CZT HV Monitor | 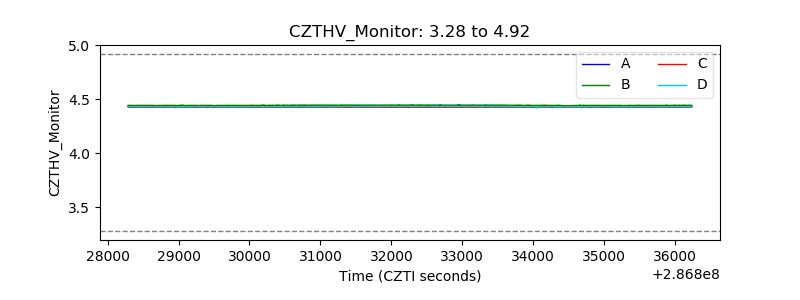 |
| D_VDD | 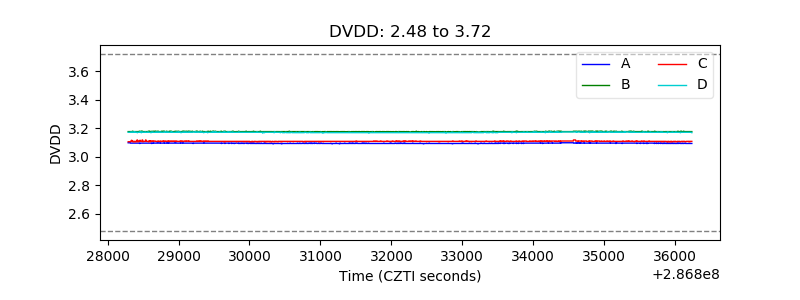 |
| Temperature 1 | 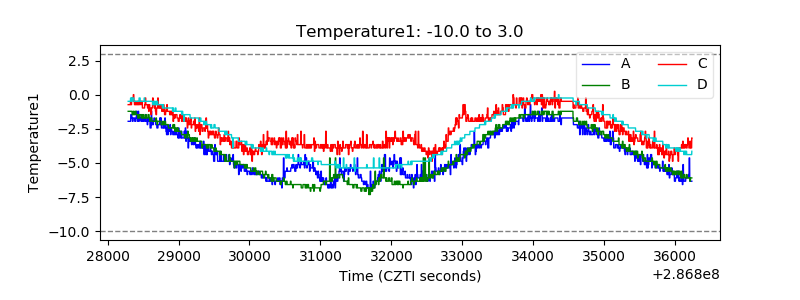 |
| Veto HV Monitor |  |
| Veto LLD | 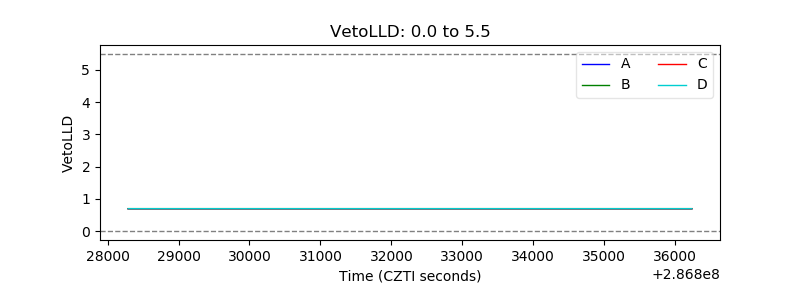 |
| Alpha Counter | 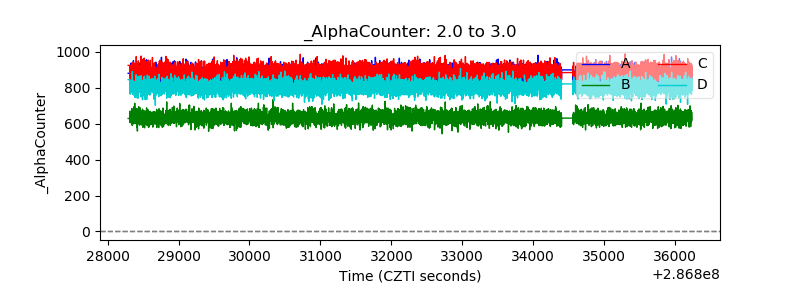 |
| _CPM_Rate | 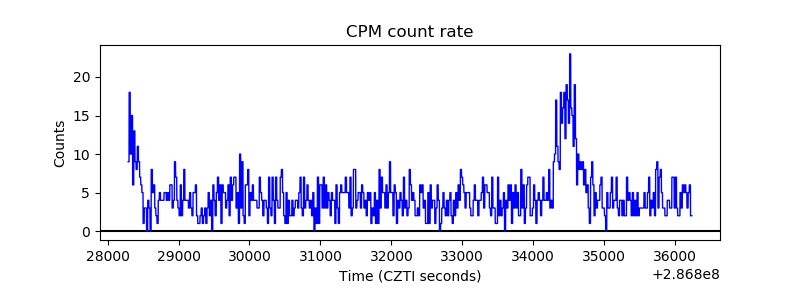 |
| CZT Counter | 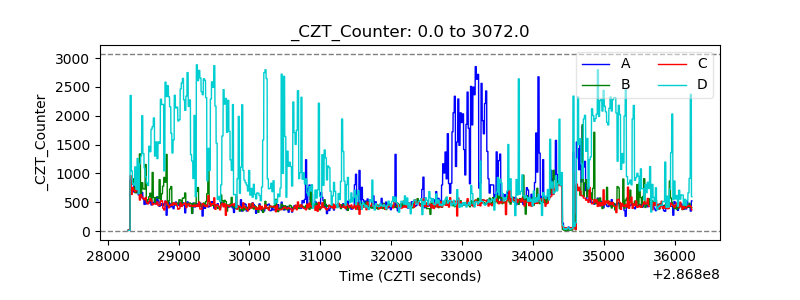 |
| +2.5 Volts monitor |  |
| +5 Volts monitor |  |
| _ROLL_ROT |  |
| _Roll_DEC | 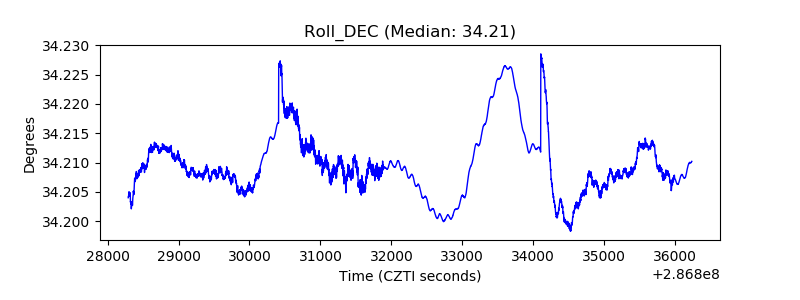 |
| _Roll_RA | 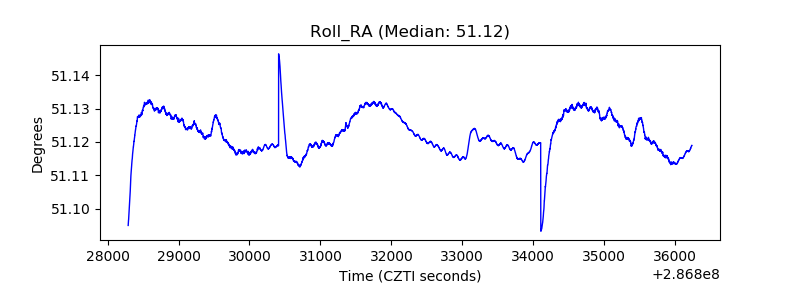 |
| Veto Counter | 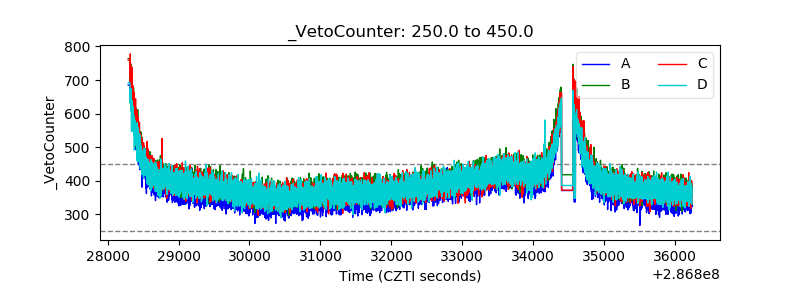 |