| Param | Original file | Final file |
|---|---|---|
| Filename | modeM0/AS1A05_019T01_9000002688_18113cztM0_level2.evt | modeM0/AS1A05_019T01_9000002688_18113cztM0_level2_quad_clean.evt |
| Size (bytes) | 642,908,160 | 108,947,520 |
| Size | 613.1 MB | 103.9 MB |
| Events in quadrant A | 4,178,693 | 703,378 |
| Events in quadrant B | 4,051,210 | 714,874 |
| Events in quadrant C | 3,813,901 | 679,234 |
| Events in quadrant D | 6,886,556 | 647,562 |
| Mode M0 | |||
|---|---|---|---|
| Quadrant | BADHDUFLAG | Total packets | Discarded packets |
| A | 0 | 17798 | 2 |
| B | 0 | 17318 | 2 |
| C | 0 | 16648 | 3 |
| D | 0 | 25838 | 2 |
| Mode M9 | |||
|---|---|---|---|
| Quadrant | BADHDUFLAG | Total packets | Discarded packets |
| A | 0 | 6 | 0 |
| B | 0 | 6 | 0 |
| C | 0 | 6 | 0 |
| D | 0 | 6 | 0 |
| Mode SS | |||
|---|---|---|---|
| Quadrant | BADHDUFLAG | Total packets | Discarded packets |
| A | 0 | 164 | 0 |
| B | 0 | 164 | 0 |
| C | 0 | 164 | 0 |
| D | 0 | 164 | 0 |
| Quadrant | Total seconds | Saturated seconds | Saturation percentage |
|---|---|---|---|
| A | 7978 | 236 | 2.958135% |
| B | 7979 | 121 | 1.516481% |
| C | 7978 | 113 | 1.416395% |
| D | 7978 | 689 | 8.636250% |
Noise dominated data is calculated using 1-second bins in cleaned event files. If a bin has >2000 counts, and if more than 50% of those come from <1% of pixels, then it is considered to be noise-dominated and hence unusable.
| Quadrant | # 1 sec bins | Bins with >0 counts | Bins with >2000 counts | High rate bins dominated by noise | Noise dominated (total time) | Noise dominated (detector-on time) | Marked lightcurve |
|---|---|---|---|---|---|---|---|
| A | 8528 | 7981 | 54 | 54 | 0.63% | 0.68% | 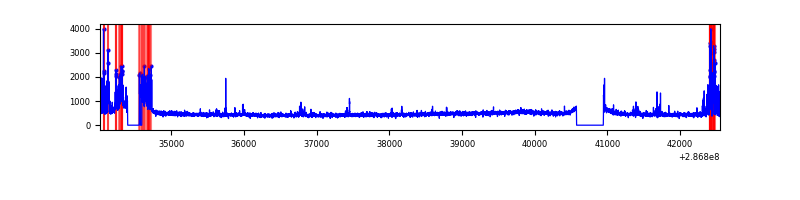 |
| B | 8529 | 7982 | 17 | 17 | 0.20% | 0.21% | 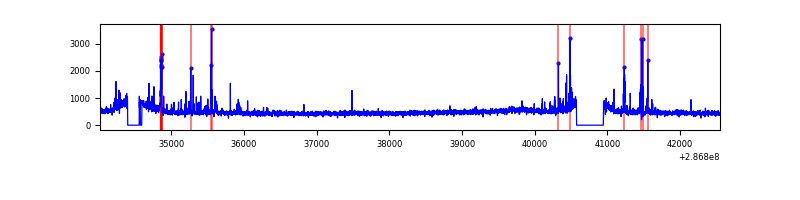 |
| C | 8528 | 7981 | 7 | 7 | 0.08% | 0.09% | 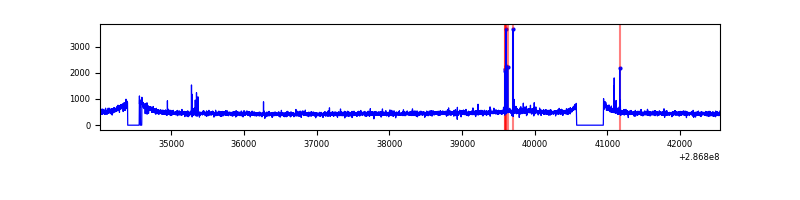 |
| D | 8528 | 7980 | 552 | 552 | 6.47% | 6.92% | 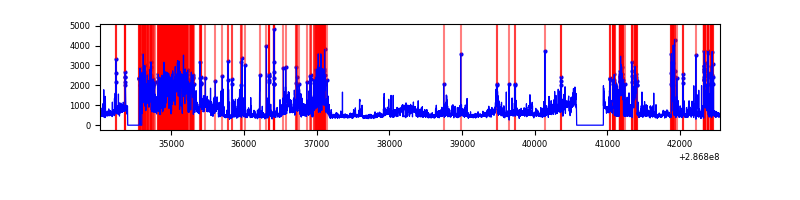 |
Top three noisy pixels from each quadrant. If the there are fewer than three noisy pixels in the level2.evt file, extra rows are filled as -1
| Pixel properties | Quadrant properties | ||||||
|---|---|---|---|---|---|---|---|
| Quadrant | DetID | PixID | Counts | Sigma | Mean | Median | Sigma |
| A | 4 | 2 | 484036 | 2470.1 | 956 | 933 | 195.6 |
| A | 15 | 174 | 16278 | 78.46 | 956 | 933 | 195.6 |
| A | 0 | 226 | 8328 | 37.81 | 956 | 933 | 195.6 |
| B | 7 | 220 | 89922 | 479.36 | 960 | 934 | 185.6 |
| B | 5 | 172 | 54408 | 288.05 | 960 | 934 | 185.6 |
| B | 0 | 197 | 54006 | 285.89 | 960 | 934 | 185.6 |
| C | 14 | 238 | 140652 | 645.6 | 923 | 928 | 216.4 |
| C | 0 | 207 | 53493 | 242.88 | 923 | 928 | 216.4 |
| C | 3 | 233 | 16121 | 70.2 | 923 | 928 | 216.4 |
| D | 7 | 238 | 2422212 | 10766.73 | 917 | 889 | 224.9 |
| D | 13 | 104 | 260406 | 1153.98 | 917 | 889 | 224.9 |
| D | 1 | 52 | 177690 | 786.17 | 917 | 889 | 224.9 |
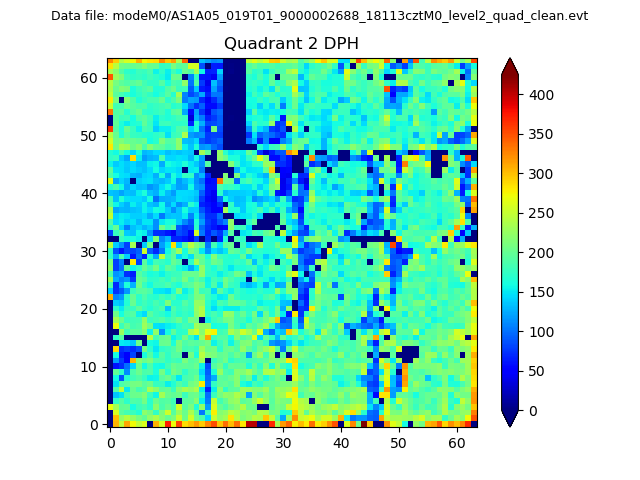
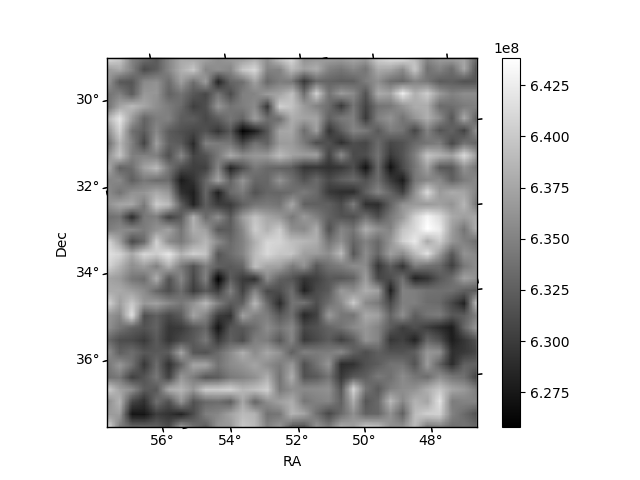
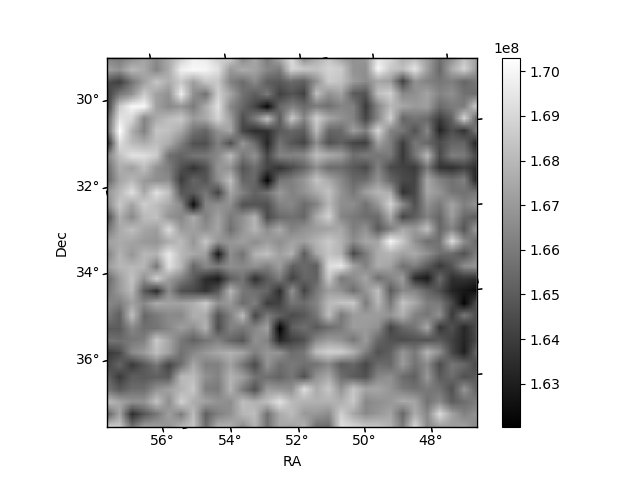
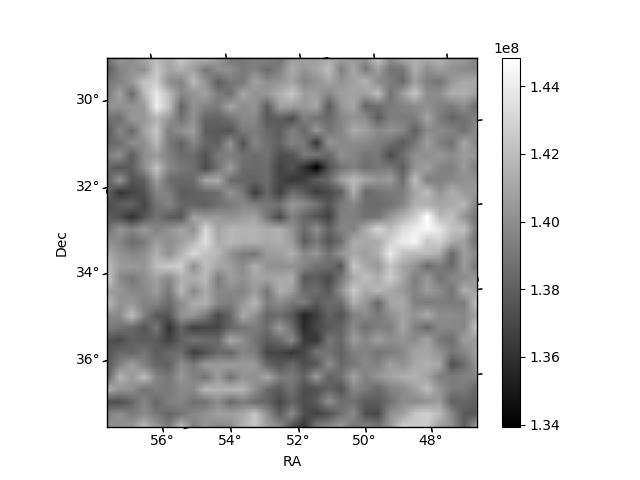
Histogram calculated using DETX and DETY for each event in the final _common_clean file
| Quadrant A | 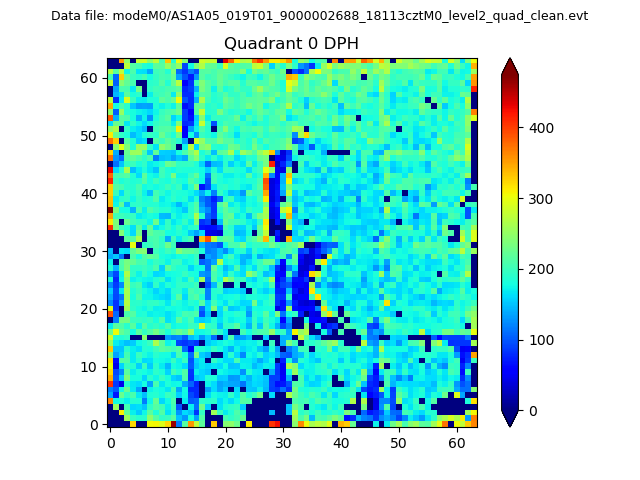 |
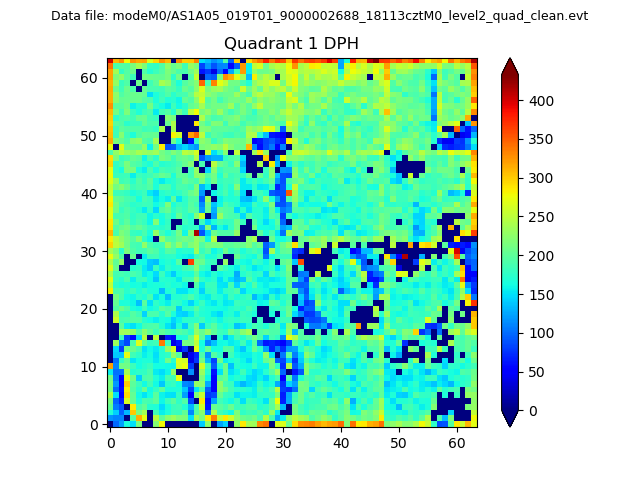 |
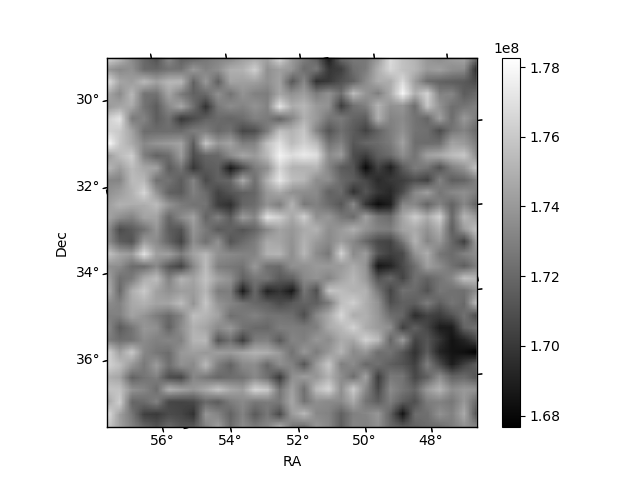
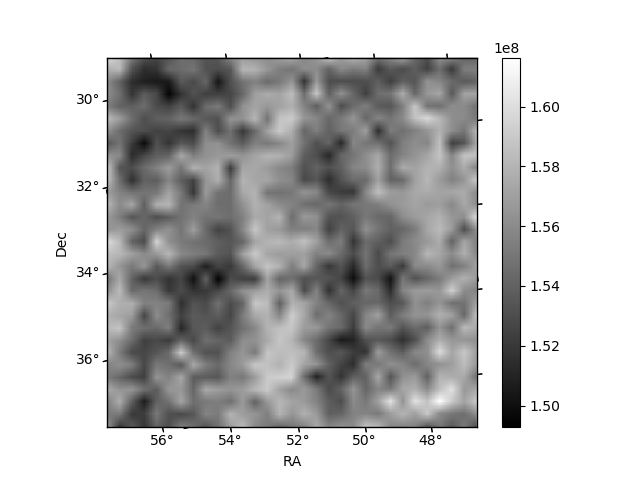
Quadrant B |
|---|---|---|---|
| Quadrant D | 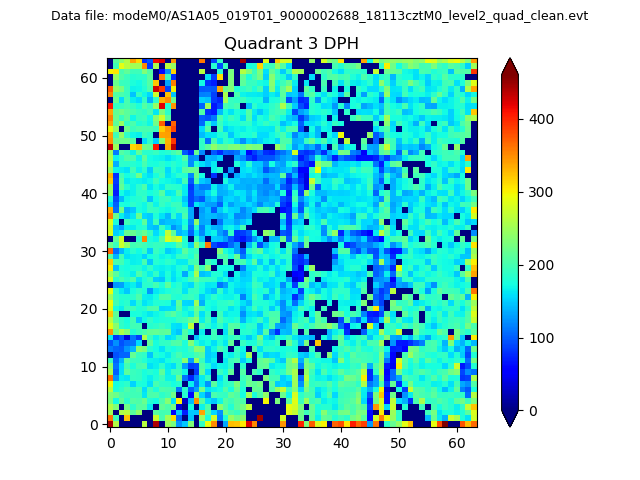 |
 |
Quadrant C |
| Plot type | Count rate plots | Images |
|---|---|---|
| Comparison with Poisson distribution Blue bars denote a histogram of data divided into 1 sec bins. Red curve is a Poisson curve with rate = median count rate of data. |
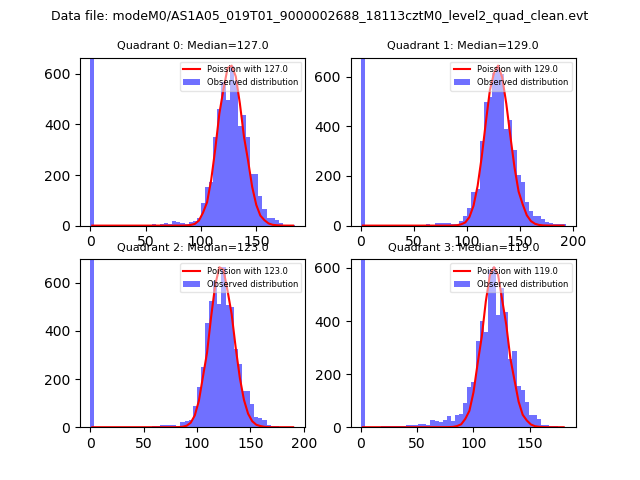 |
 |
| Quadrant-wise count rates Data is divided into 100 sec bins |
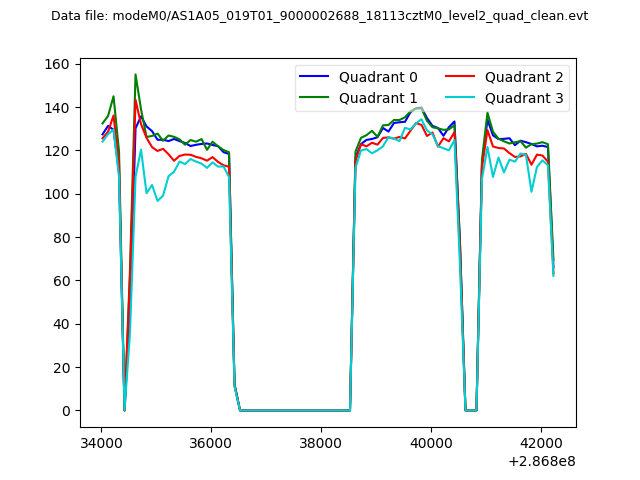 |
|
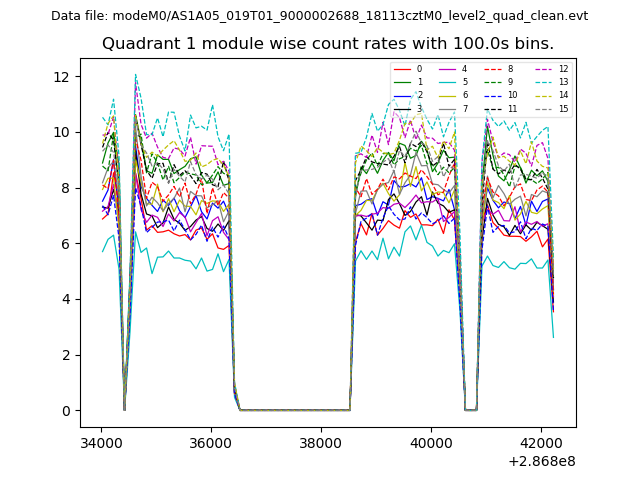
| Module-wise count rates for Quadrant A Data is divided into 100 sec bins |
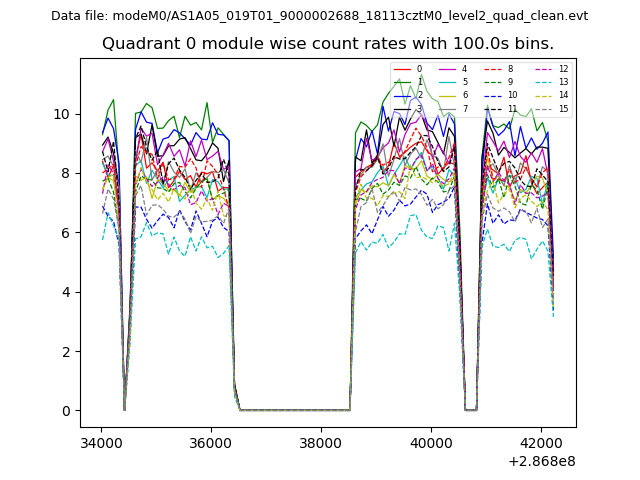 |
 |
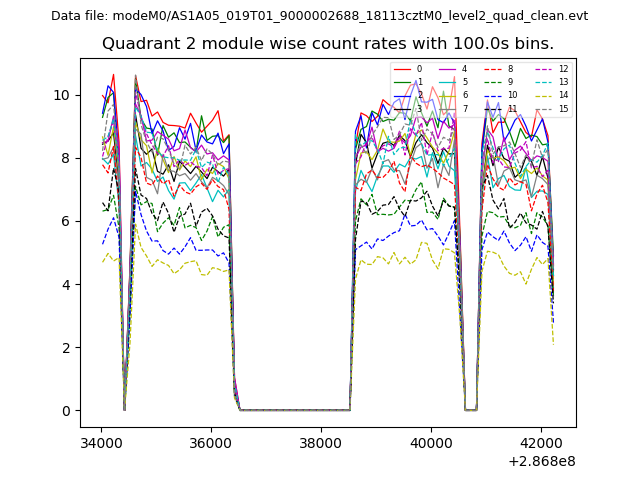
| Module-wise count rates for Quadrant B Data is divided into 100 sec bins |
 |
 |
| Module-wise count rates for Quadrant C Data is divided into 100 sec bins |
 |
 |
| Module-wise count rates for Quadrant D Data is divided into 100 sec bins |
 |
 |
| Parameter | Plot |
|---|---|
| CZT HV Monitor | 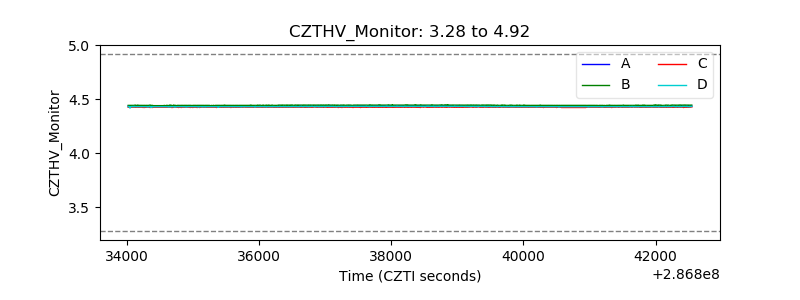 |
| D_VDD | 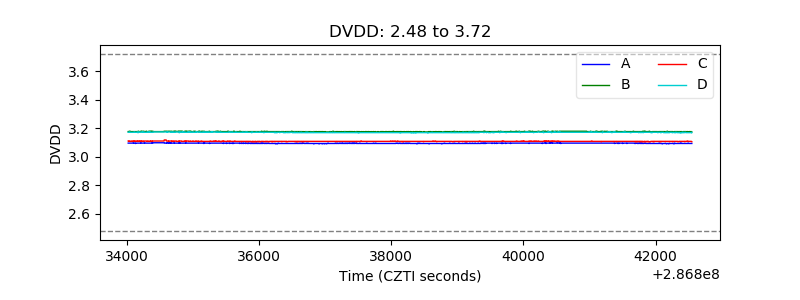 |
| Temperature 1 | 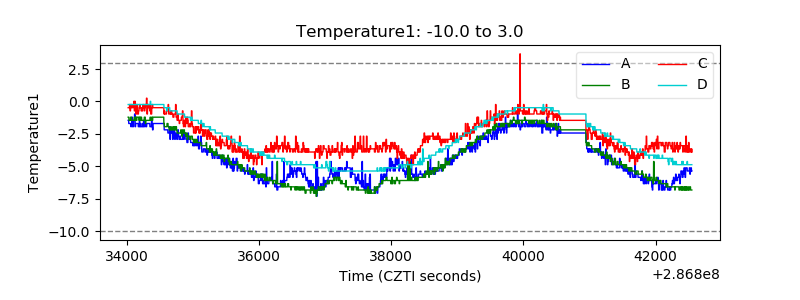 |
| Veto HV Monitor | 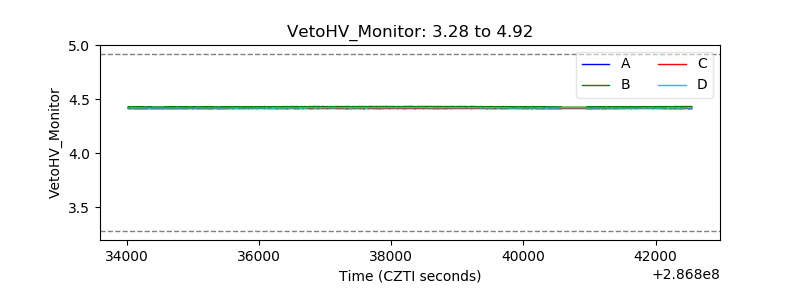 |
| Veto LLD | 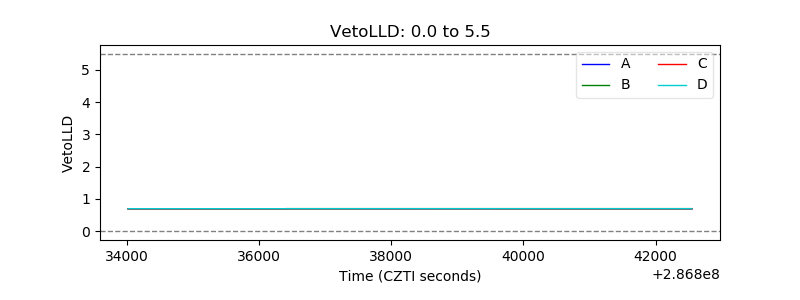 |
| Alpha Counter | 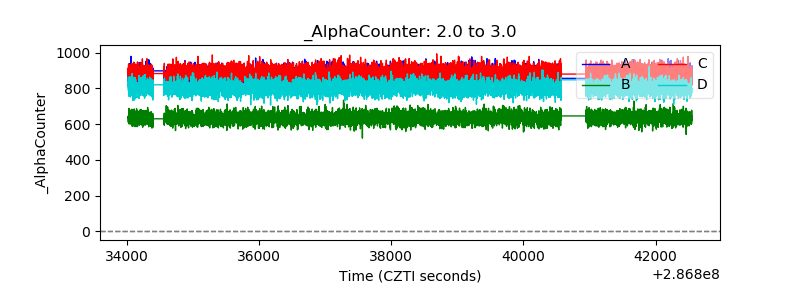 |
| _CPM_Rate | 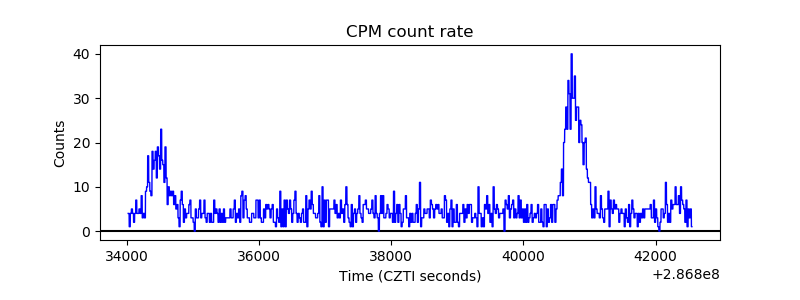 |
| CZT Counter | 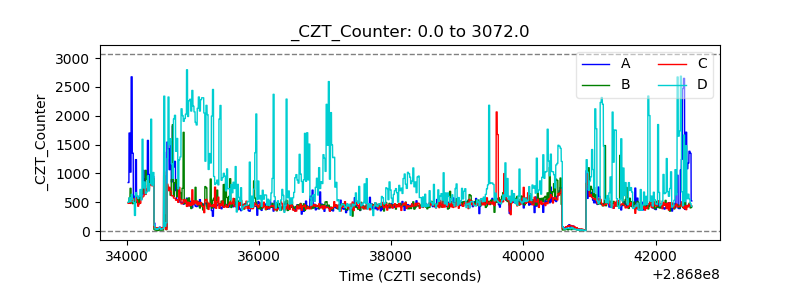 |
| +2.5 Volts monitor | 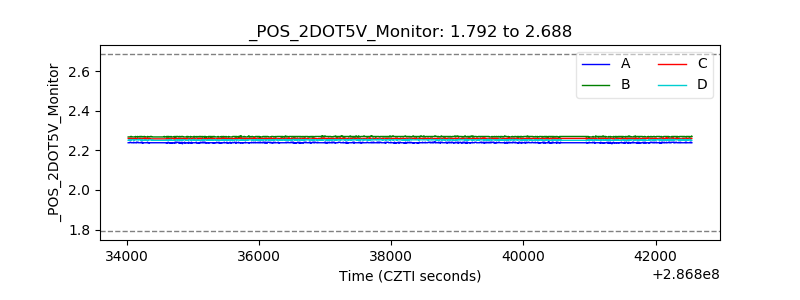 |
| +5 Volts monitor | 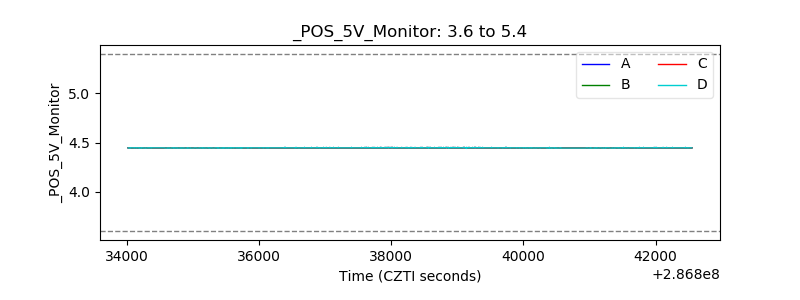 |
| _ROLL_ROT | 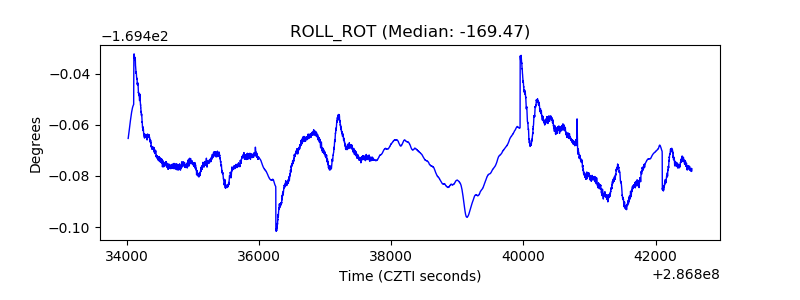 |
| _Roll_DEC | 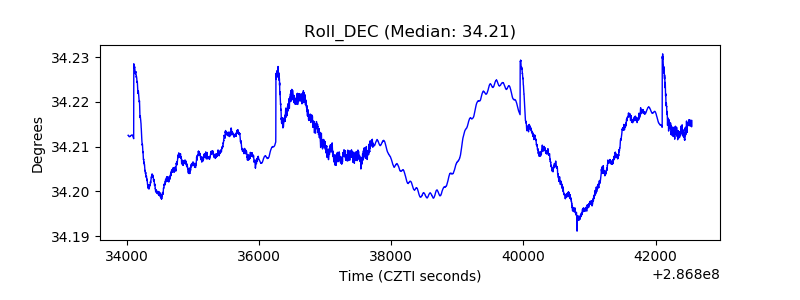 |
| _Roll_RA | 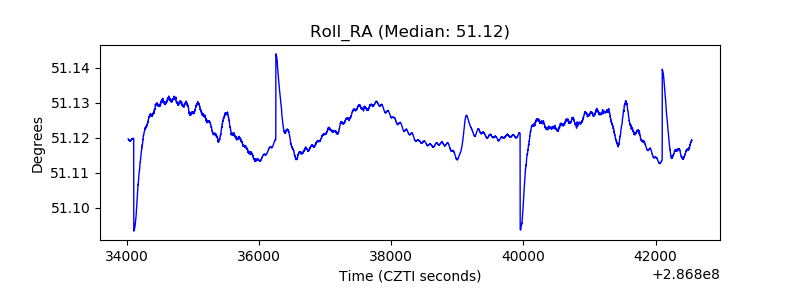 |
| Veto Counter | 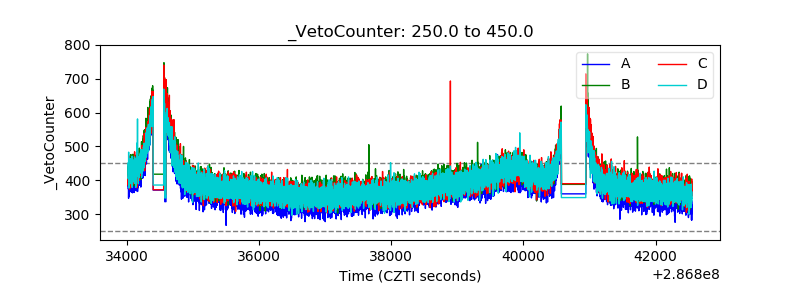 |