| Param | Original file | Final file |
|---|---|---|
| Filename | modeM0/AS1A05_019T01_9000002688_18115cztM0_level2.evt | modeM0/AS1A05_019T01_9000002688_18115cztM0_level2_quad_clean.evt |
| Size (bytes) | 975,827,520 | 162,264,960 |
| Size | 930.6 MB | 154.7 MB |
| Events in quadrant A | 6,579,234 | 1,023,619 |
| Events in quadrant B | 6,545,732 | 1,033,987 |
| Events in quadrant C | 6,377,849 | 985,465 |
| Events in quadrant D | 9,133,126 | 934,849 |
| Mode M0 | |||
|---|---|---|---|
| Quadrant | BADHDUFLAG | Total packets | Discarded packets |
| A | 0 | 28546 | 3 |
| B | 0 | 28237 | 3 |
| C | 0 | 27778 | 3 |
| D | 0 | 36311 | 3 |
| Mode M9 | |||
|---|---|---|---|
| Quadrant | BADHDUFLAG | Total packets | Discarded packets |
| A | 0 | 18 | 0 |
| B | 0 | 18 | 0 |
| C | 0 | 18 | 0 |
| D | 0 | 18 | 0 |
| Mode SS | |||
|---|---|---|---|
| Quadrant | BADHDUFLAG | Total packets | Discarded packets |
| A | 0 | 274 | 0 |
| B | 0 | 274 | 0 |
| C | 0 | 274 | 0 |
| D | 0 | 274 | 0 |
| Quadrant | Total seconds | Saturated seconds | Saturation percentage |
|---|---|---|---|
| A | 13563 | 101 | 0.744673% |
| B | 13564 | 109 | 0.803598% |
| C | 13564 | 114 | 0.840460% |
| D | 13563 | 711 | 5.242203% |
Noise dominated data is calculated using 1-second bins in cleaned event files. If a bin has >2000 counts, and if more than 50% of those come from <1% of pixels, then it is considered to be noise-dominated and hence unusable.
| Quadrant | # 1 sec bins | Bins with >0 counts | Bins with >2000 counts | High rate bins dominated by noise | Noise dominated (total time) | Noise dominated (detector-on time) | Marked lightcurve |
|---|---|---|---|---|---|---|---|
| A | 15213 | 13566 | 28 | 28 | 0.18% | 0.21% | 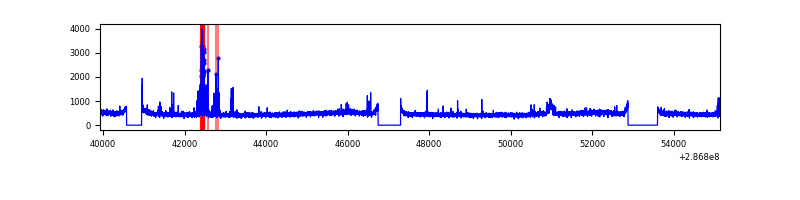 |
| B | 15214 | 13567 | 11 | 11 | 0.07% | 0.08% | 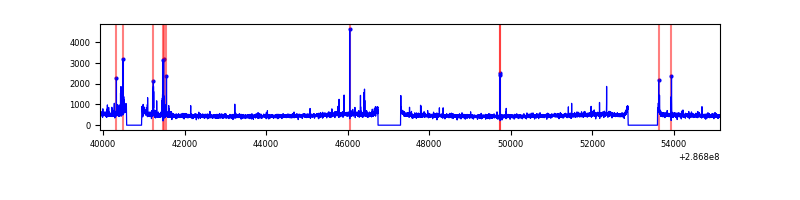 |
| C | 15214 | 13567 | 5 | 5 | 0.03% | 0.04% | 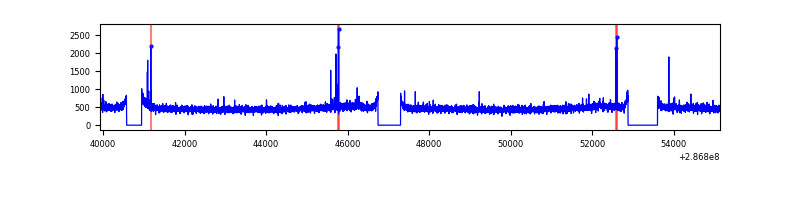 |
| D | 15213 | 13566 | 541 | 541 | 3.56% | 3.99% | 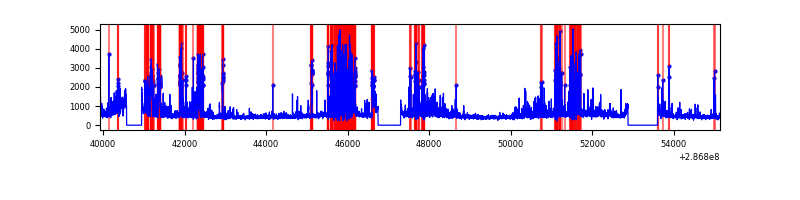 |
Top three noisy pixels from each quadrant. If the there are fewer than three noisy pixels in the level2.evt file, extra rows are filled as -1
| Pixel properties | Quadrant properties | ||||||
|---|---|---|---|---|---|---|---|
| Quadrant | DetID | PixID | Counts | Sigma | Mean | Median | Sigma |
| A | 4 | 2 | 271012 | 823.79 | 1618 | 1579 | 327.1 |
| A | 15 | 174 | 88246 | 264.98 | 1618 | 1579 | 327.1 |
| A | 0 | 226 | 13891 | 37.64 | 1618 | 1579 | 327.1 |
| B | 7 | 220 | 61324 | 191.96 | 1618 | 1573 | 311.3 |
| B | 0 | 197 | 48319 | 150.18 | 1618 | 1573 | 311.3 |
| B | 12 | 111 | 37575 | 115.66 | 1618 | 1573 | 311.3 |
| C | 14 | 238 | 239722 | 654.03 | 1553 | 1558 | 364.1 |
| C | 0 | 207 | 43168 | 114.27 | 1553 | 1558 | 364.1 |
| C | 3 | 233 | 14526 | 35.61 | 1553 | 1558 | 364.1 |
| D | 7 | 238 | 2245142 | 6013.74 | 1541 | 1498 | 373.1 |
| D | 1 | 52 | 316134 | 843.33 | 1541 | 1498 | 373.1 |
| D | 10 | 70 | 263155 | 701.33 | 1541 | 1498 | 373.1 |
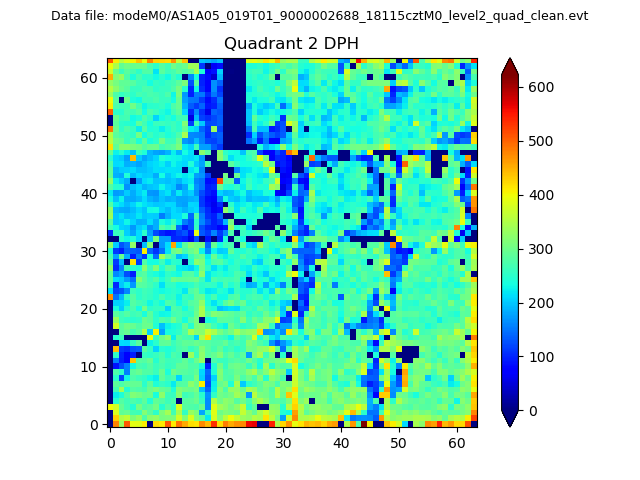
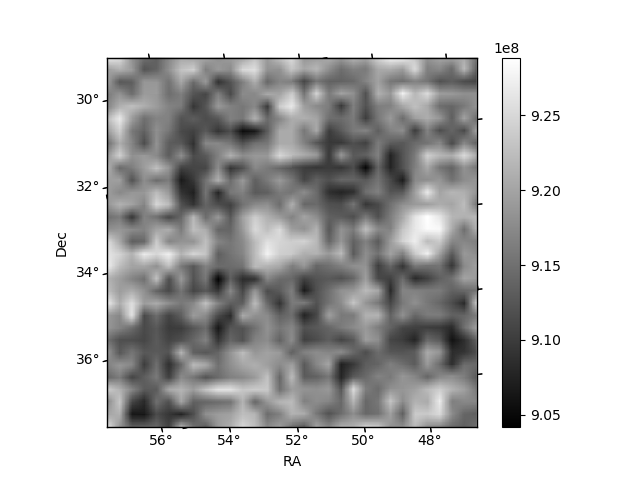
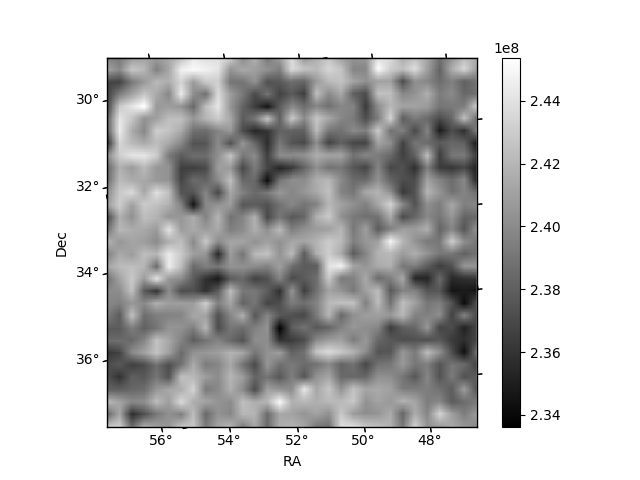
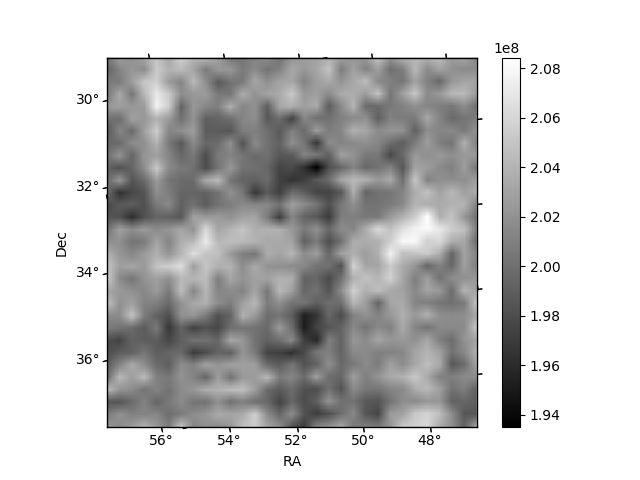
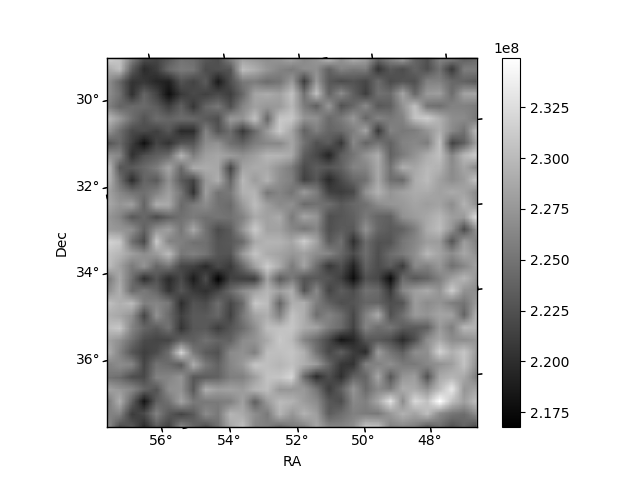
Histogram calculated using DETX and DETY for each event in the final _common_clean file
| Quadrant A | 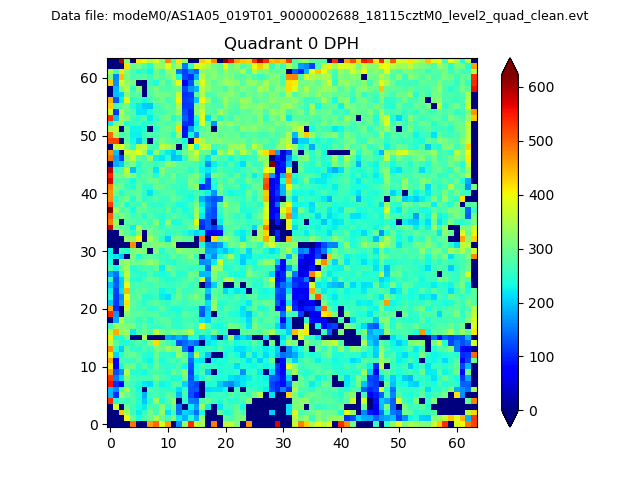 |
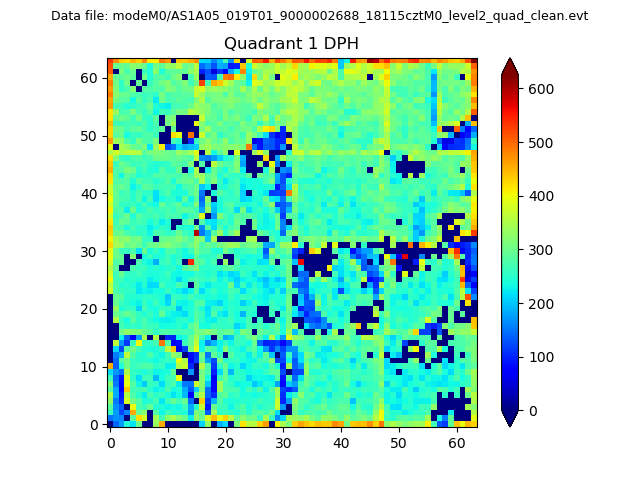 |
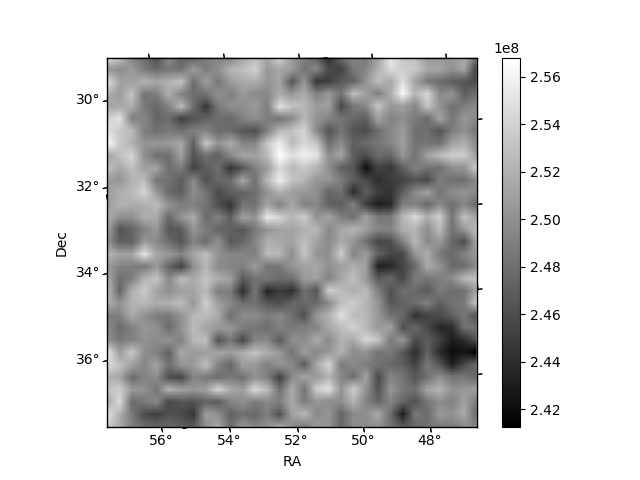
Quadrant B |
|---|---|---|---|
| Quadrant D | 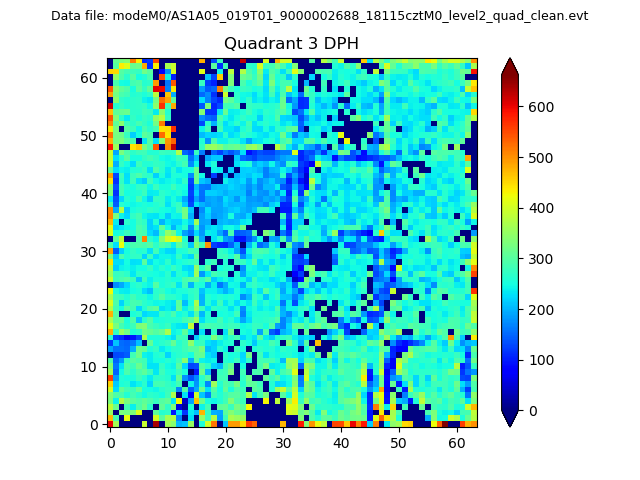 |
 |
Quadrant C |
| Plot type | Count rate plots | Images |
|---|---|---|
| Comparison with Poisson distribution Blue bars denote a histogram of data divided into 1 sec bins. Red curve is a Poisson curve with rate = median count rate of data. |
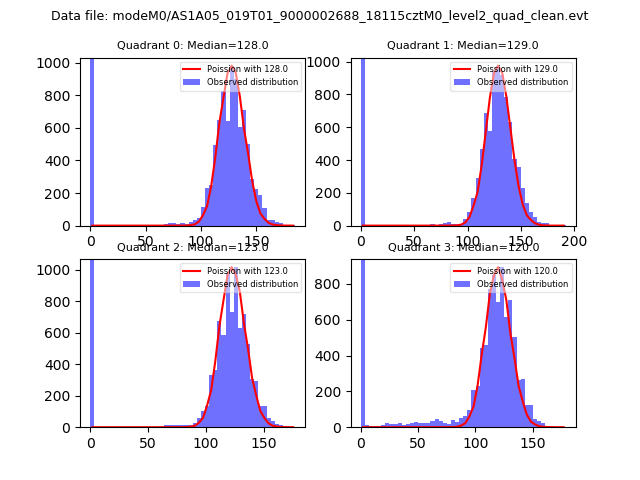 |
 |
| Quadrant-wise count rates Data is divided into 100 sec bins |
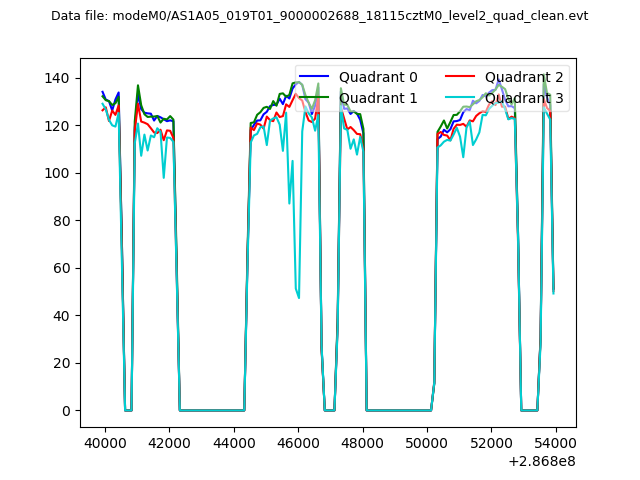 |
|
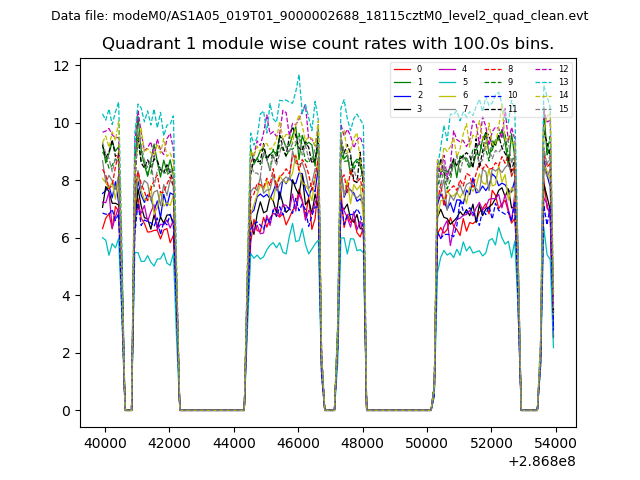
| Module-wise count rates for Quadrant A Data is divided into 100 sec bins |
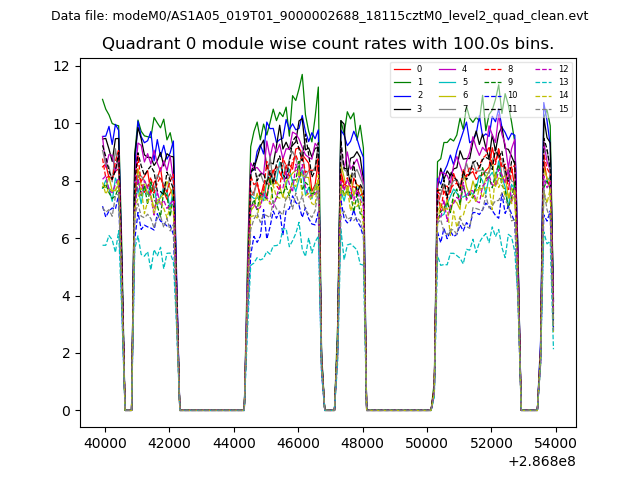 |
 |
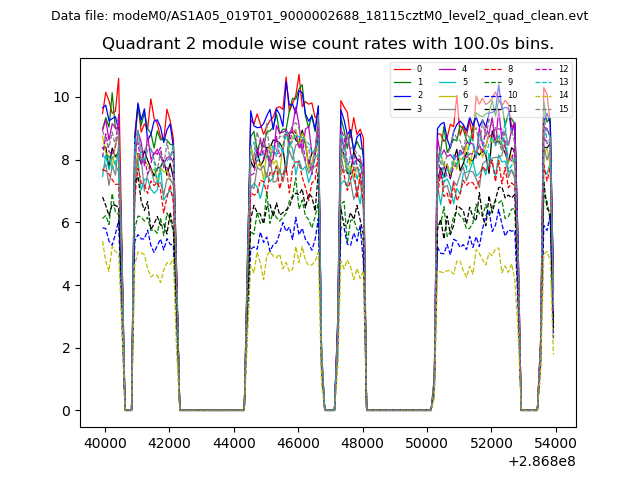
| Module-wise count rates for Quadrant B Data is divided into 100 sec bins |
 |
 |
| Module-wise count rates for Quadrant C Data is divided into 100 sec bins |
 |
 |
| Module-wise count rates for Quadrant D Data is divided into 100 sec bins |
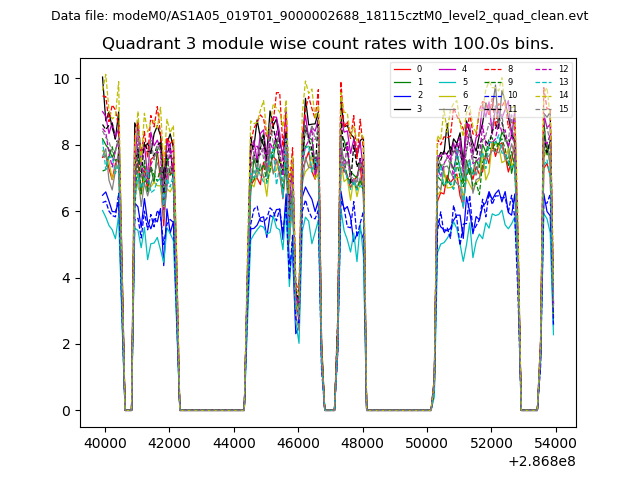 |
 |
| Parameter | Plot |
|---|---|
| CZT HV Monitor | 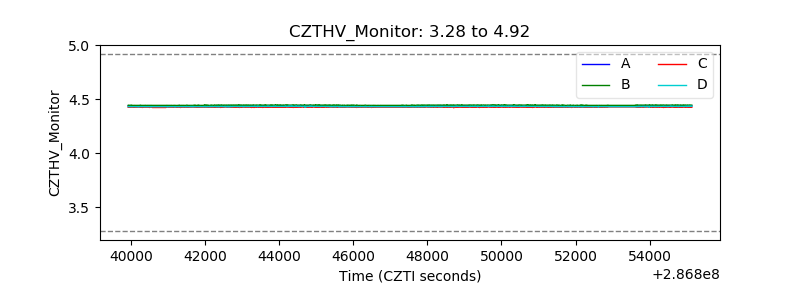 |
| D_VDD | 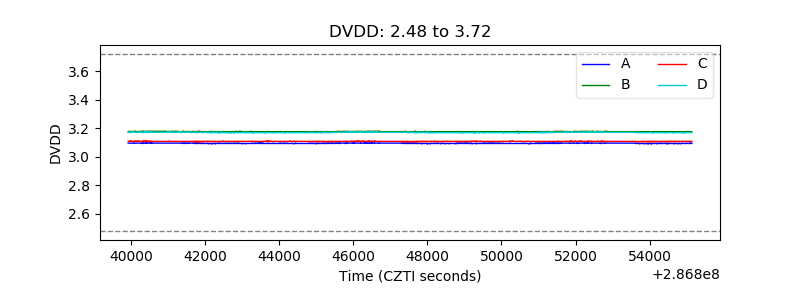 |
| Temperature 1 | 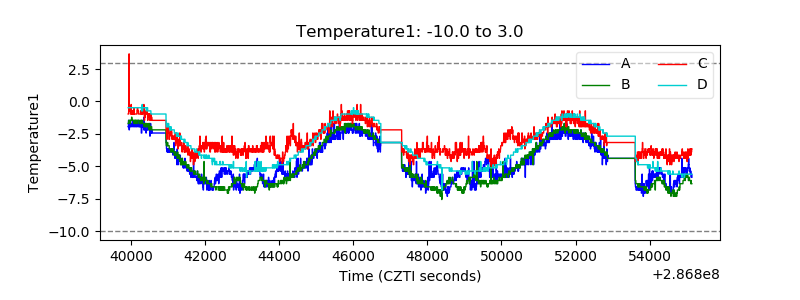 |
| Veto HV Monitor | 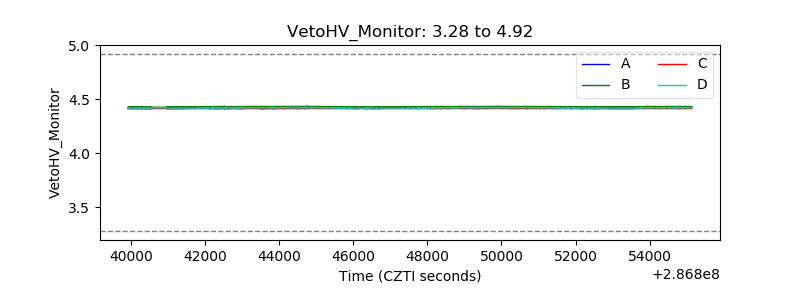 |
| Veto LLD | 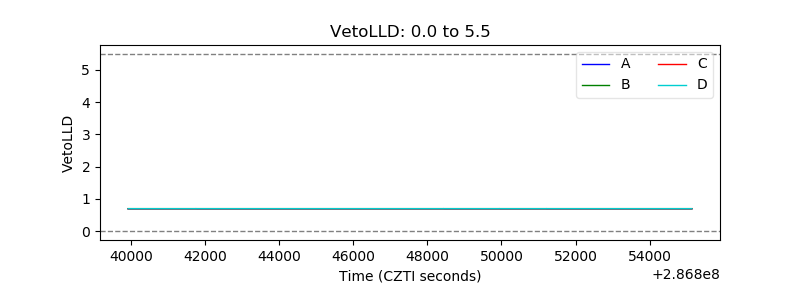 |
| Alpha Counter | 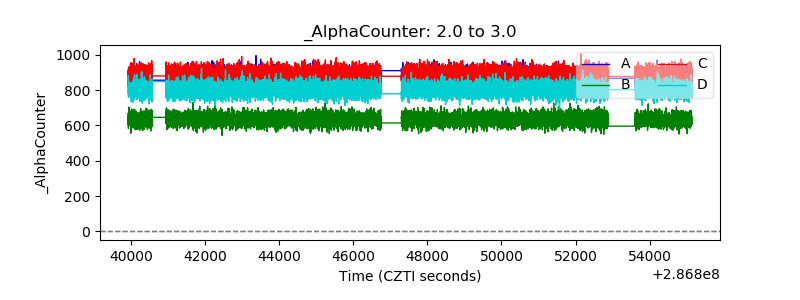 |
| _CPM_Rate | 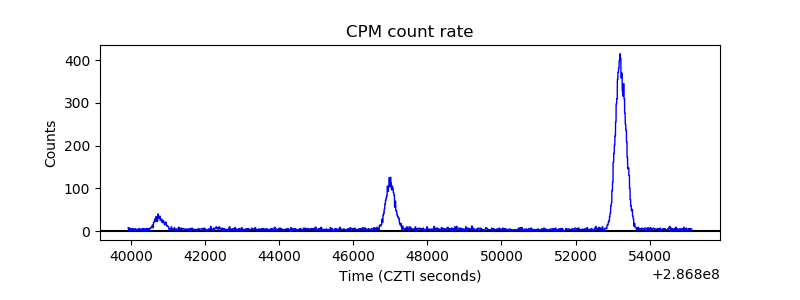 |
| CZT Counter | 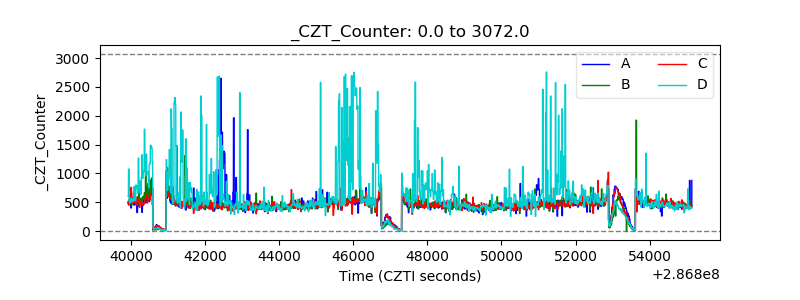 |
| +2.5 Volts monitor | 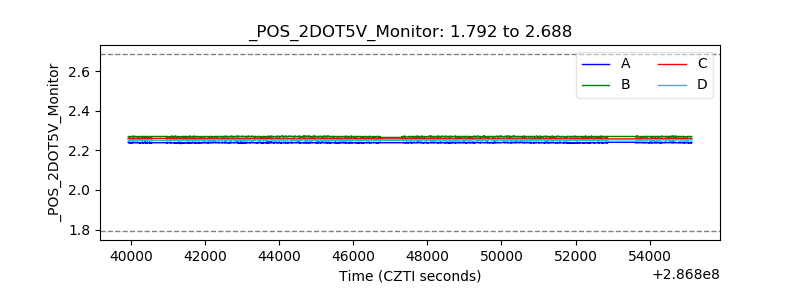 |
| +5 Volts monitor | 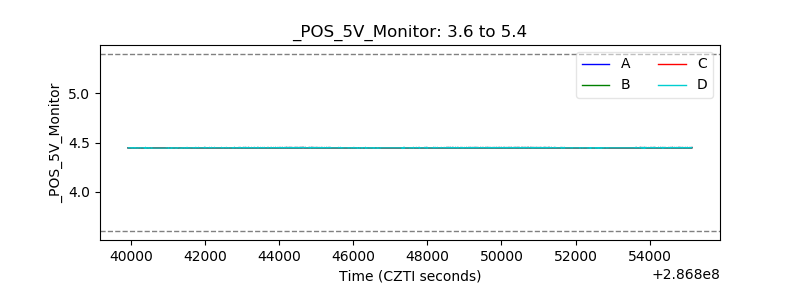 |
| _ROLL_ROT | 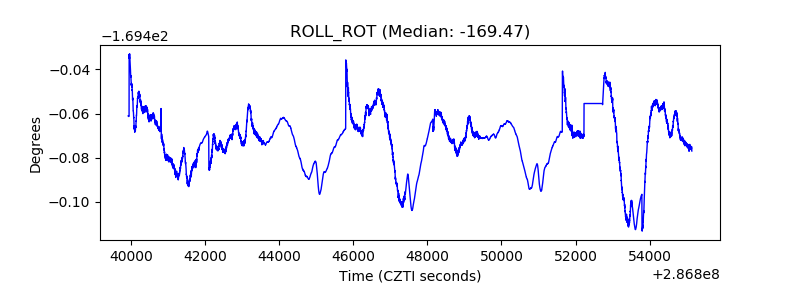 |
| _Roll_DEC | 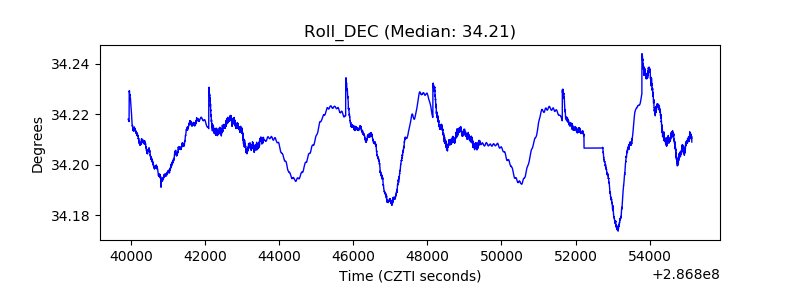 |
| _Roll_RA | 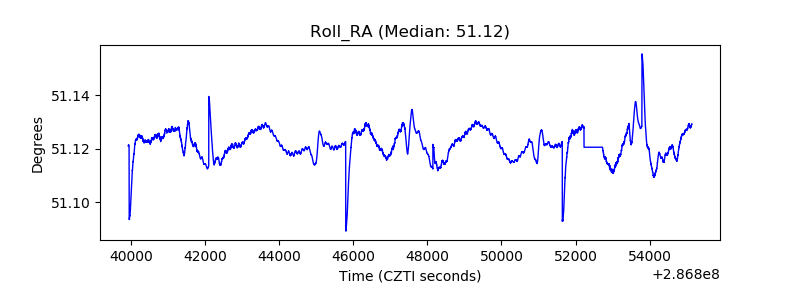 |
| Veto Counter | 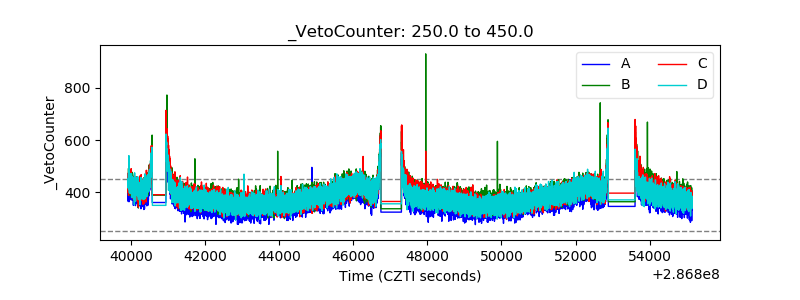 |