| Param | Original file | Final file |
|---|---|---|
| Filename | modeM0/AS1A05_019T01_9000002688_18117cztM0_level2.evt | modeM0/AS1A05_019T01_9000002688_18117cztM0_level2_quad_clean.evt |
| Size (bytes) | 551,338,560 | 74,004,480 |
| Size | 525.8 MB | 70.6 MB |
| Events in quadrant A | 3,380,606 | 462,777 |
| Events in quadrant B | 3,470,339 | 466,745 |
| Events in quadrant C | 3,401,291 | 443,586 |
| Events in quadrant D | 5,972,665 | 382,320 |
| Mode M0 | |||
|---|---|---|---|
| Quadrant | BADHDUFLAG | Total packets | Discarded packets |
| A | 0 | 14393 | 2 |
| B | 0 | 14579 | 2 |
| C | 0 | 14430 | 2 |
| D | 0 | 22287 | 2 |
| Mode M9 | |||
|---|---|---|---|
| Quadrant | BADHDUFLAG | Total packets | Discarded packets |
| A | 0 | 19 | 0 |
| B | 0 | 19 | 0 |
| C | 0 | 19 | 0 |
| D | 0 | 19 | 0 |
| Mode SS | |||
|---|---|---|---|
| Quadrant | BADHDUFLAG | Total packets | Discarded packets |
| A | 0 | 144 | 0 |
| B | 0 | 144 | 0 |
| C | 0 | 144 | 0 |
| D | 0 | 144 | 0 |
| Quadrant | Total seconds | Saturated seconds | Saturation percentage |
|---|---|---|---|
| A | 6957 | 49 | 0.704327% |
| B | 6958 | 70 | 1.006036% |
| C | 6958 | 82 | 1.178500% |
| D | 6958 | 945 | 13.581489% |
Noise dominated data is calculated using 1-second bins in cleaned event files. If a bin has >2000 counts, and if more than 50% of those come from <1% of pixels, then it is considered to be noise-dominated and hence unusable.
| Quadrant | # 1 sec bins | Bins with >0 counts | Bins with >2000 counts | High rate bins dominated by noise | Noise dominated (total time) | Noise dominated (detector-on time) | Marked lightcurve |
|---|---|---|---|---|---|---|---|
| A | 8882 | 6959 | 1 | 1 | 0.01% | 0.01% | 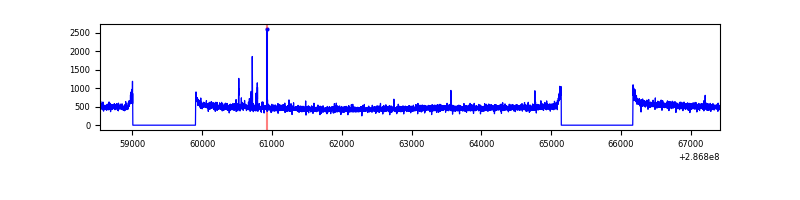 |
| B | 8883 | 6960 | 1 | 1 | 0.01% | 0.01% | 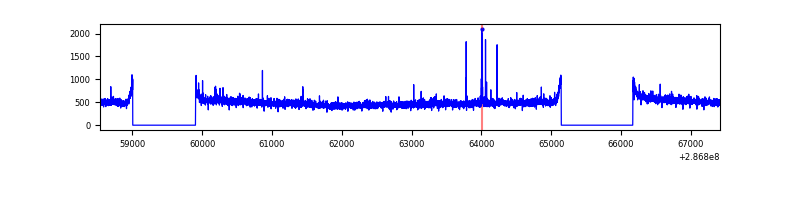 |
| C | 8883 | 6960 | 1 | 1 | 0.01% | 0.01% | 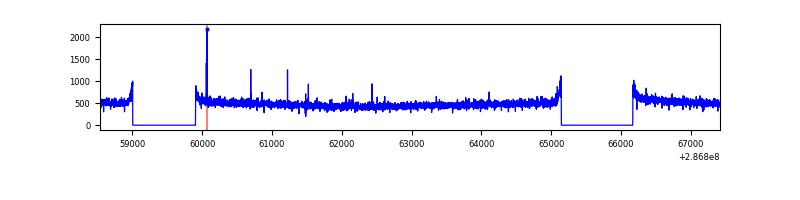 |
| D | 8883 | 6959 | 847 | 847 | 9.54% | 12.17% | 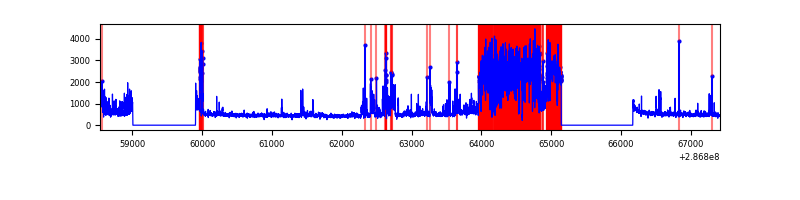 |
Top three noisy pixels from each quadrant. If the there are fewer than three noisy pixels in the level2.evt file, extra rows are filled as -1
| Pixel properties | Quadrant properties | ||||||
|---|---|---|---|---|---|---|---|
| Quadrant | DetID | PixID | Counts | Sigma | Mean | Median | Sigma |
| A | 4 | 2 | 23638 | 129.67 | 873 | 856 | 175.7 |
| A | 0 | 226 | 7662 | 38.74 | 873 | 856 | 175.7 |
| A | 3 | 137 | 6478 | 32.0 | 873 | 856 | 175.7 |
| B | 0 | 190 | 23842 | 136.04 | 873 | 850 | 169.0 |
| B | 12 | 111 | 20024 | 113.45 | 873 | 850 | 169.0 |
| B | 11 | 111 | 17547 | 98.79 | 873 | 850 | 169.0 |
| C | 14 | 238 | 129104 | 655.4 | 831 | 836 | 195.7 |
| C | 9 | 160 | 14196 | 68.26 | 831 | 836 | 195.7 |
| C | 9 | 176 | 10317 | 48.44 | 831 | 836 | 195.7 |
| D | 7 | 238 | 2344240 | 12081.92 | 796 | 772 | 194.0 |
| D | 11 | 176 | 485324 | 2498.14 | 796 | 772 | 194.0 |
| D | 1 | 52 | 45141 | 228.75 | 796 | 772 | 194.0 |
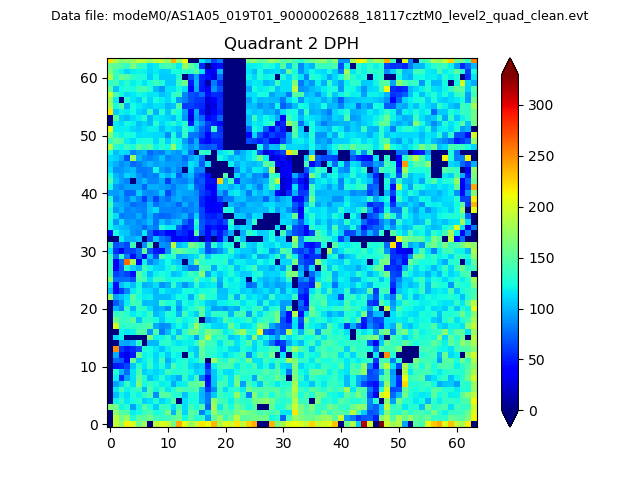
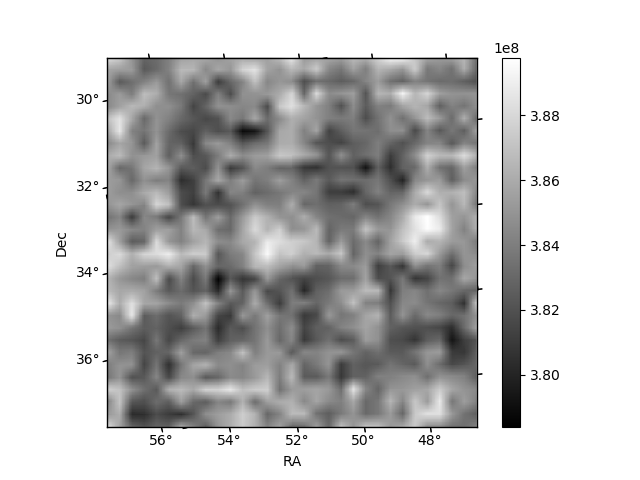
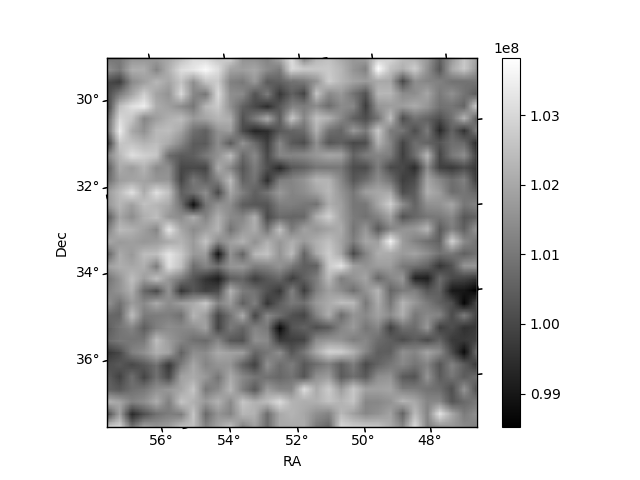
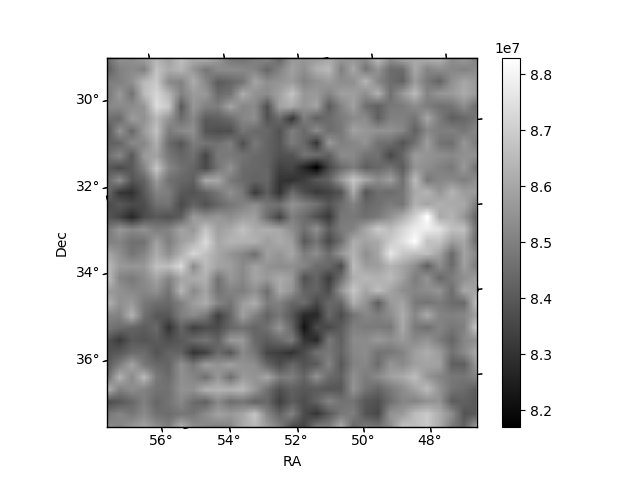
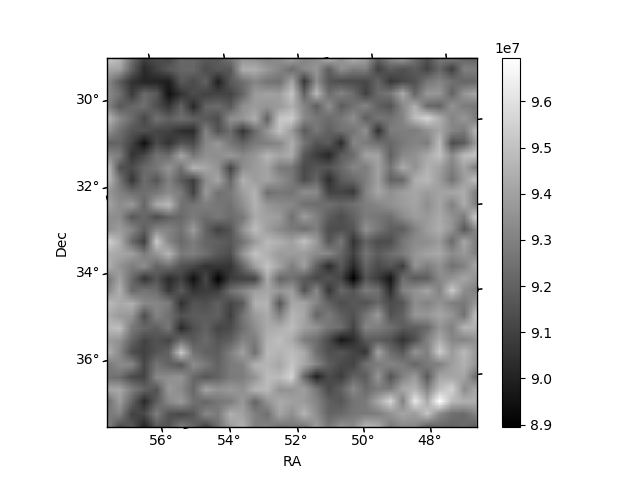
Histogram calculated using DETX and DETY for each event in the final _common_clean file
| Quadrant A | 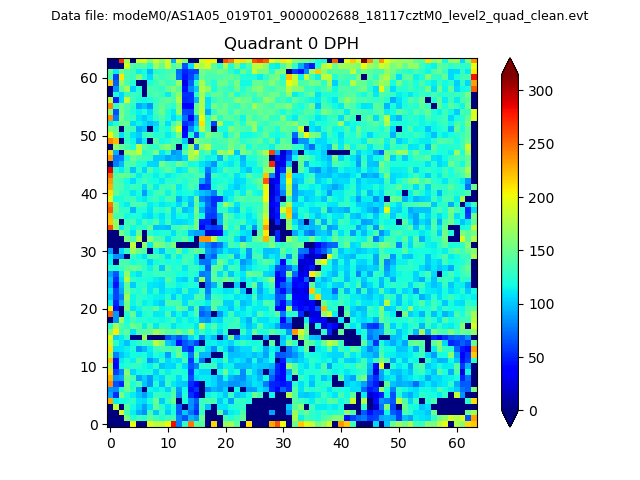 |
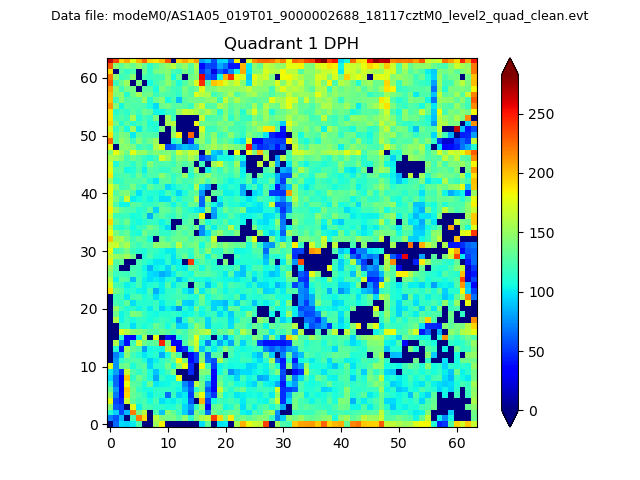 |
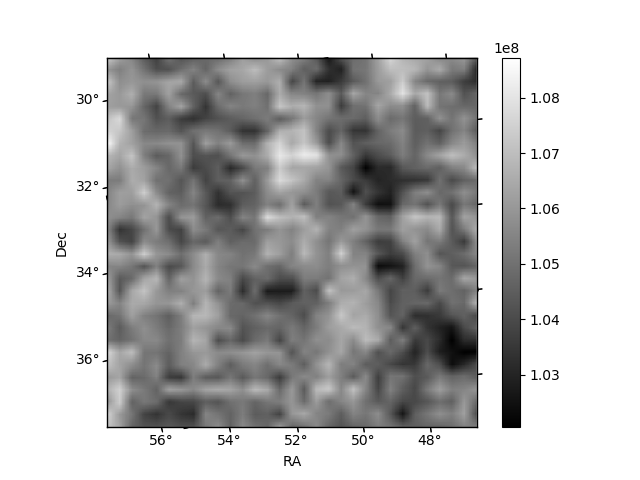
Quadrant B |
|---|---|---|---|
| Quadrant D | 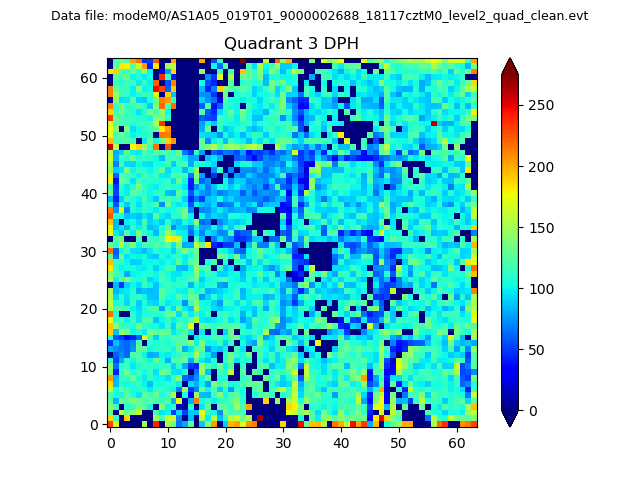 |
 |
Quadrant C |
| Plot type | Count rate plots | Images |
|---|---|---|
| Comparison with Poisson distribution Blue bars denote a histogram of data divided into 1 sec bins. Red curve is a Poisson curve with rate = median count rate of data. |
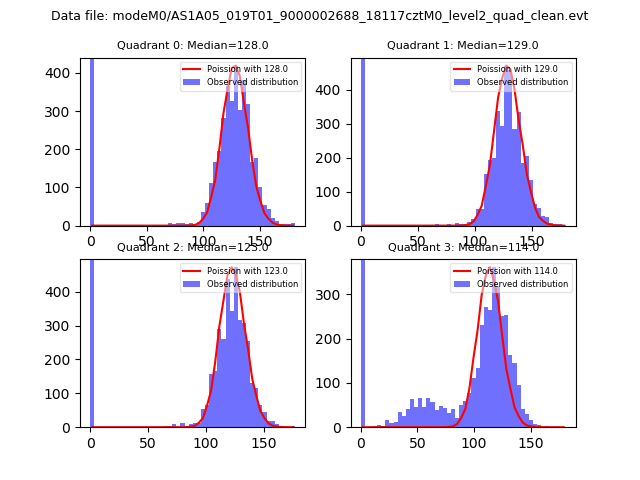 |
 |
| Quadrant-wise count rates Data is divided into 100 sec bins |
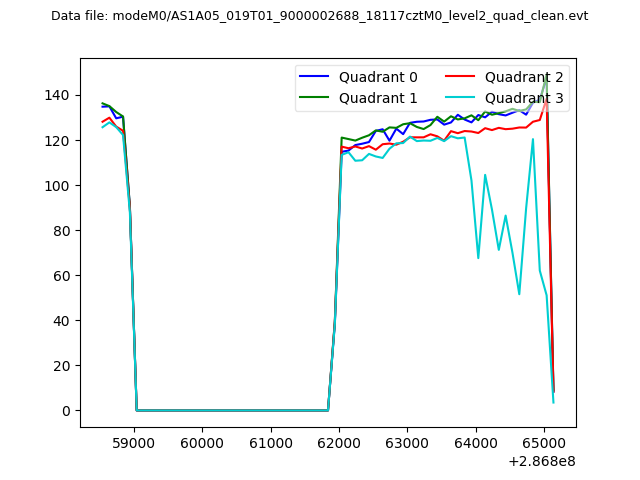 |
|
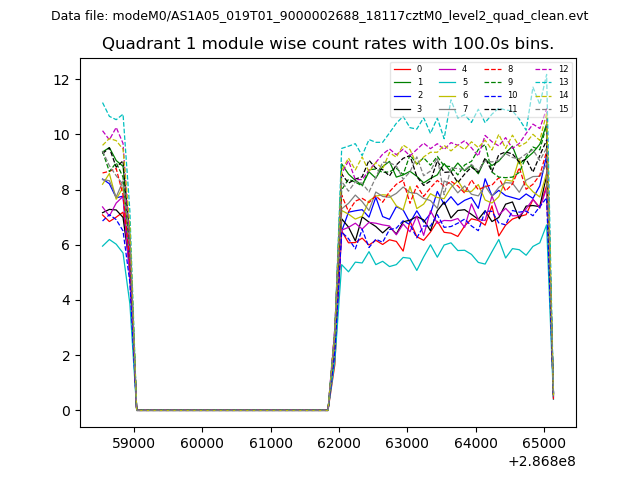
| Module-wise count rates for Quadrant A Data is divided into 100 sec bins |
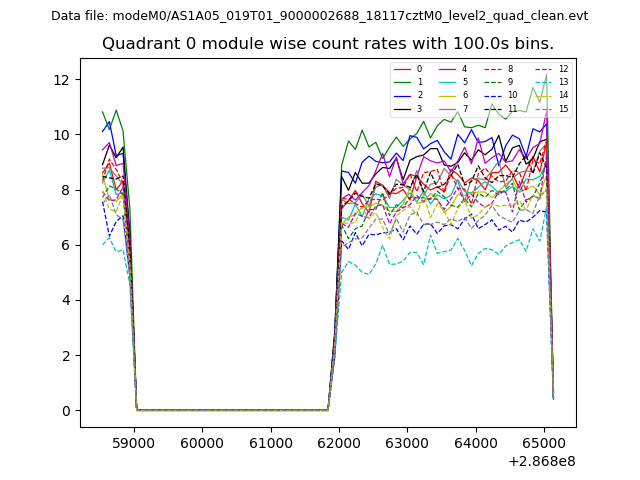 |
 |
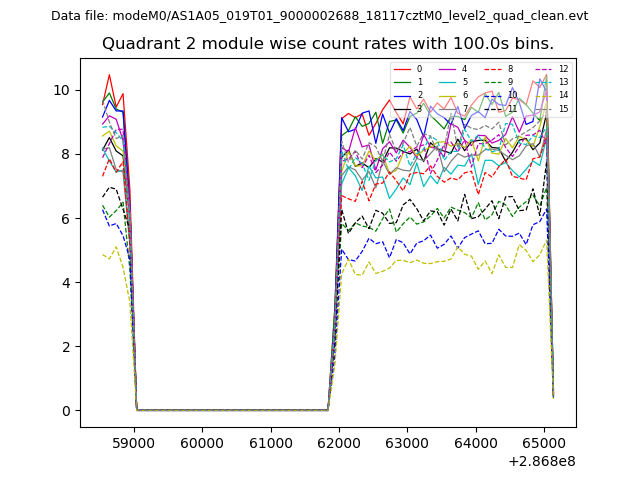
| Module-wise count rates for Quadrant B Data is divided into 100 sec bins |
 |
 |
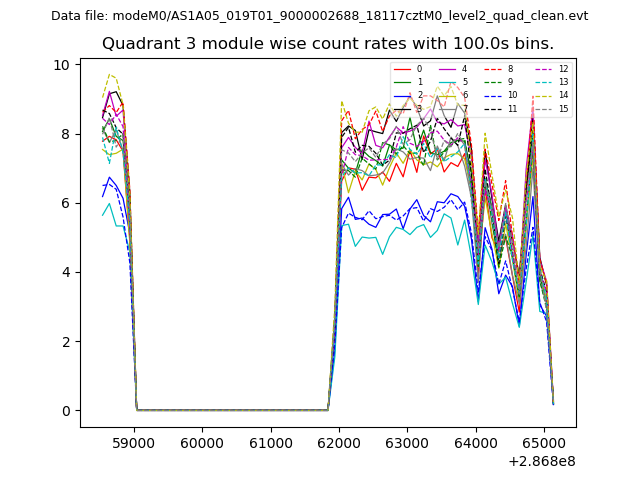
| Module-wise count rates for Quadrant C Data is divided into 100 sec bins |
 |
 |
| Module-wise count rates for Quadrant D Data is divided into 100 sec bins |
 |
 |
| Parameter | Plot |
|---|---|
| CZT HV Monitor | 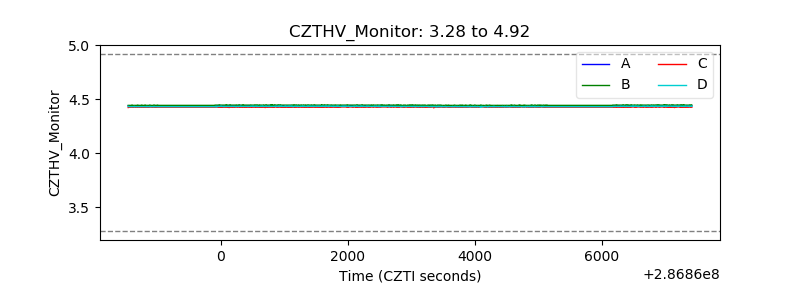 |
| D_VDD | 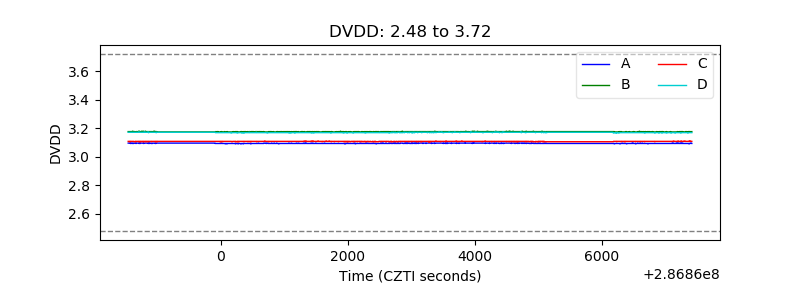 |
| Temperature 1 | 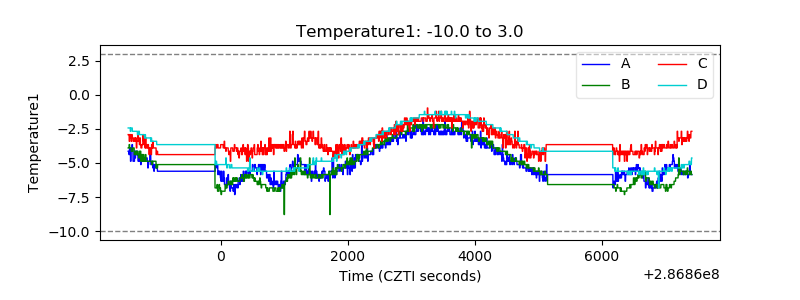 |
| Veto HV Monitor | 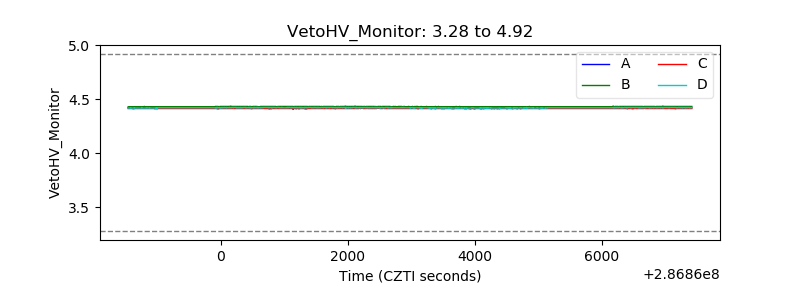 |
| Veto LLD | 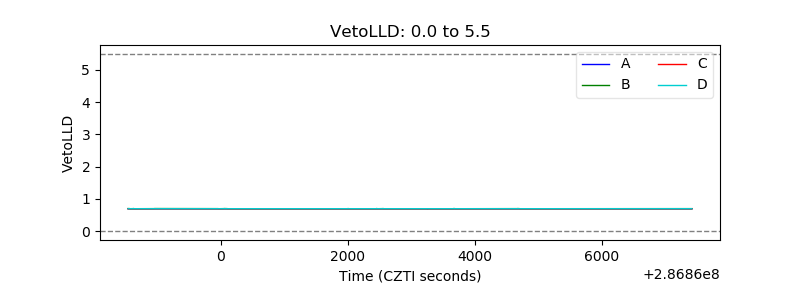 |
| Alpha Counter | 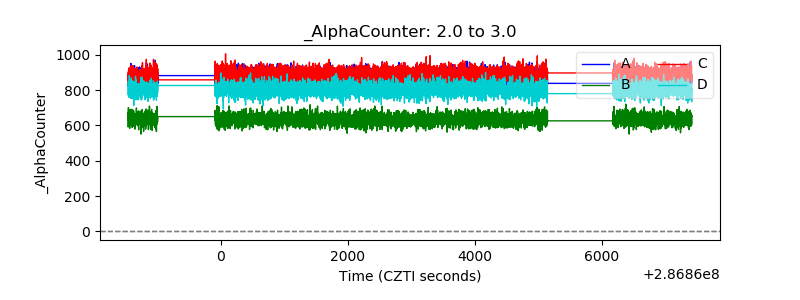 |
| _CPM_Rate | 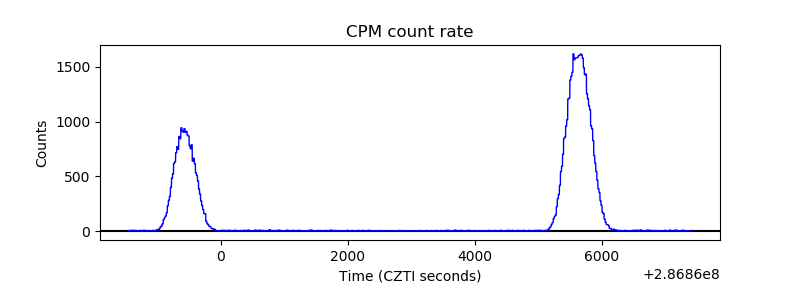 |
| CZT Counter | 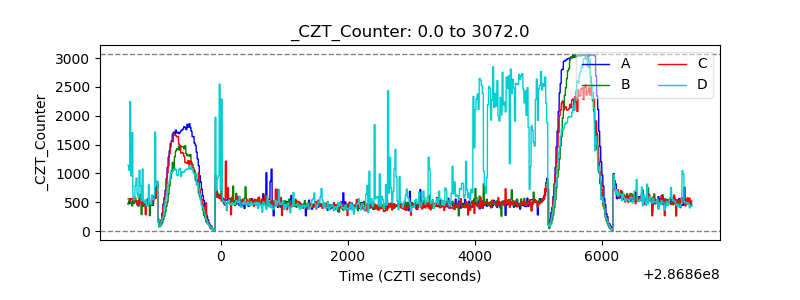 |
| +2.5 Volts monitor |  |
| +5 Volts monitor |  |
| _ROLL_ROT | 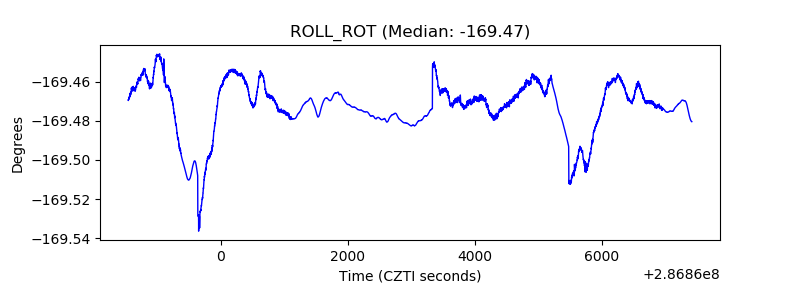 |
| _Roll_DEC | 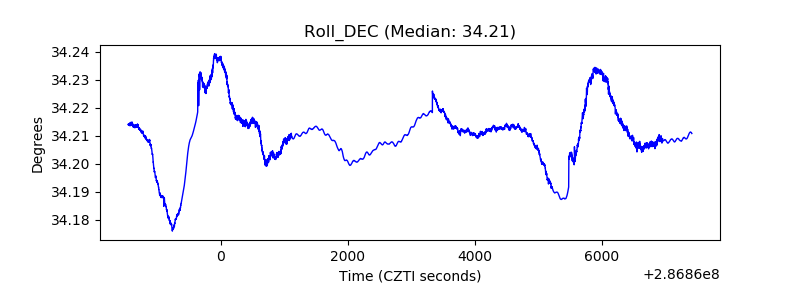 |
| _Roll_RA | 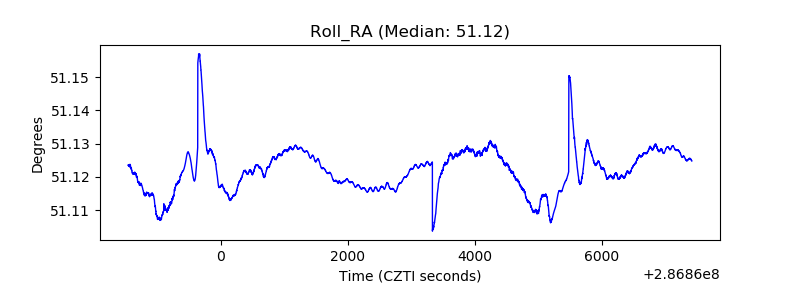 |
| Veto Counter | 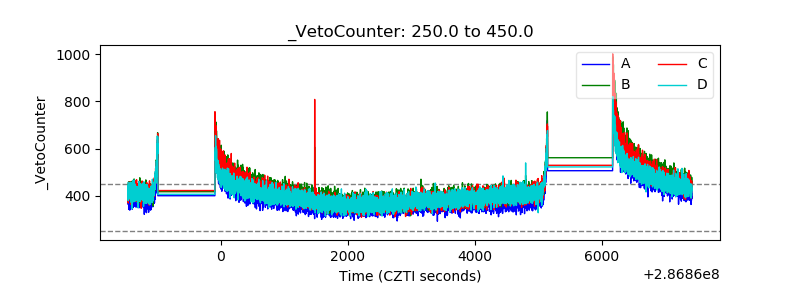 |