| Param | Original file | Final file |
|---|---|---|
| Filename | modeM0/AS1A05_019T01_9000002688_18120cztM0_level2.evt | modeM0/AS1A05_019T01_9000002688_18120cztM0_level2_quad_clean.evt |
| Size (bytes) | 485,346,240 | 89,559,360 |
| Size | 462.9 MB | 85.4 MB |
| Events in quadrant A | 3,548,914 | 585,137 |
| Events in quadrant B | 3,575,464 | 589,128 |
| Events in quadrant C | 3,332,186 | 550,199 |
| Events in quadrant D | 3,811,251 | 544,843 |
| Mode M0 | |||
|---|---|---|---|
| Quadrant | BADHDUFLAG | Total packets | Discarded packets |
| A | 0 | 14632 | 2 |
| B | 0 | 14595 | 2 |
| C | 0 | 13911 | 2 |
| D | 0 | 15278 | 3 |
| Mode M9 | |||
|---|---|---|---|
| Quadrant | BADHDUFLAG | Total packets | Discarded packets |
| A | 0 | 15 | 0 |
| B | 0 | 16 | 0 |
| C | 0 | 16 | 0 |
| D | 0 | 16 | 0 |
| Mode SS | |||
|---|---|---|---|
| Quadrant | BADHDUFLAG | Total packets | Discarded packets |
| A | 0 | 130 | 0 |
| B | 0 | 130 | 0 |
| C | 0 | 130 | 0 |
| D | 0 | 130 | 0 |
| Quadrant | Total seconds | Saturated seconds | Saturation percentage |
|---|---|---|---|
| A | 6343 | 137 | 2.159861% |
| B | 6343 | 131 | 2.065269% |
| C | 6343 | 121 | 1.907615% |
| D | 6342 | 125 | 1.970987% |
Noise dominated data is calculated using 1-second bins in cleaned event files. If a bin has >2000 counts, and if more than 50% of those come from <1% of pixels, then it is considered to be noise-dominated and hence unusable.
| Quadrant | # 1 sec bins | Bins with >0 counts | Bins with >2000 counts | High rate bins dominated by noise | Noise dominated (total time) | Noise dominated (detector-on time) | Marked lightcurve |
|---|---|---|---|---|---|---|---|
| A | 7563 | 6343 | 20 | 20 | 0.26% | 0.32% | 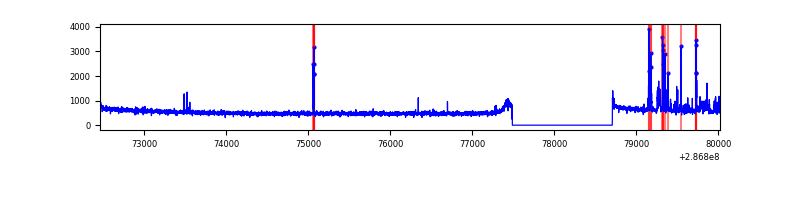 |
| B | 7563 | 6343 | 27 | 27 | 0.36% | 0.43% | 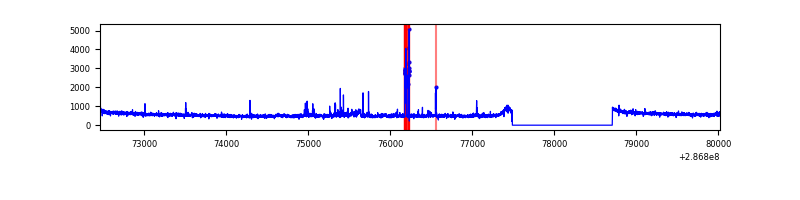 |
| C | 7563 | 6343 | 1 | 1 | 0.01% | 0.02% | 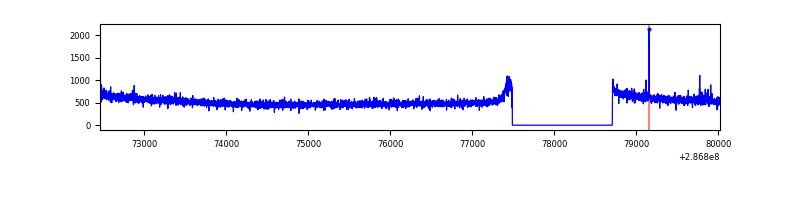 |
| D | 7562 | 6342 | 45 | 45 | 0.60% | 0.71% | 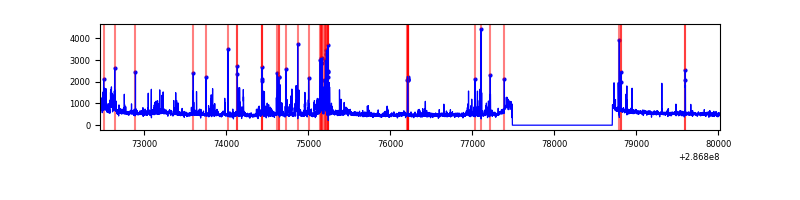 |
Top three noisy pixels from each quadrant. If the there are fewer than three noisy pixels in the level2.evt file, extra rows are filled as -1
| Pixel properties | Quadrant properties | ||||||
|---|---|---|---|---|---|---|---|
| Quadrant | DetID | PixID | Counts | Sigma | Mean | Median | Sigma |
| A | 4 | 2 | 177161 | 1022.14 | 871 | 857 | 172.5 |
| A | 15 | 174 | 25194 | 141.1 | 871 | 857 | 172.5 |
| A | 0 | 226 | 7714 | 39.75 | 871 | 857 | 172.5 |
| B | 5 | 172 | 90194 | 551.11 | 864 | 846 | 162.1 |
| B | 4 | 216 | 33734 | 202.86 | 864 | 846 | 162.1 |
| B | 0 | 229 | 29915 | 179.3 | 864 | 846 | 162.1 |
| C | 14 | 238 | 129022 | 680.84 | 813 | 819 | 188.3 |
| C | 9 | 160 | 13906 | 69.5 | 813 | 819 | 188.3 |
| C | 9 | 176 | 10216 | 49.9 | 813 | 819 | 188.3 |
| D | 11 | 176 | 410498 | 2032.09 | 832 | 811 | 201.6 |
| D | 7 | 238 | 109901 | 541.1 | 832 | 811 | 201.6 |
| D | 1 | 52 | 74734 | 366.67 | 832 | 811 | 201.6 |
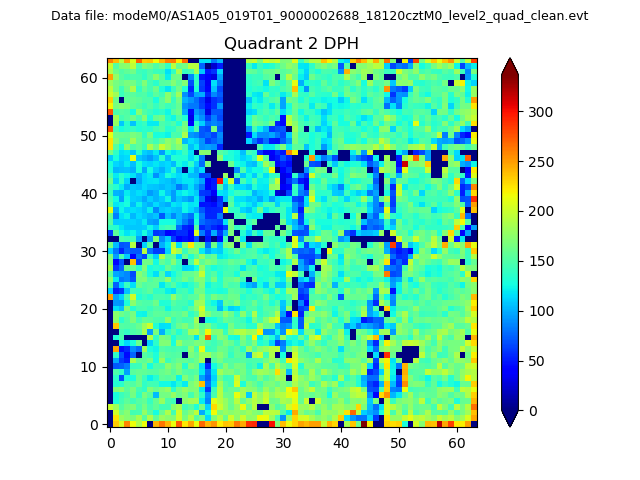
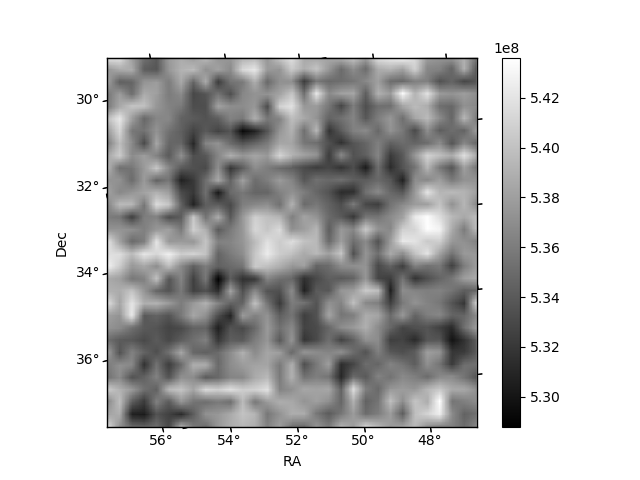
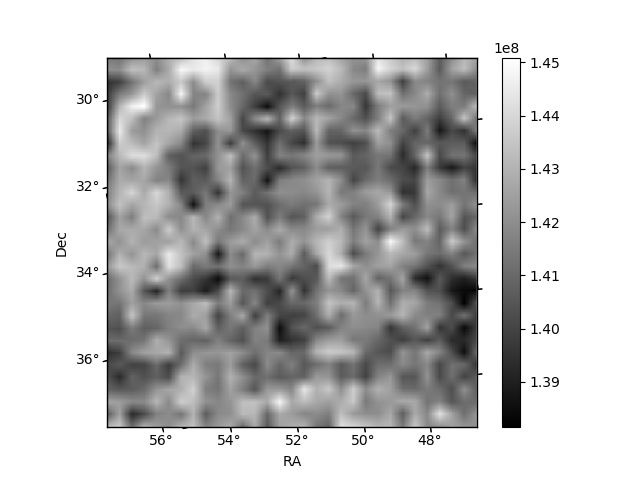
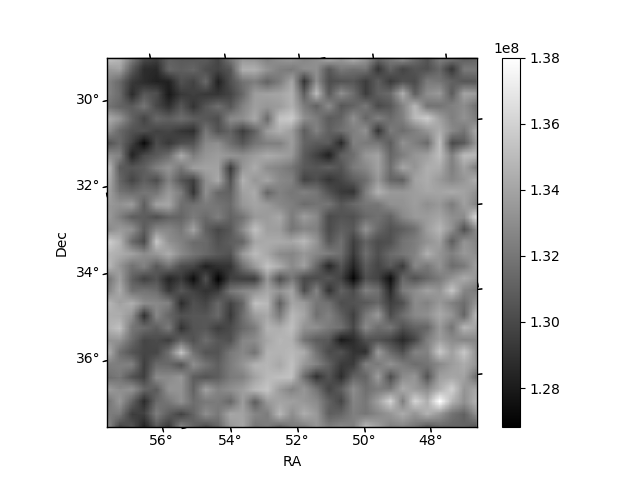
Histogram calculated using DETX and DETY for each event in the final _common_clean file
| Quadrant A | 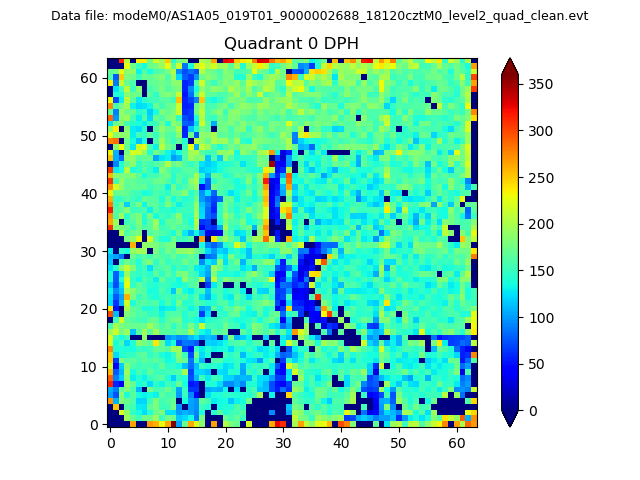 |
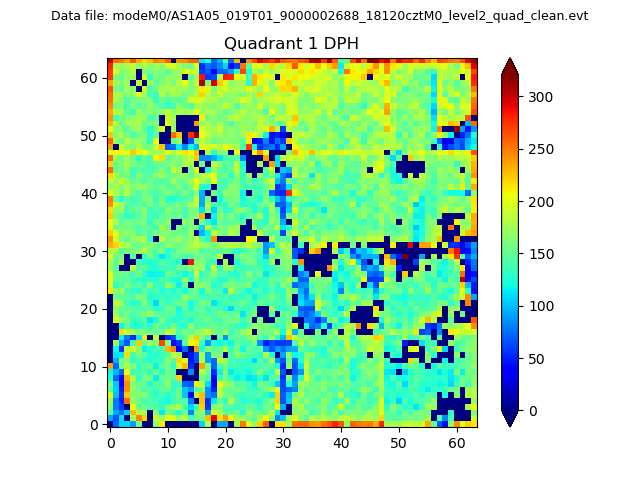 |
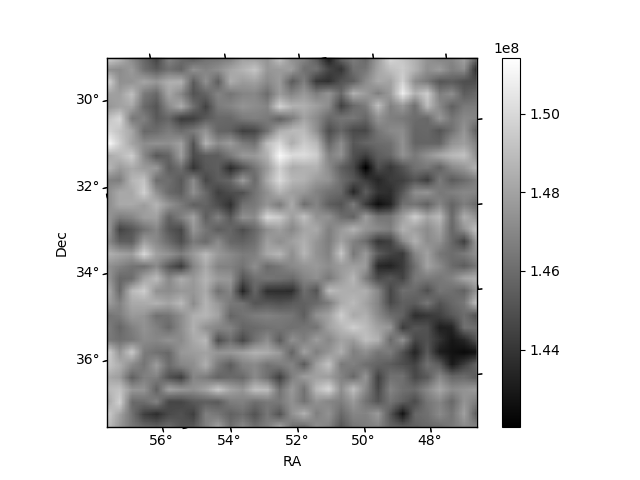
Quadrant B |
|---|---|---|---|
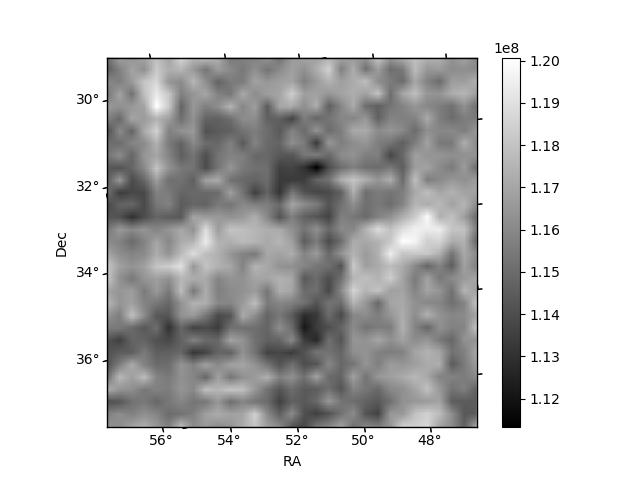
| Quadrant D | 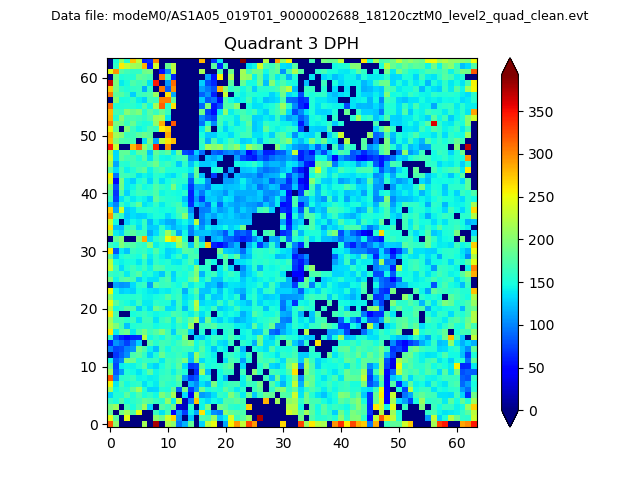 |
 |
Quadrant C |
| Plot type | Count rate plots | Images |
|---|---|---|
| Comparison with Poisson distribution Blue bars denote a histogram of data divided into 1 sec bins. Red curve is a Poisson curve with rate = median count rate of data. |
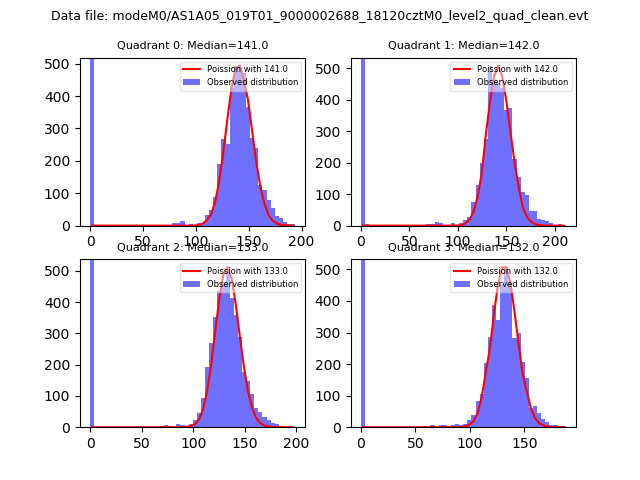 |
 |
| Quadrant-wise count rates Data is divided into 100 sec bins |
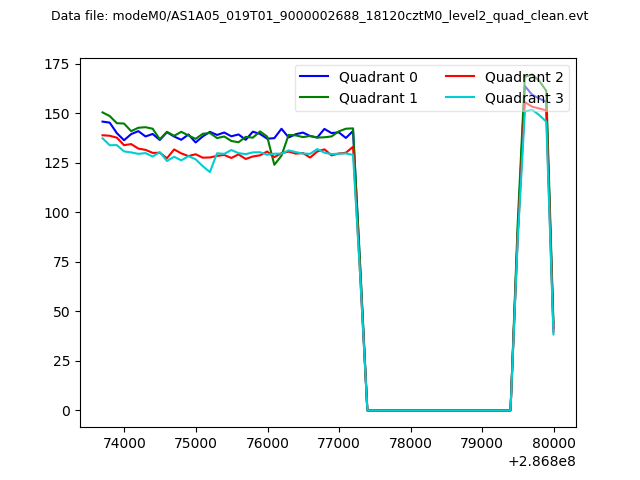 |
|
| Module-wise count rates for Quadrant A Data is divided into 100 sec bins |
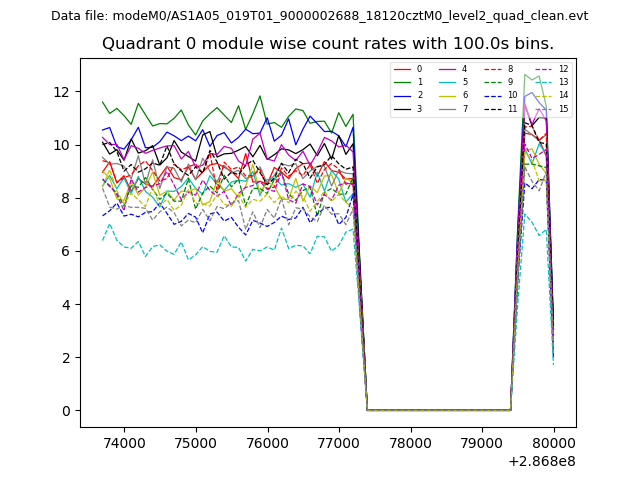 |
 |
| Module-wise count rates for Quadrant B Data is divided into 100 sec bins |
 |
 |
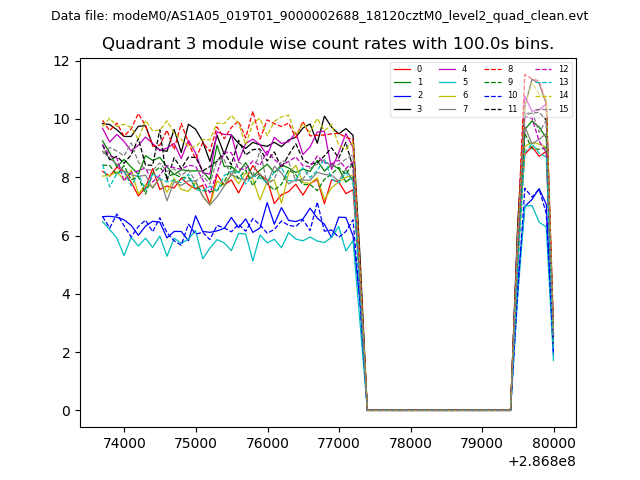
| Module-wise count rates for Quadrant C Data is divided into 100 sec bins |
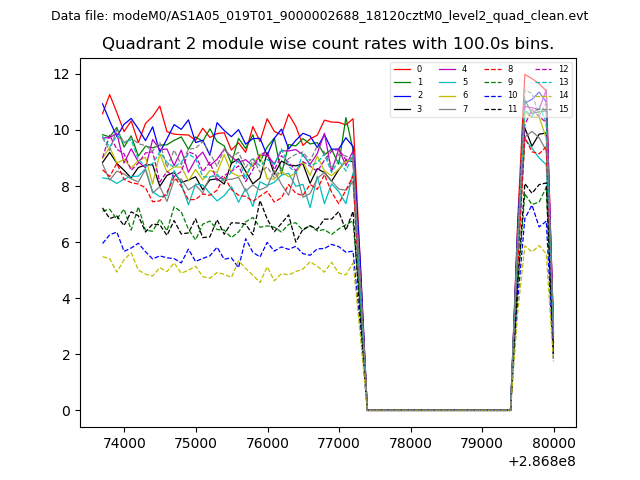 |
 |
| Module-wise count rates for Quadrant D Data is divided into 100 sec bins |
 |
 |
| Parameter | Plot |
|---|---|
| CZT HV Monitor | 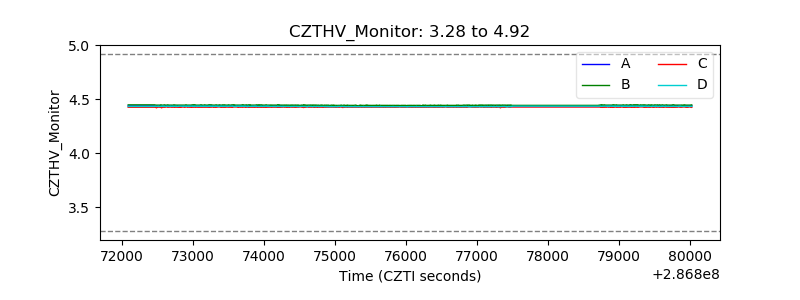 |
| D_VDD | 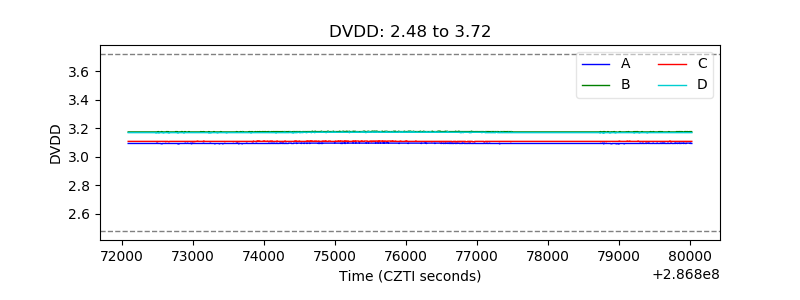 |
| Temperature 1 | 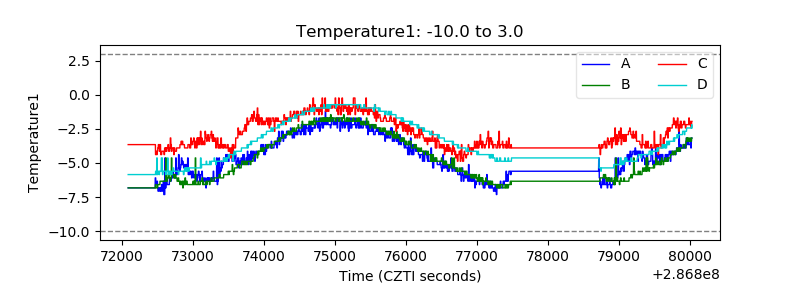 |
| Veto HV Monitor |  |
| Veto LLD | 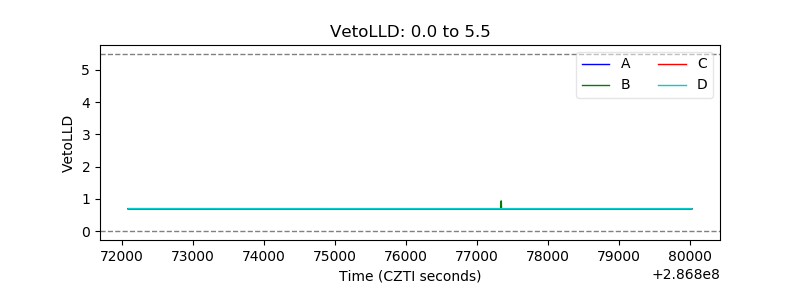 |
| Alpha Counter | 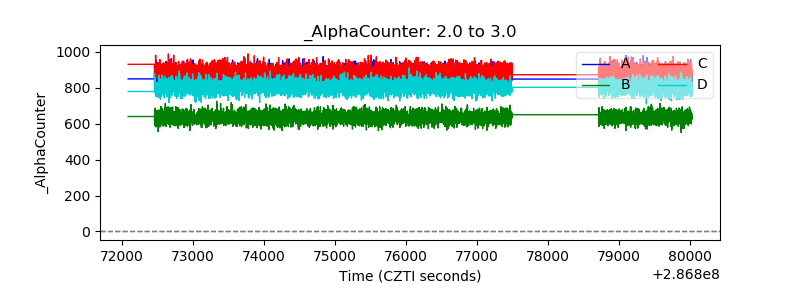 |
| _CPM_Rate | 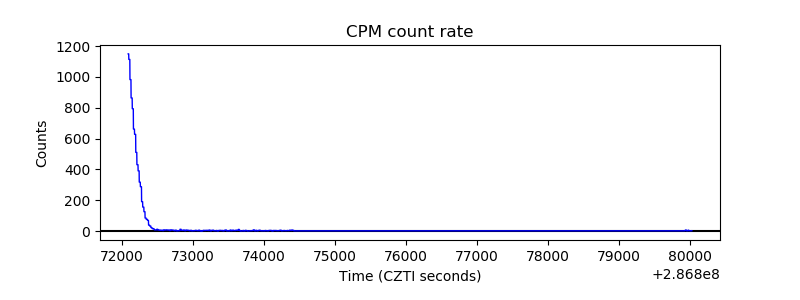 |
| CZT Counter | 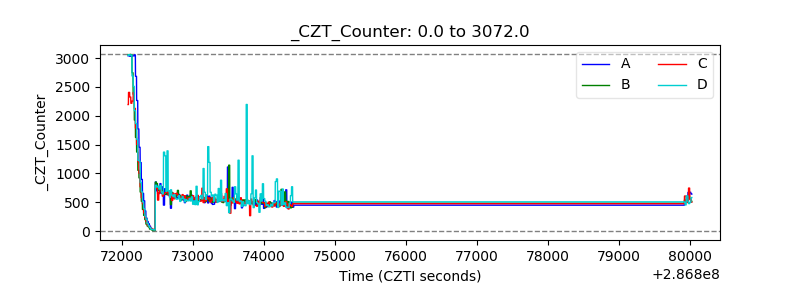 |
| +2.5 Volts monitor |  |
| +5 Volts monitor |  |
| _ROLL_ROT | 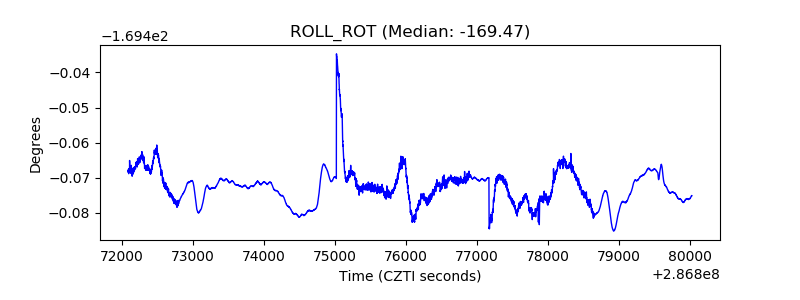 |
| _Roll_DEC | 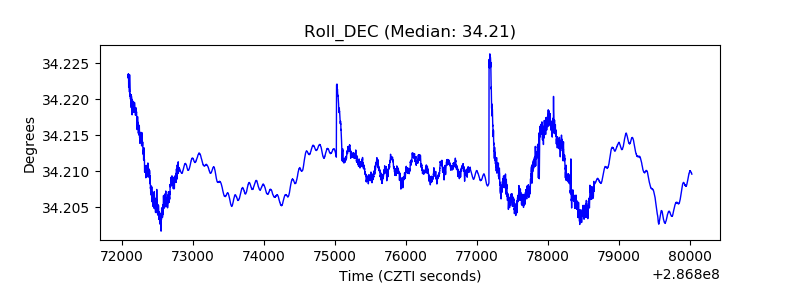 |
| _Roll_RA | 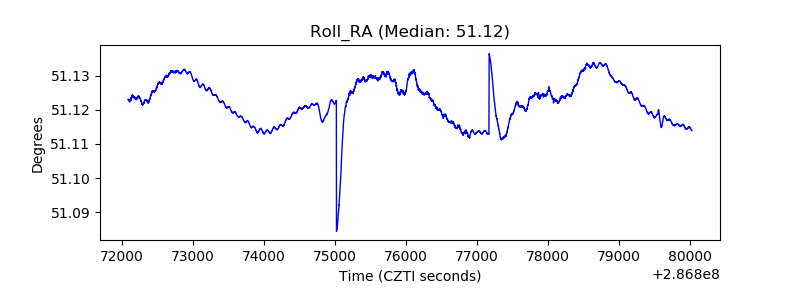 |
| Veto Counter | 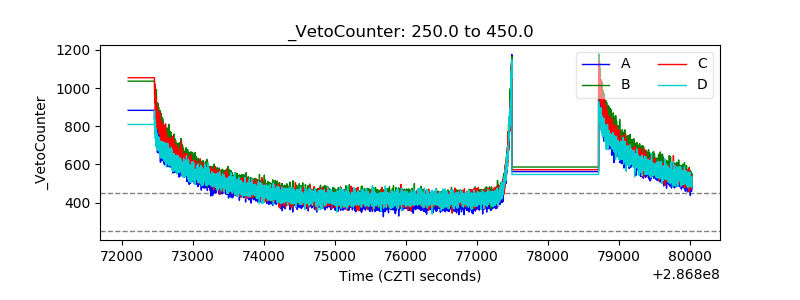 |