| Param | Original file | Final file |
|---|---|---|
| Filename | modeM0/AS1A05_019T01_9000002688_18121cztM0_level2.evt | modeM0/AS1A05_019T01_9000002688_18121cztM0_level2_quad_clean.evt |
| Size (bytes) | 506,580,480 | 101,787,840 |
| Size | 483.1 MB | 97.1 MB |
| Events in quadrant A | 3,746,502 | 685,856 |
| Events in quadrant B | 3,680,598 | 692,092 |
| Events in quadrant C | 3,386,729 | 636,126 |
| Events in quadrant D | 4,103,564 | 631,966 |
| Mode M0 | |||
|---|---|---|---|
| Quadrant | BADHDUFLAG | Total packets | Discarded packets |
| A | 0 | 15181 | 2 |
| B | 0 | 14872 | 2 |
| C | 0 | 13924 | 2 |
| D | 0 | 16074 | 2 |
| Mode M9 | |||
|---|---|---|---|
| Quadrant | BADHDUFLAG | Total packets | Discarded packets |
| A | 0 | 20 | 0 |
| B | 0 | 21 | 0 |
| C | 0 | 21 | 0 |
| D | 0 | 21 | 0 |
| Mode SS | |||
|---|---|---|---|
| Quadrant | BADHDUFLAG | Total packets | Discarded packets |
| A | 0 | 126 | 0 |
| B | 0 | 126 | 0 |
| C | 0 | 126 | 0 |
| D | 0 | 126 | 0 |
| Quadrant | Total seconds | Saturated seconds | Saturation percentage |
|---|---|---|---|
| A | 6261 | 158 | 2.523559% |
| B | 6261 | 141 | 2.252036% |
| C | 6261 | 120 | 1.916627% |
| D | 6261 | 221 | 3.529788% |
Noise dominated data is calculated using 1-second bins in cleaned event files. If a bin has >2000 counts, and if more than 50% of those come from <1% of pixels, then it is considered to be noise-dominated and hence unusable.
| Quadrant | # 1 sec bins | Bins with >0 counts | Bins with >2000 counts | High rate bins dominated by noise | Noise dominated (total time) | Noise dominated (detector-on time) | Marked lightcurve |
|---|---|---|---|---|---|---|---|
| A | 7546 | 6262 | 20 | 20 | 0.27% | 0.32% | 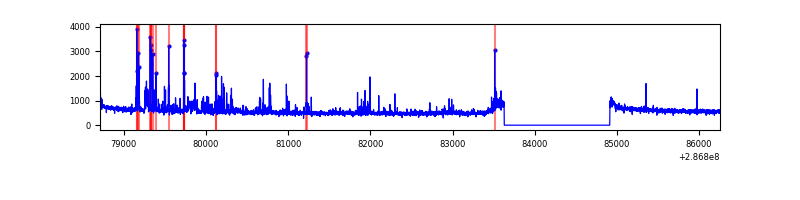 |
| B | 7546 | 6261 | 27 | 27 | 0.36% | 0.43% | 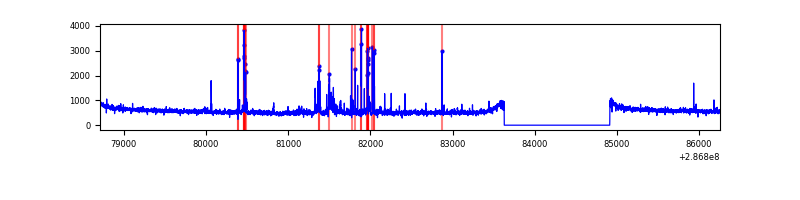 |
| C | 7546 | 6262 | 2 | 2 | 0.03% | 0.03% | 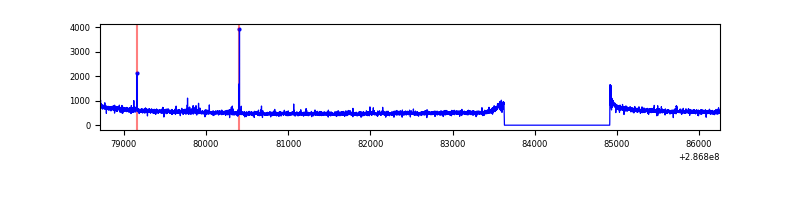 |
| D | 7546 | 6262 | 124 | 124 | 1.64% | 1.98% | 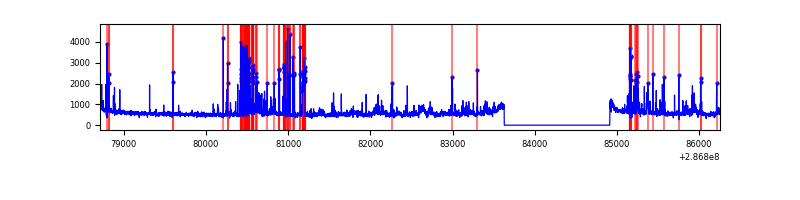 |
Top three noisy pixels from each quadrant. If the there are fewer than three noisy pixels in the level2.evt file, extra rows are filled as -1
| Pixel properties | Quadrant properties | ||||||
|---|---|---|---|---|---|---|---|
| Quadrant | DetID | PixID | Counts | Sigma | Mean | Median | Sigma |
| A | 4 | 2 | 333644 | 1896.72 | 884 | 868 | 175.4 |
| A | 15 | 174 | 15818 | 85.21 | 884 | 868 | 175.4 |
| A | 0 | 226 | 7686 | 38.86 | 884 | 868 | 175.4 |
| B | 5 | 172 | 102289 | 619.94 | 874 | 855 | 163.6 |
| B | 4 | 171 | 47631 | 285.89 | 874 | 855 | 163.6 |
| B | 6 | 36 | 31133 | 185.05 | 874 | 855 | 163.6 |
| C | 14 | 238 | 130793 | 685.74 | 817 | 822 | 189.5 |
| C | 3 | 233 | 30098 | 154.46 | 817 | 822 | 189.5 |
| C | 9 | 160 | 20023 | 101.31 | 817 | 822 | 189.5 |
| D | 7 | 238 | 517927 | 2549.96 | 841 | 819 | 202.8 |
| D | 11 | 176 | 237339 | 1166.32 | 841 | 819 | 202.8 |
| D | 13 | 104 | 62700 | 305.15 | 841 | 819 | 202.8 |
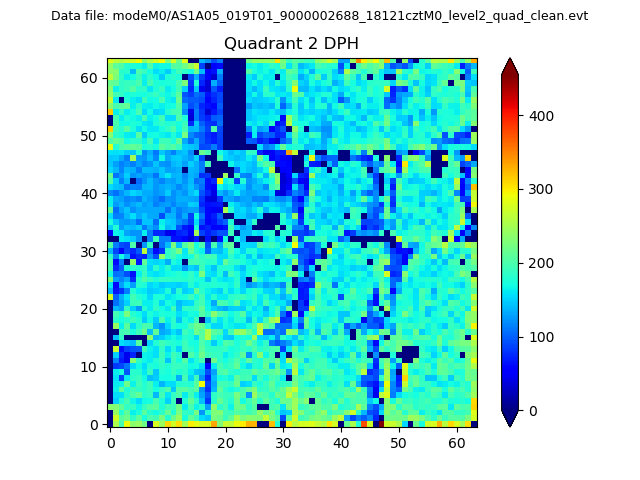
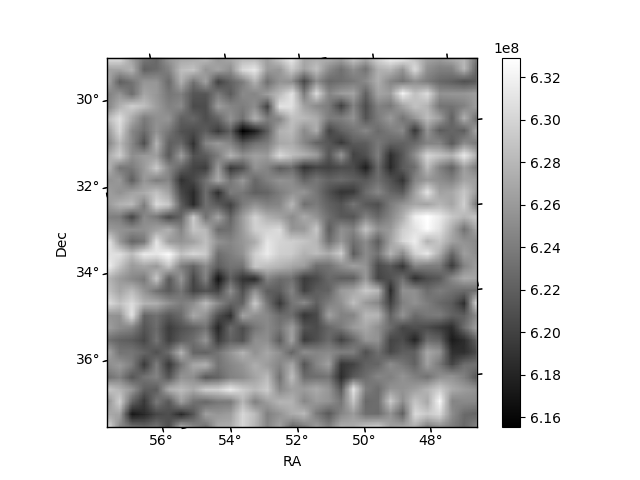
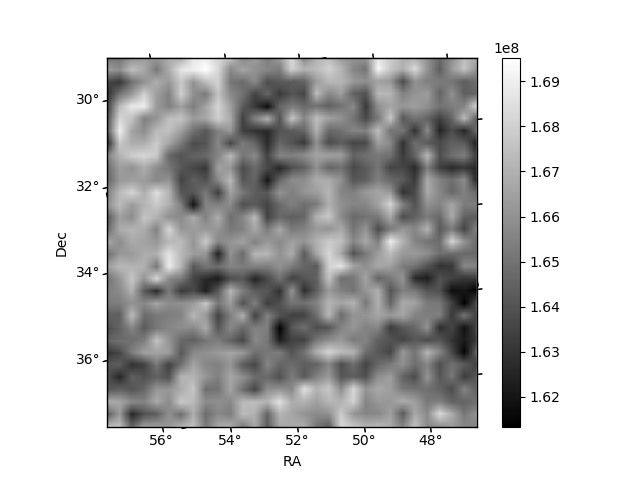
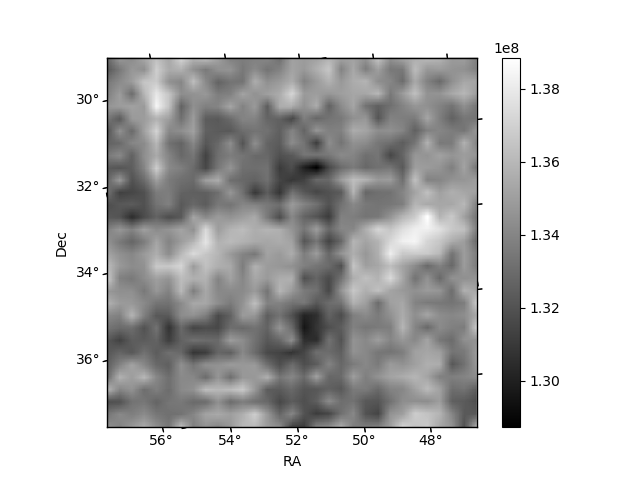
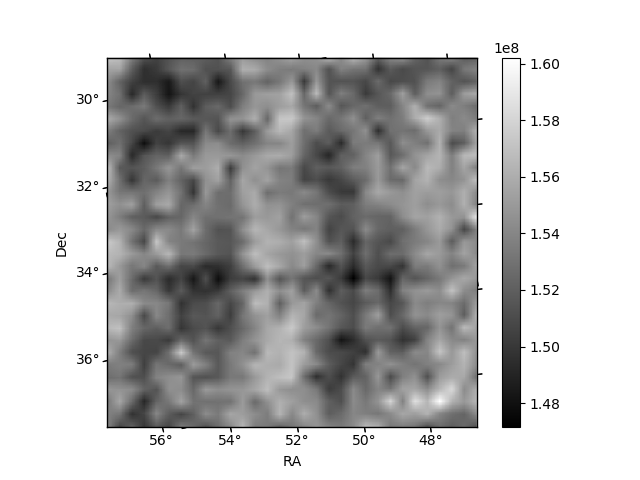
Histogram calculated using DETX and DETY for each event in the final _common_clean file
| Quadrant A | 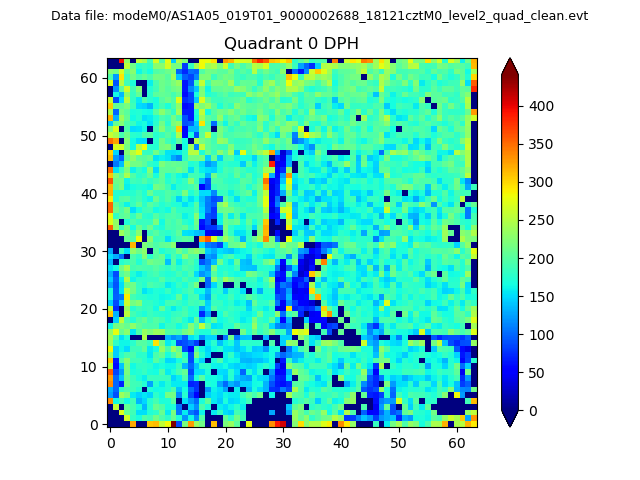 |
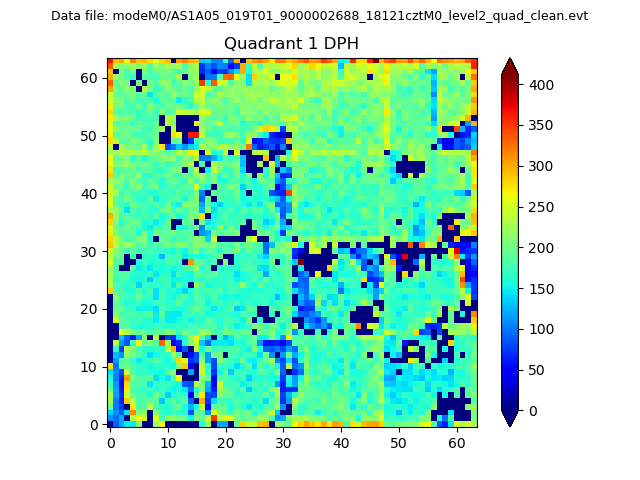 |
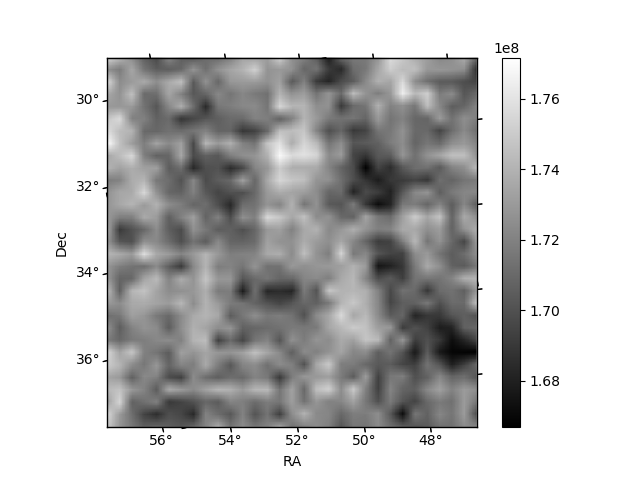
Quadrant B |
|---|---|---|---|
| Quadrant D | 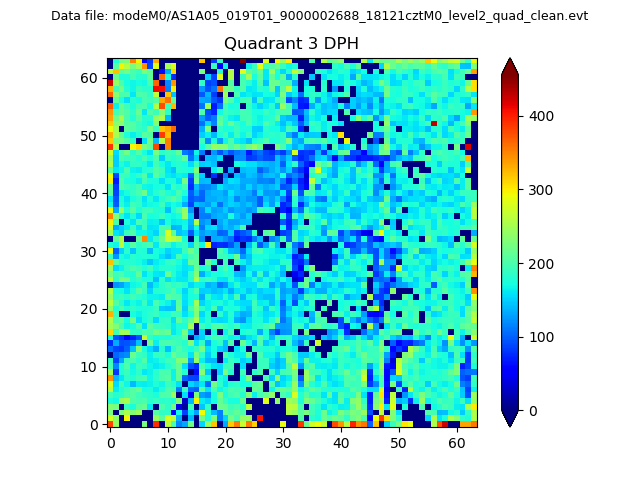 |
 |
Quadrant C |
| Plot type | Count rate plots | Images |
|---|---|---|
| Comparison with Poisson distribution Blue bars denote a histogram of data divided into 1 sec bins. Red curve is a Poisson curve with rate = median count rate of data. |
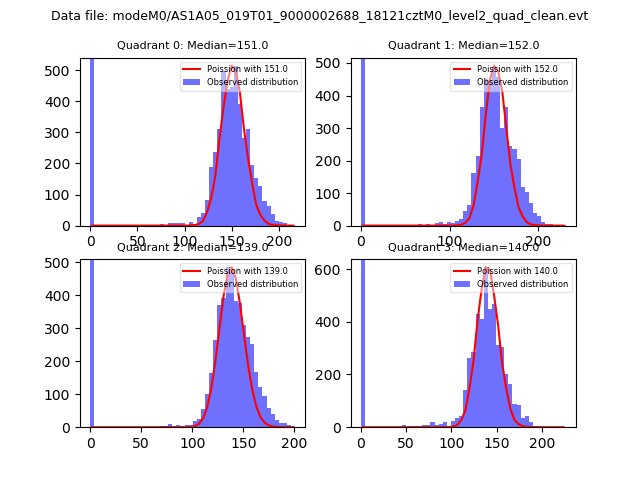 |
 |
| Quadrant-wise count rates Data is divided into 100 sec bins |
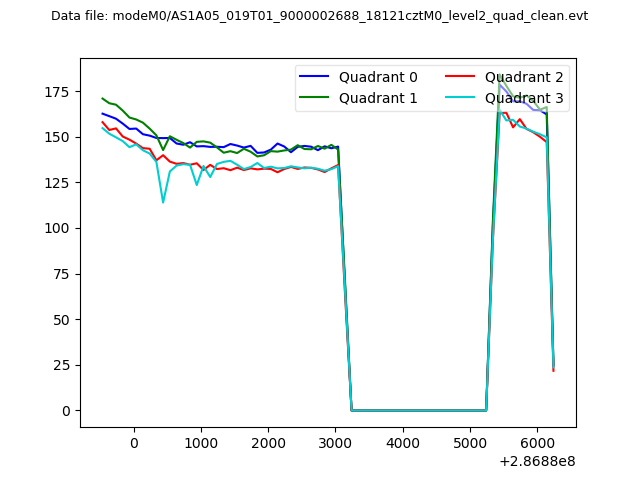 |
|
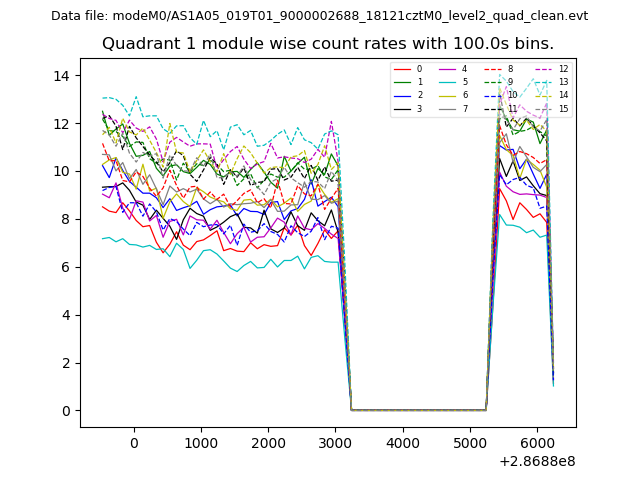
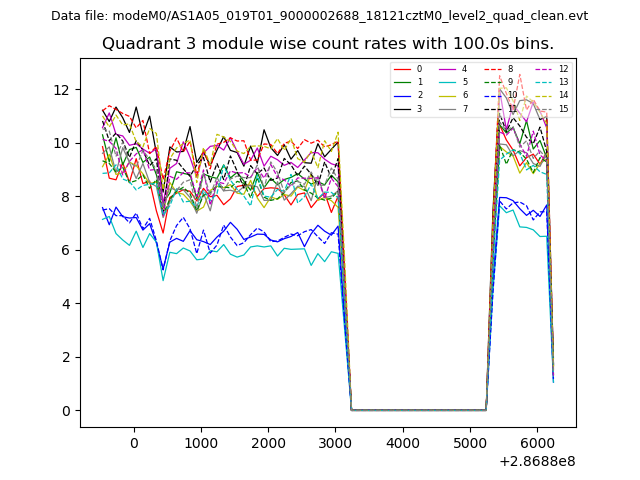
| Module-wise count rates for Quadrant A Data is divided into 100 sec bins |
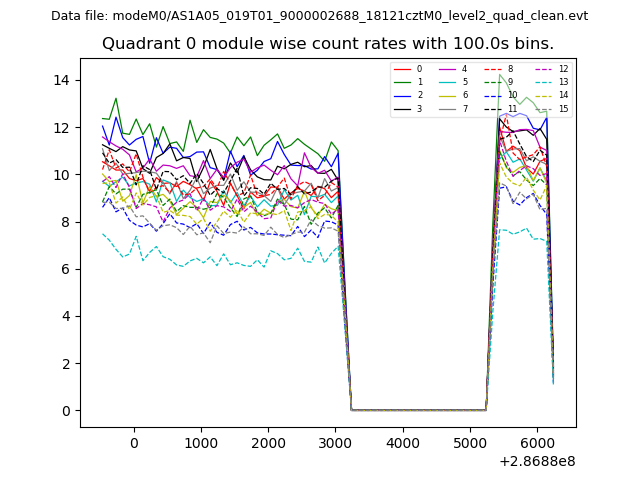 |
 |
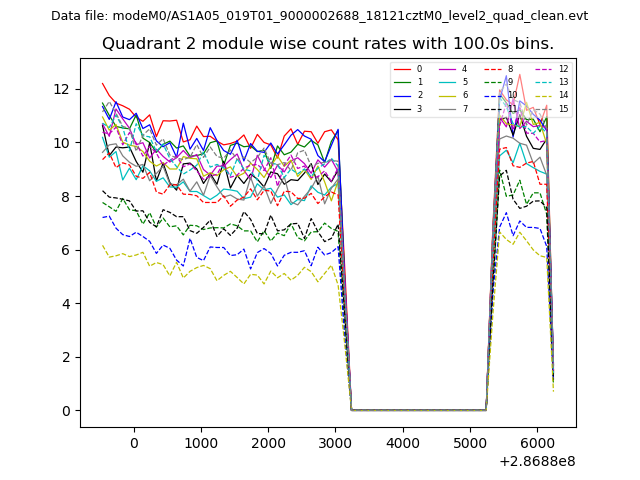
| Module-wise count rates for Quadrant B Data is divided into 100 sec bins |
 |
 |
| Module-wise count rates for Quadrant C Data is divided into 100 sec bins |
 |
 |
| Module-wise count rates for Quadrant D Data is divided into 100 sec bins |
 |
 |
| Parameter | Plot |
|---|---|
| CZT HV Monitor | 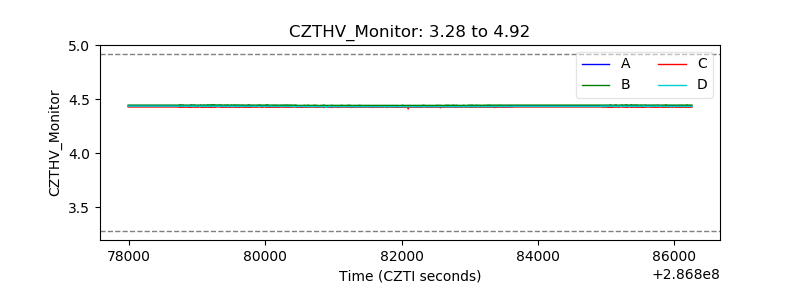 |
| D_VDD | 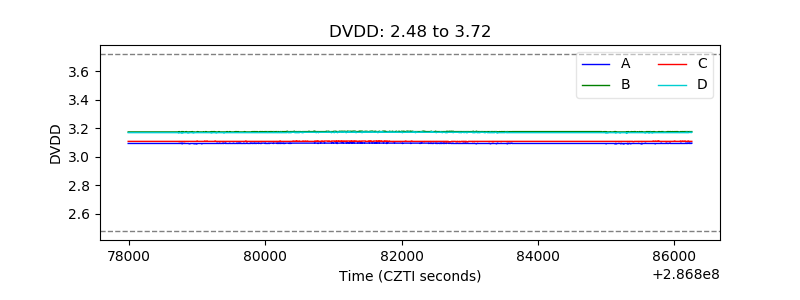 |
| Temperature 1 | 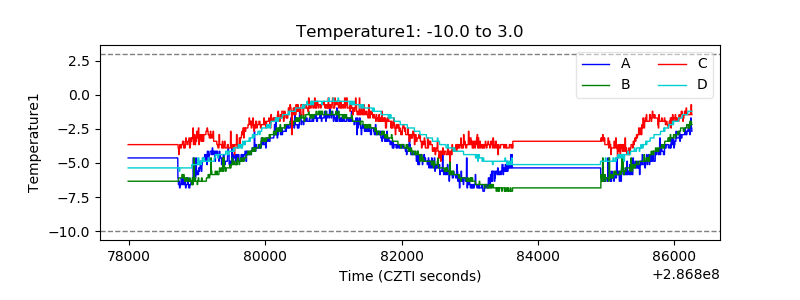 |
| Veto HV Monitor | 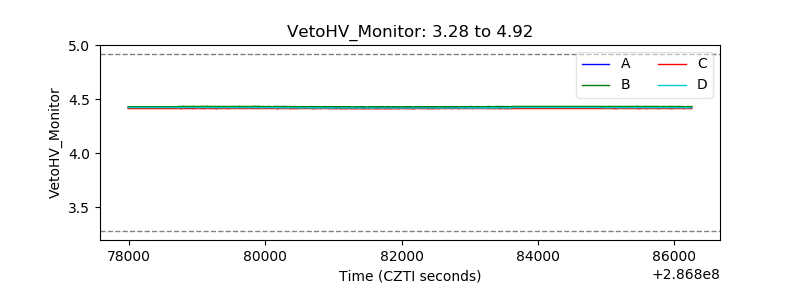 |
| Veto LLD | 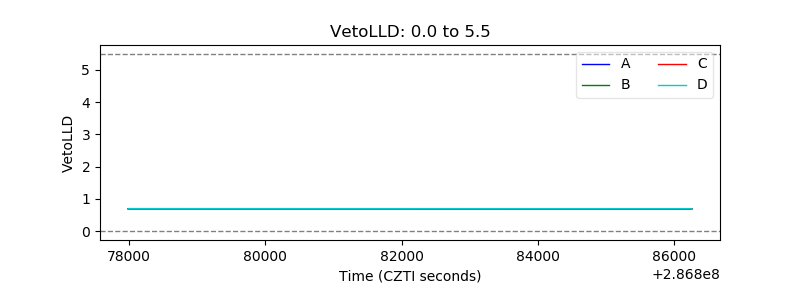 |
| Alpha Counter | 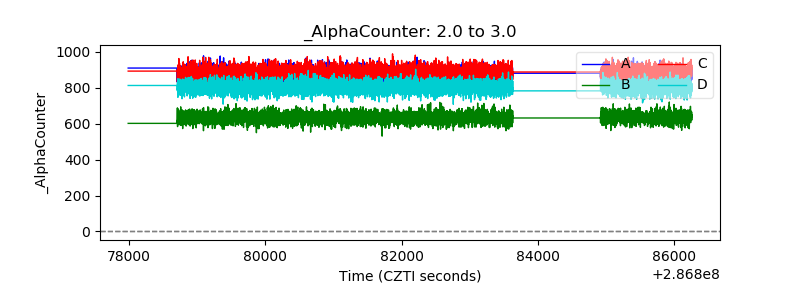 |
| _CPM_Rate | 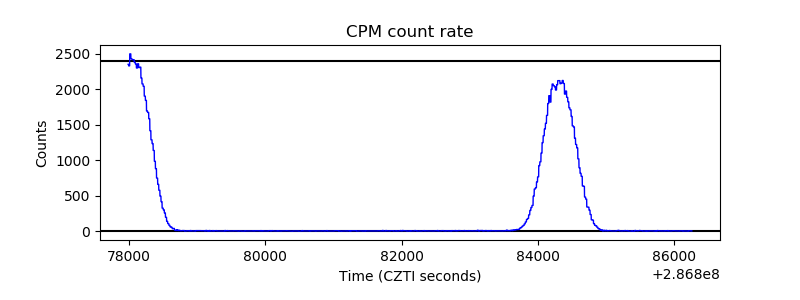 |
| CZT Counter | 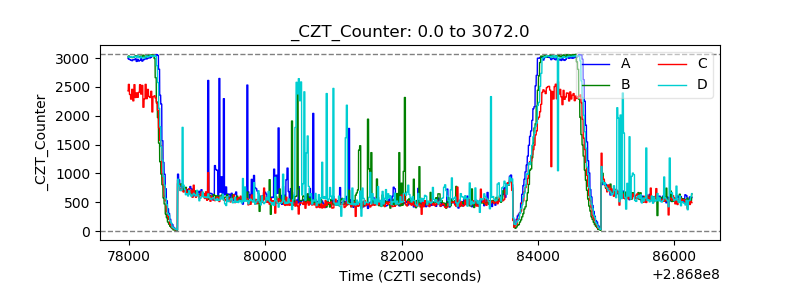 |
| +2.5 Volts monitor |  |
| +5 Volts monitor |  |
| _ROLL_ROT | 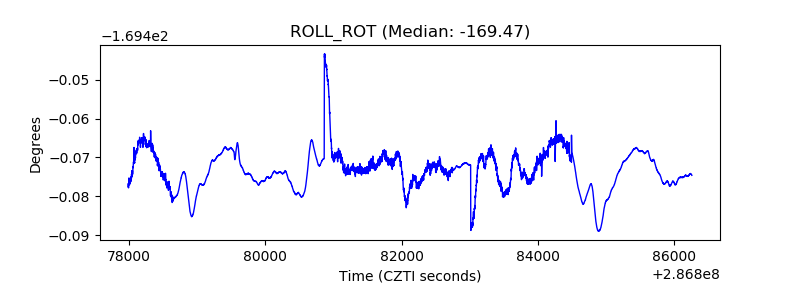 |
| _Roll_DEC | 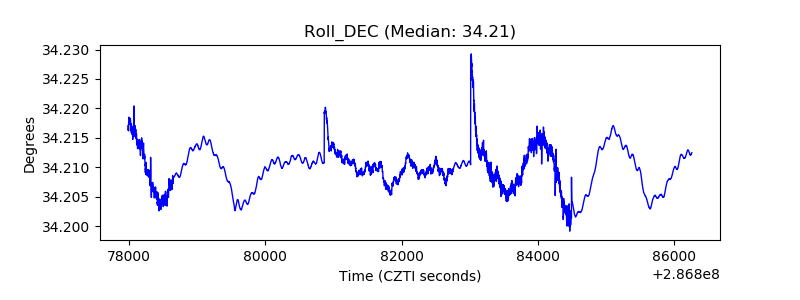 |
| _Roll_RA | 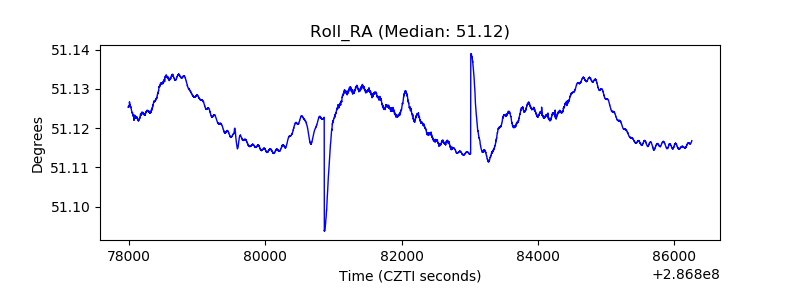 |
| Veto Counter |  |