| Param | Original file | Final file |
|---|---|---|
| Filename | modeM0/AS1A05_019T01_9000002688_18122cztM0_level2.evt | modeM0/AS1A05_019T01_9000002688_18122cztM0_level2_quad_clean.evt |
| Size (bytes) | 487,601,280 | 107,429,760 |
| Size | 465.0 MB | 102.5 MB |
| Events in quadrant A | 3,038,437 | 746,561 |
| Events in quadrant B | 3,199,756 | 747,659 |
| Events in quadrant C | 2,961,823 | 687,412 |
| Events in quadrant D | 5,180,566 | 673,524 |
| Mode M0 | |||
|---|---|---|---|
| Quadrant | BADHDUFLAG | Total packets | Discarded packets |
| A | 0 | 12460 | 1 |
| B | 0 | 12834 | 1 |
| C | 0 | 12134 | 1 |
| D | 0 | 19095 | 1 |
| Mode M9 | |||
|---|---|---|---|
| Quadrant | BADHDUFLAG | Total packets | Discarded packets |
| A | 0 | 13 | 0 |
| B | 0 | 13 | 0 |
| C | 0 | 13 | 0 |
| D | 0 | 13 | 0 |
| Mode SS | |||
|---|---|---|---|
| Quadrant | BADHDUFLAG | Total packets | Discarded packets |
| A | 0 | 116 | 0 |
| B | 0 | 116 | 0 |
| C | 0 | 116 | 0 |
| D | 0 | 116 | 0 |
| Quadrant | Total seconds | Saturated seconds | Saturation percentage |
|---|---|---|---|
| A | 5699 | 120 | 2.105633% |
| B | 5700 | 136 | 2.385965% |
| C | 5700 | 136 | 2.385965% |
| D | 5700 | 254 | 4.456140% |
Noise dominated data is calculated using 1-second bins in cleaned event files. If a bin has >2000 counts, and if more than 50% of those come from <1% of pixels, then it is considered to be noise-dominated and hence unusable.
| Quadrant | # 1 sec bins | Bins with >0 counts | Bins with >2000 counts | High rate bins dominated by noise | Noise dominated (total time) | Noise dominated (detector-on time) | Marked lightcurve |
|---|---|---|---|---|---|---|---|
| A | 6999 | 5699 | 4 | 4 | 0.06% | 0.07% | 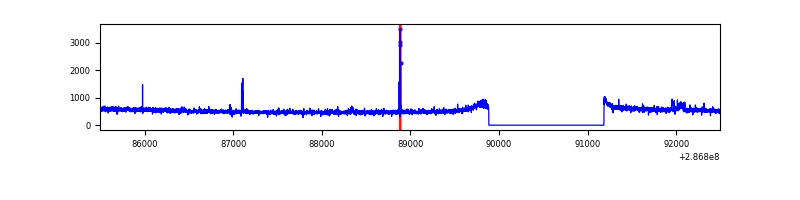 |
| B | 7000 | 5700 | 13 | 13 | 0.19% | 0.23% | 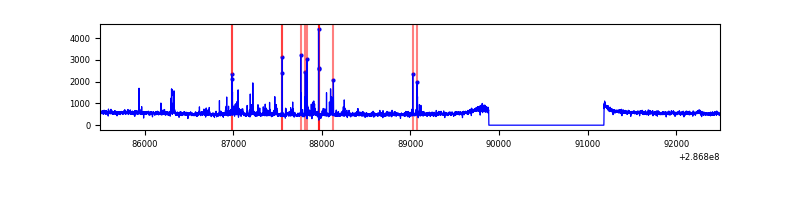 |
| C | 7000 | 5701 | 0 | 0 | 0.00% | 0.00% | 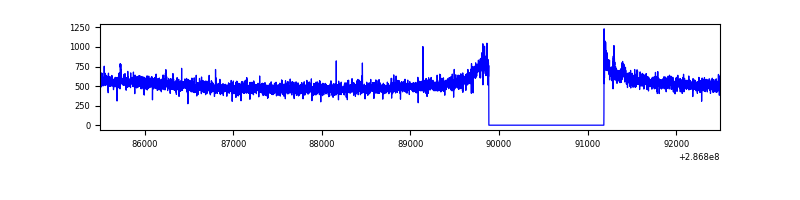 |
| D | 7000 | 5701 | 218 | 218 | 3.11% | 3.82% | 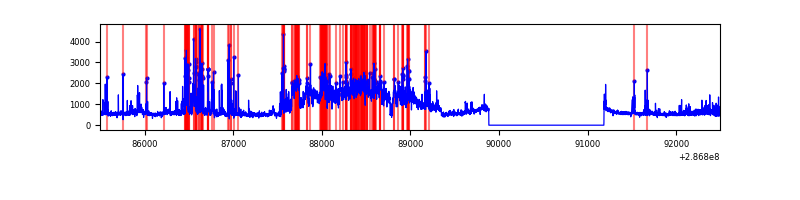 |
Top three noisy pixels from each quadrant. If the there are fewer than three noisy pixels in the level2.evt file, extra rows are filled as -1
| Pixel properties | Quadrant properties | ||||||
|---|---|---|---|---|---|---|---|
| Quadrant | DetID | PixID | Counts | Sigma | Mean | Median | Sigma |
| A | 15 | 174 | 49420 | 313.68 | 777 | 763 | 155.1 |
| A | 0 | 226 | 6842 | 39.19 | 777 | 763 | 155.1 |
| A | 12 | 194 | 5797 | 32.45 | 777 | 763 | 155.1 |
| B | 5 | 172 | 53966 | 368.63 | 765 | 748 | 144.4 |
| B | 7 | 220 | 47837 | 326.18 | 765 | 748 | 144.4 |
| B | 0 | 189 | 44658 | 304.16 | 765 | 748 | 144.4 |
| C | 14 | 238 | 114573 | 681.19 | 719 | 724 | 167.1 |
| C | 3 | 233 | 29872 | 174.4 | 719 | 724 | 167.1 |
| C | 5 | 218 | 5122 | 26.31 | 719 | 724 | 167.1 |
| D | 7 | 238 | 1765078 | 9870.9 | 741 | 720 | 178.7 |
| D | 11 | 176 | 288578 | 1610.45 | 741 | 720 | 178.7 |
| D | 13 | 104 | 160986 | 896.63 | 741 | 720 | 178.7 |
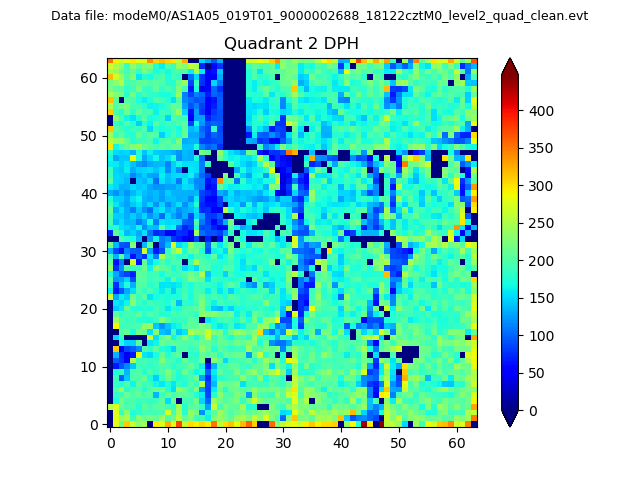
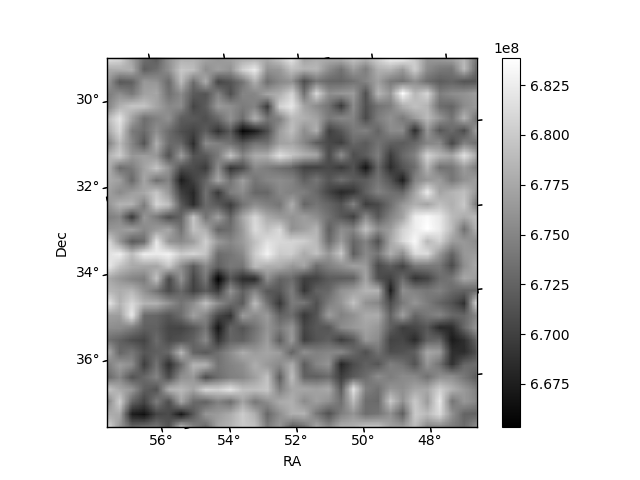
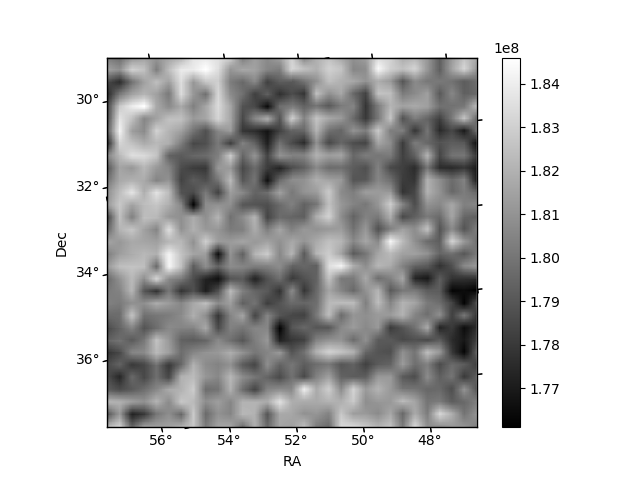
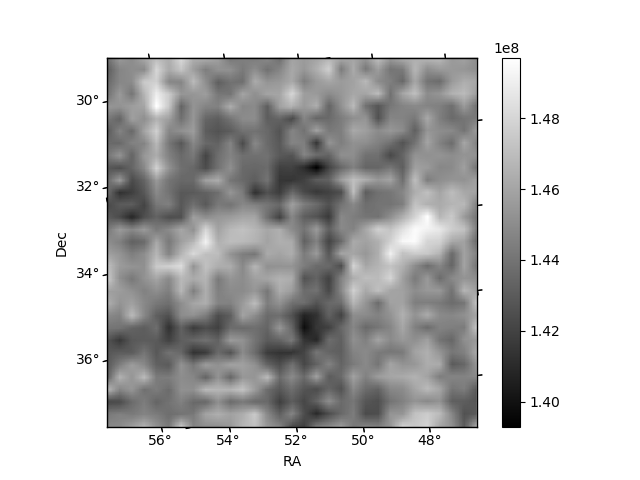
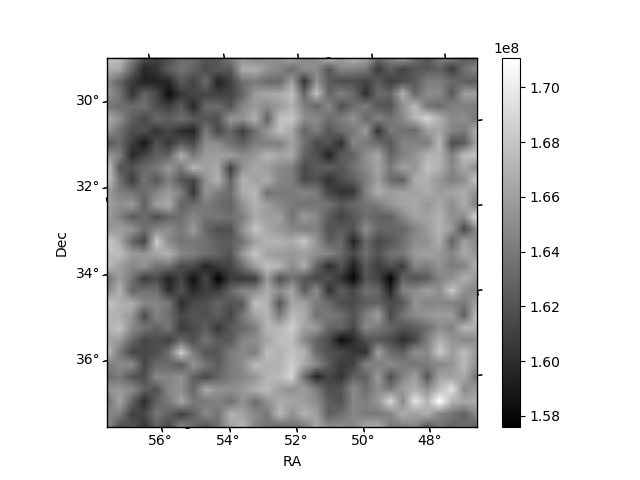
Histogram calculated using DETX and DETY for each event in the final _common_clean file
| Quadrant A | 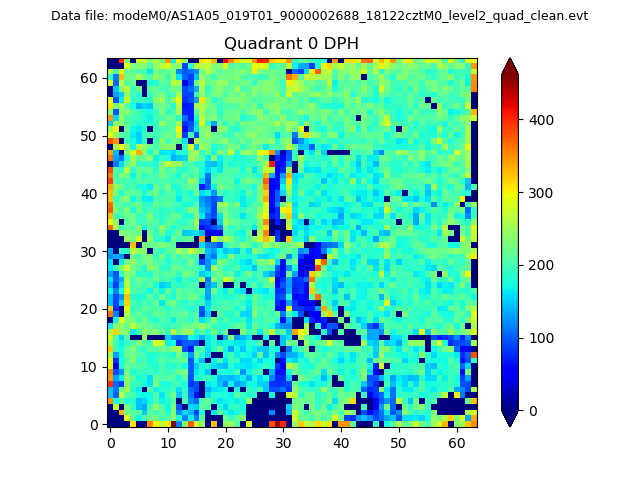 |
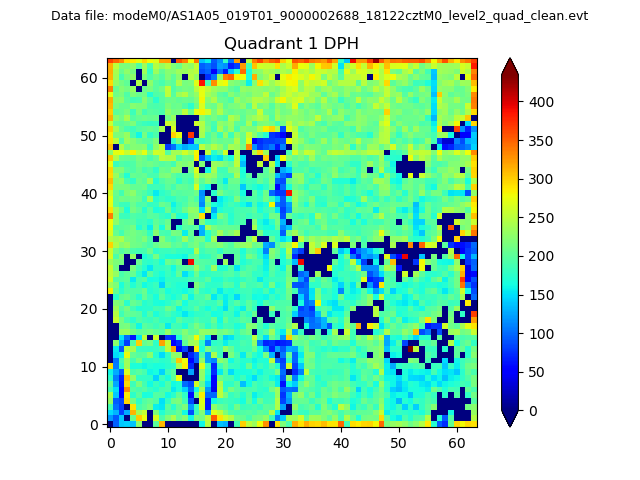 |
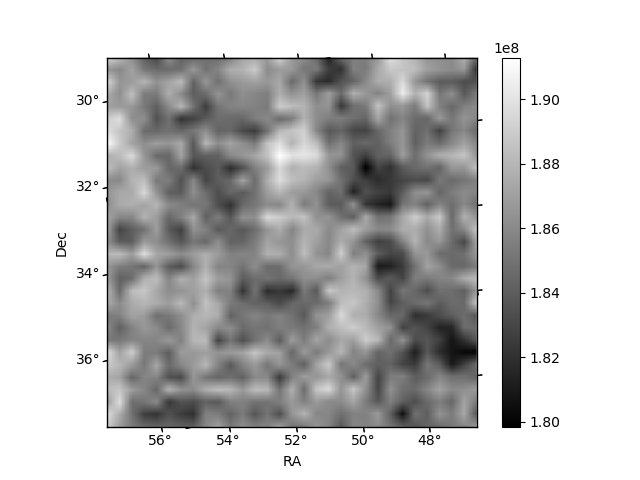
Quadrant B |
|---|---|---|---|
| Quadrant D | 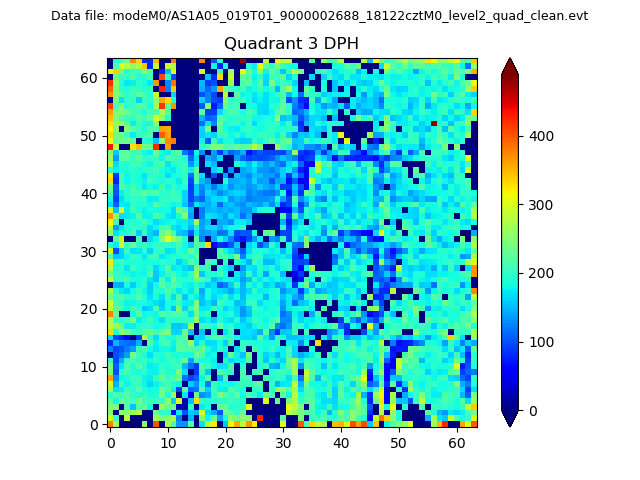 |
 |
Quadrant C |
| Plot type | Count rate plots | Images |
|---|---|---|
| Comparison with Poisson distribution Blue bars denote a histogram of data divided into 1 sec bins. Red curve is a Poisson curve with rate = median count rate of data. |
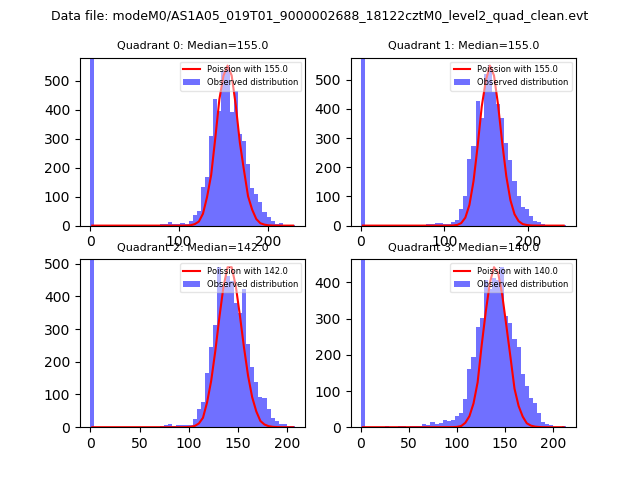 |
 |
| Quadrant-wise count rates Data is divided into 100 sec bins |
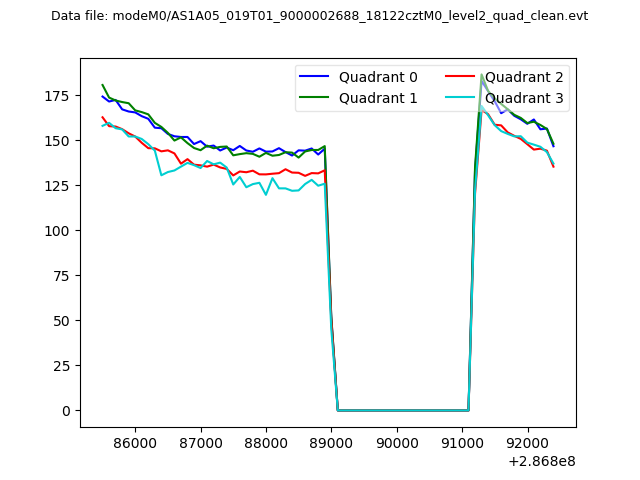 |
|
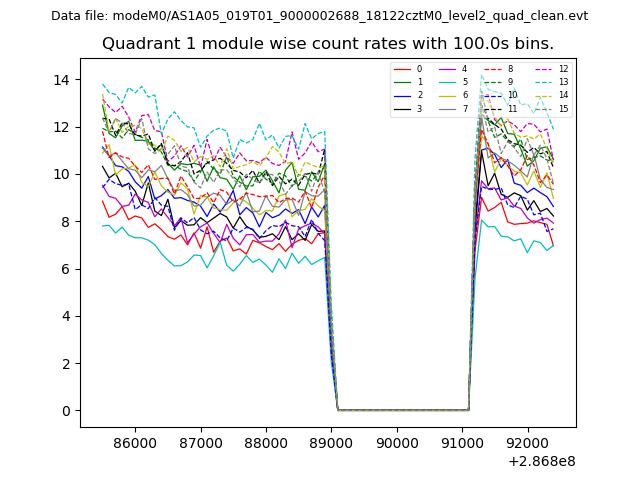
| Module-wise count rates for Quadrant A Data is divided into 100 sec bins |
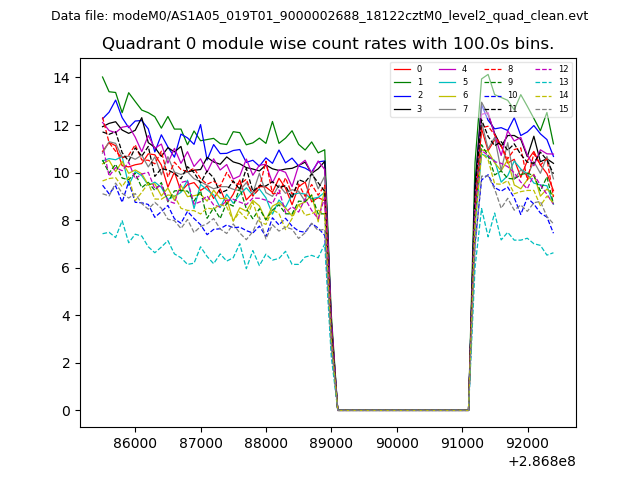 |
 |
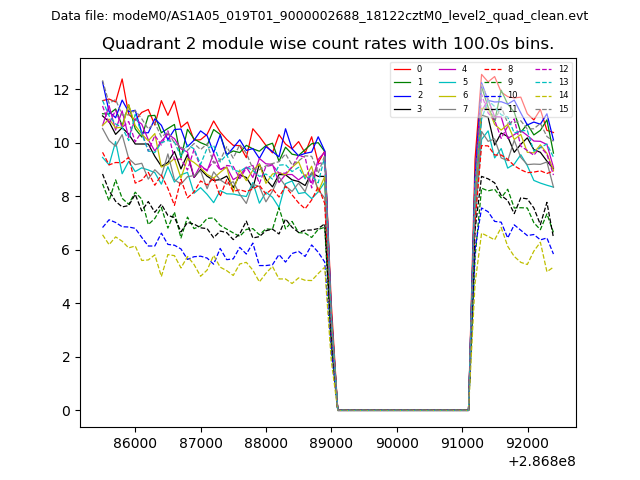
| Module-wise count rates for Quadrant B Data is divided into 100 sec bins |
 |
 |
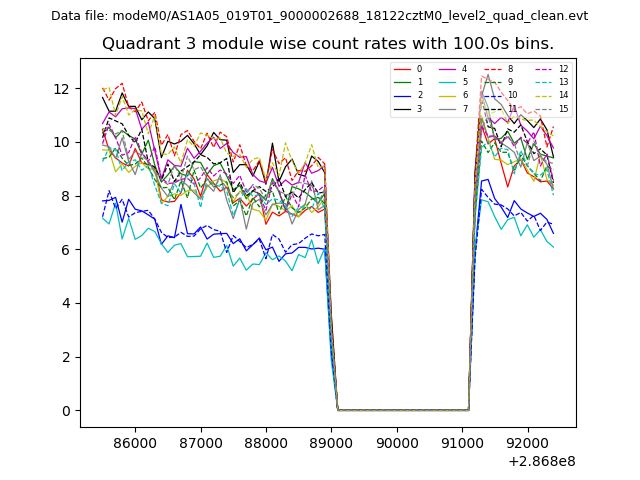
| Module-wise count rates for Quadrant C Data is divided into 100 sec bins |
 |
 |
| Module-wise count rates for Quadrant D Data is divided into 100 sec bins |
 |
 |
| Parameter | Plot |
|---|---|
| CZT HV Monitor | 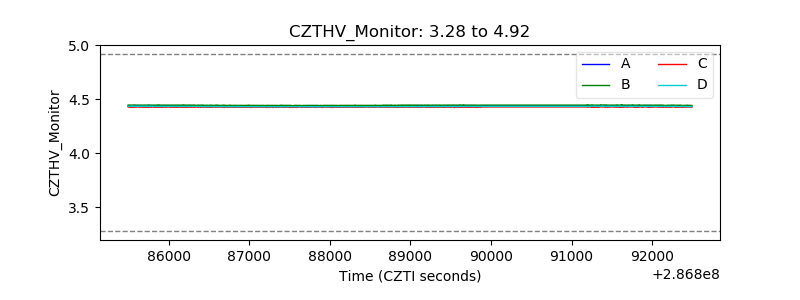 |
| D_VDD | 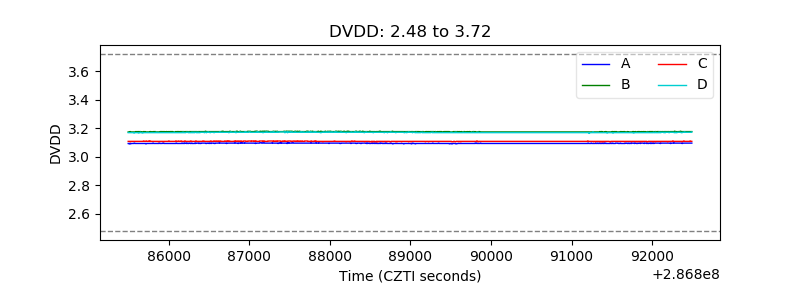 |
| Temperature 1 | 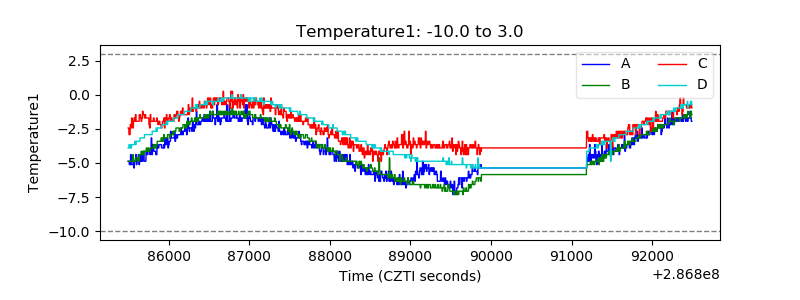 |
| Veto HV Monitor | 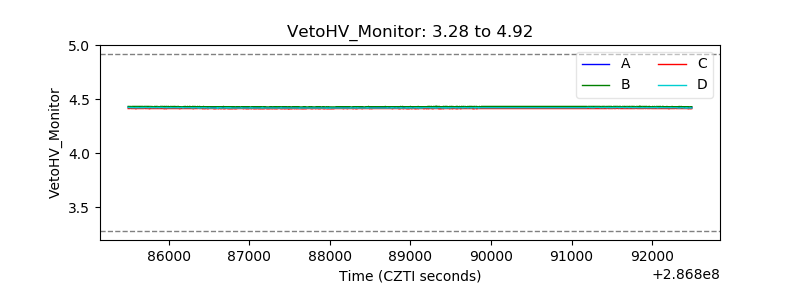 |
| Veto LLD | 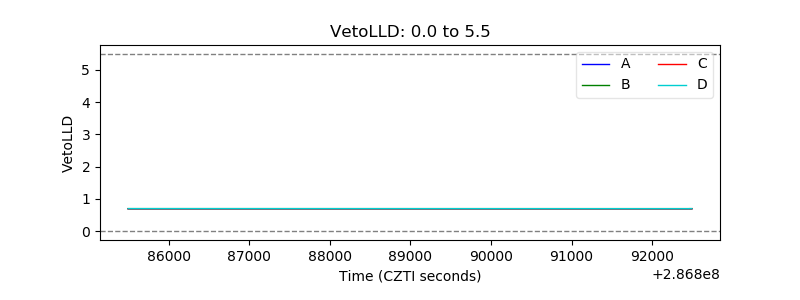 |
| Alpha Counter | 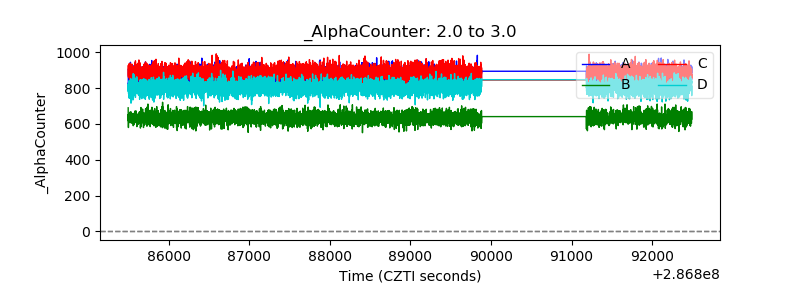 |
| _CPM_Rate | 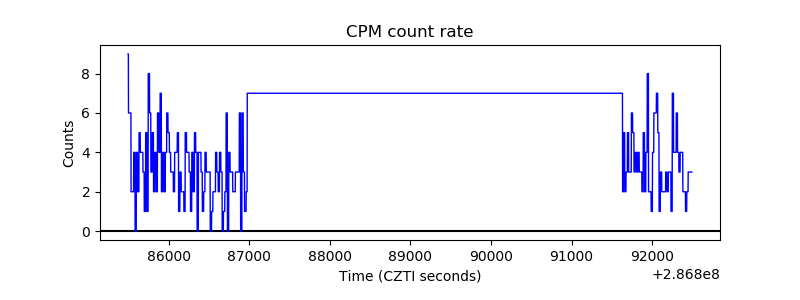 |
| CZT Counter |  |
| +2.5 Volts monitor |  |
| +5 Volts monitor |  |
| _ROLL_ROT | 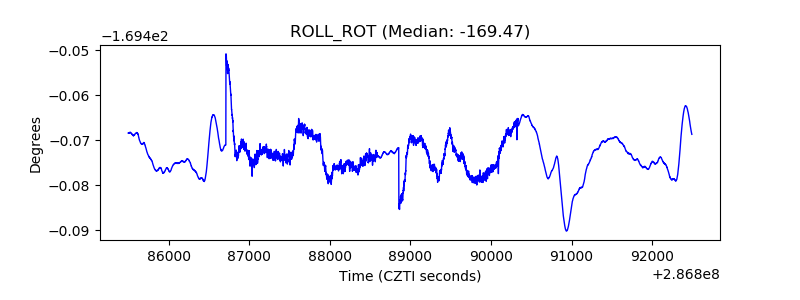 |
| _Roll_DEC |  |
| _Roll_RA | 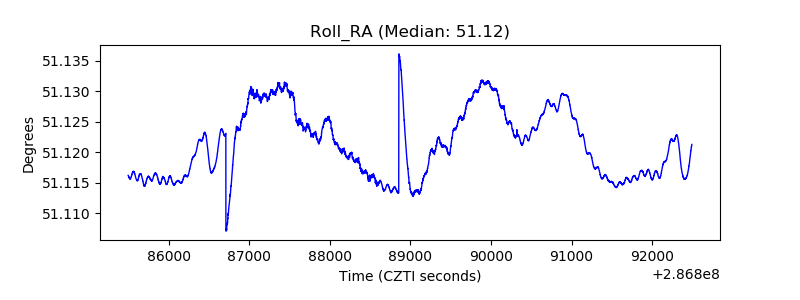 |
| Veto Counter |  |