| Param | Original file | Final file |
|---|---|---|
| Filename | modeM0/AS1A05_019T01_9000002688_18123cztM0_level2.evt | modeM0/AS1A05_019T01_9000002688_18123cztM0_level2_quad_clean.evt |
| Size (bytes) | 210,657,600 | 51,235,200 |
| Size | 200.9 MB | 48.9 MB |
| Events in quadrant A | 1,469,236 | 356,169 |
| Events in quadrant B | 1,308,336 | 360,346 |
| Events in quadrant C | 1,170,036 | 332,438 |
| Events in quadrant D | 2,266,349 | 328,523 |
| Mode M0 | |||
|---|---|---|---|
| Quadrant | BADHDUFLAG | Total packets | Discarded packets |
| A | 0 | 5817 | 0 |
| B | 0 | 5324 | 0 |
| C | 0 | 4885 | 0 |
| D | 0 | 8337 | 0 |
| Mode SS | |||
|---|---|---|---|
| Quadrant | BADHDUFLAG | Total packets | Discarded packets |
| A | 0 | 48 | 0 |
| B | 0 | 48 | 0 |
| C | 0 | 48 | 0 |
| D | 0 | 48 | 0 |
| Quadrant | Total seconds | Saturated seconds | Saturation percentage |
|---|---|---|---|
| A | 2417 | 59 | 2.441043% |
| B | 2418 | 8 | 0.330852% |
| C | 2418 | 4 | 0.165426% |
| D | 2418 | 91 | 3.763441% |
Noise dominated data is calculated using 1-second bins in cleaned event files. If a bin has >2000 counts, and if more than 50% of those come from <1% of pixels, then it is considered to be noise-dominated and hence unusable.
| Quadrant | # 1 sec bins | Bins with >0 counts | Bins with >2000 counts | High rate bins dominated by noise | Noise dominated (total time) | Noise dominated (detector-on time) | Marked lightcurve |
|---|---|---|---|---|---|---|---|
| A | 2417 | 2417 | 42 | 42 | 1.74% | 1.74% | 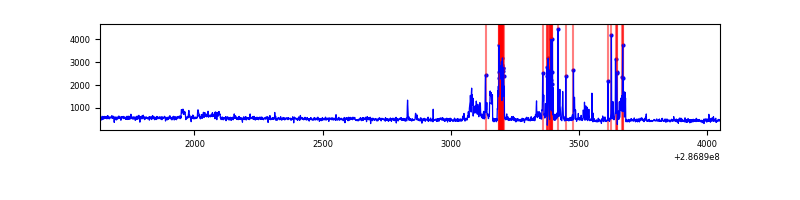 |
| B | 2418 | 2418 | 4 | 4 | 0.17% | 0.17% | 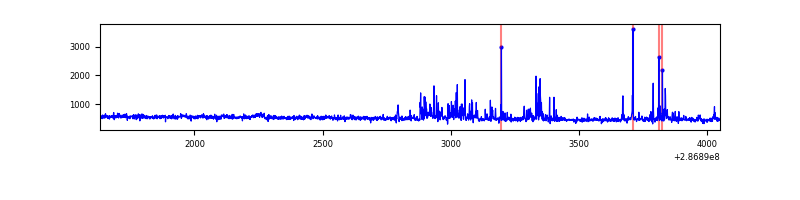 |
| C | 2418 | 2418 | 0 | 0 | 0.00% | 0.00% | 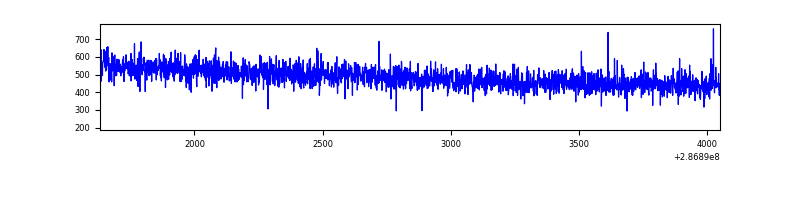 |
| D | 2418 | 2418 | 111 | 111 | 4.59% | 4.59% | 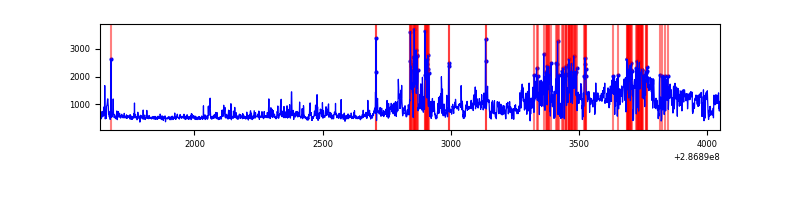 |
Top three noisy pixels from each quadrant. If the there are fewer than three noisy pixels in the level2.evt file, extra rows are filled as -1
| Pixel properties | Quadrant properties | ||||||
|---|---|---|---|---|---|---|---|
| Quadrant | DetID | PixID | Counts | Sigma | Mean | Median | Sigma |
| A | 15 | 174 | 265398 | 4220.8 | 307 | 302 | 62.8 |
| A | 4 | 2 | 18998 | 297.67 | 307 | 302 | 62.8 |
| A | 0 | 226 | 2811 | 39.95 | 307 | 302 | 62.8 |
| B | 7 | 220 | 98328 | 1672.24 | 301 | 296 | 58.6 |
| B | 0 | 189 | 15226 | 254.68 | 301 | 296 | 58.6 |
| B | 5 | 172 | 11588 | 192.62 | 301 | 296 | 58.6 |
| C | 14 | 238 | 45225 | 670.88 | 284 | 285 | 67.0 |
| C | 5 | 218 | 10050 | 145.77 | 284 | 285 | 67.0 |
| C | 3 | 233 | 3837 | 53.02 | 284 | 285 | 67.0 |
| D | 7 | 238 | 897712 | 12251.76 | 295 | 287 | 73.2 |
| D | 11 | 176 | 117431 | 1599.26 | 295 | 287 | 73.2 |
| D | 7 | 38 | 45343 | 615.11 | 295 | 287 | 73.2 |
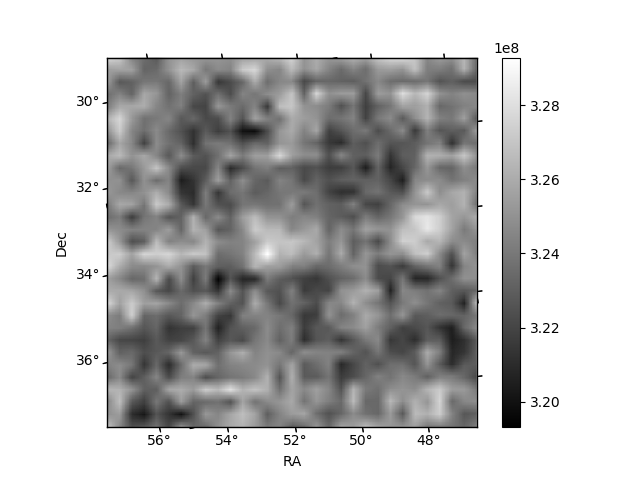
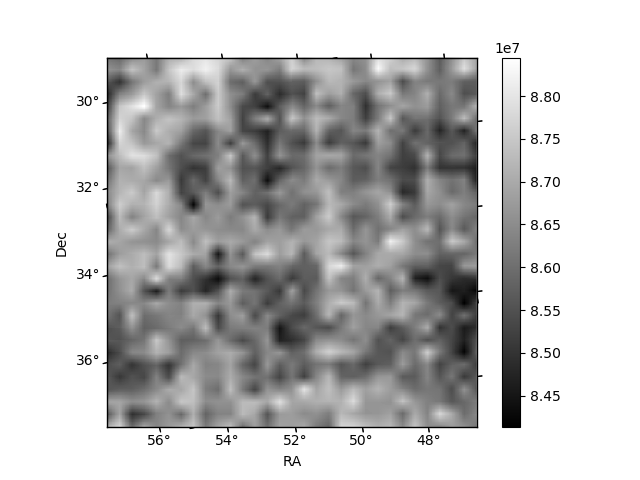
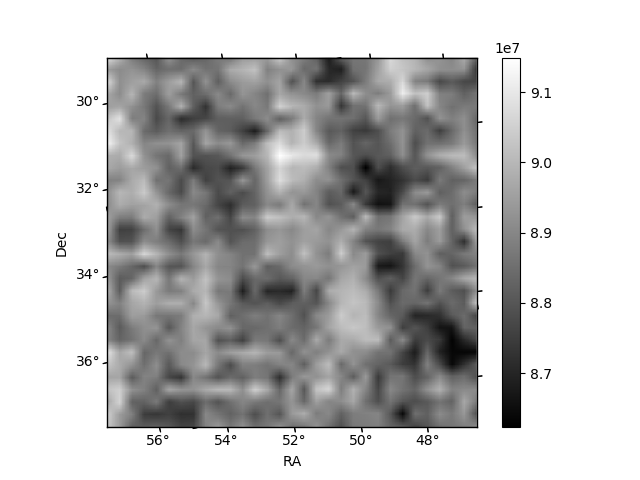
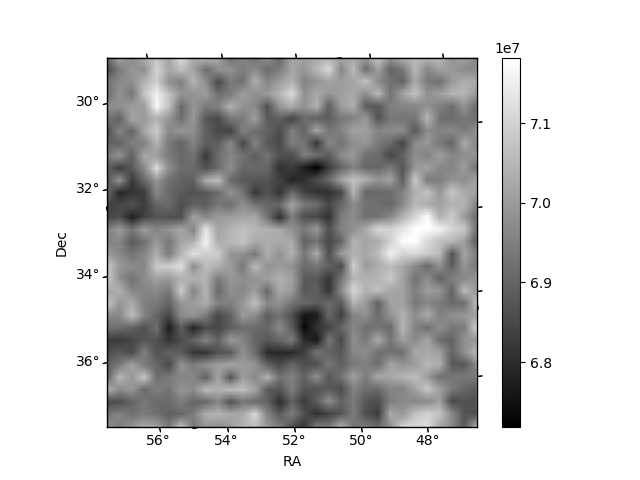
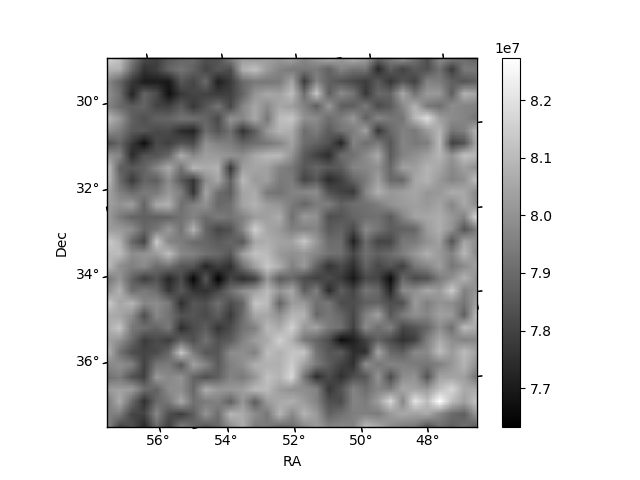
Histogram calculated using DETX and DETY for each event in the final _common_clean file
| Quadrant A | 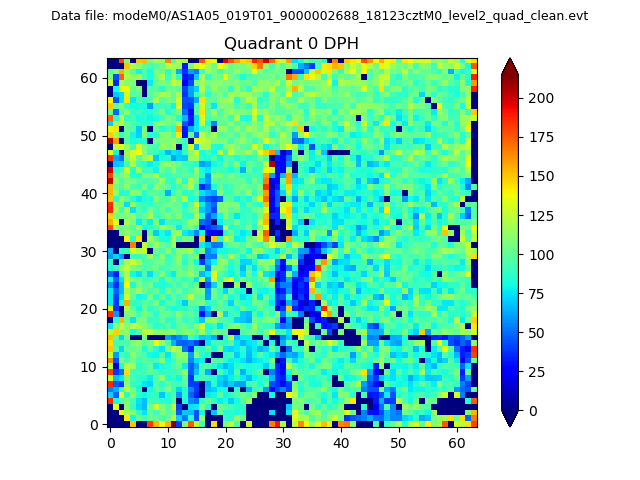 |
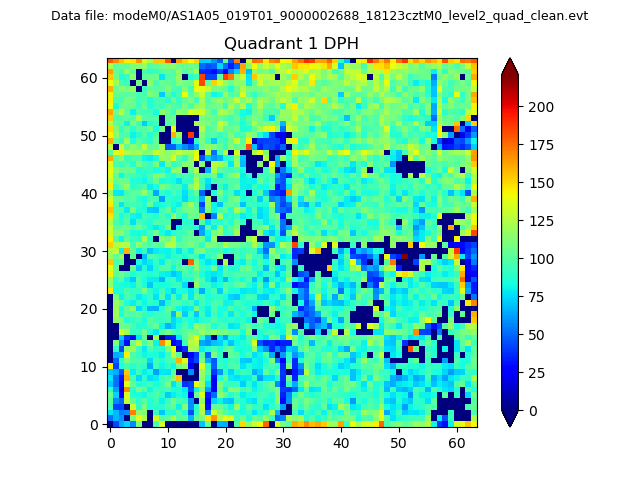 |
Quadrant B |
|---|---|---|---|
| Quadrant D | 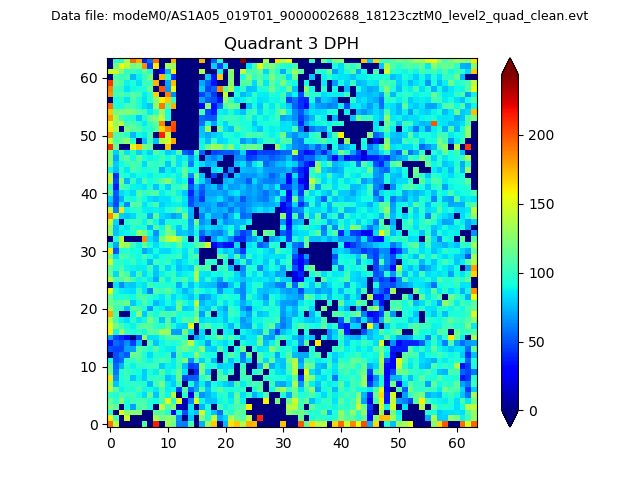 |
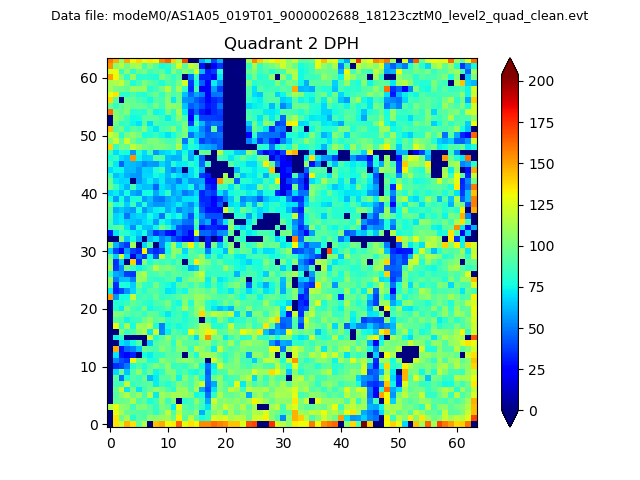 |
Quadrant C |
| Plot type | Count rate plots | Images |
|---|---|---|
| Comparison with Poisson distribution Blue bars denote a histogram of data divided into 1 sec bins. Red curve is a Poisson curve with rate = median count rate of data. |
 |
 |
| Quadrant-wise count rates Data is divided into 100 sec bins |
 |
|
| Module-wise count rates for Quadrant A Data is divided into 100 sec bins |
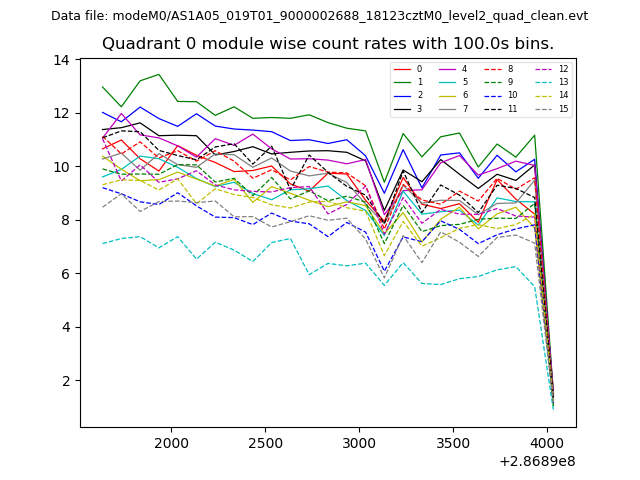 |
 |
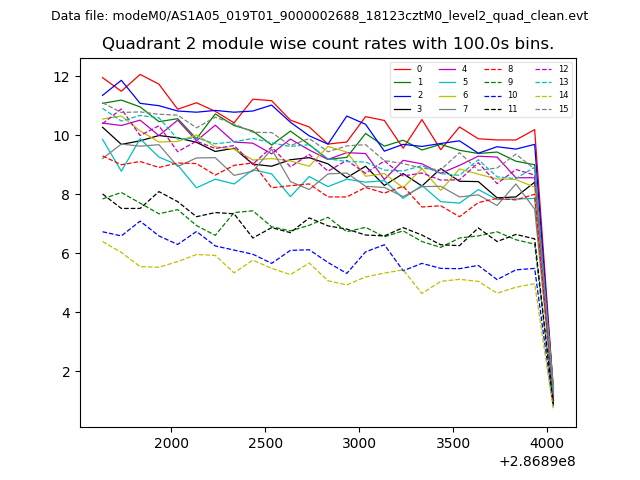
| Module-wise count rates for Quadrant B Data is divided into 100 sec bins |
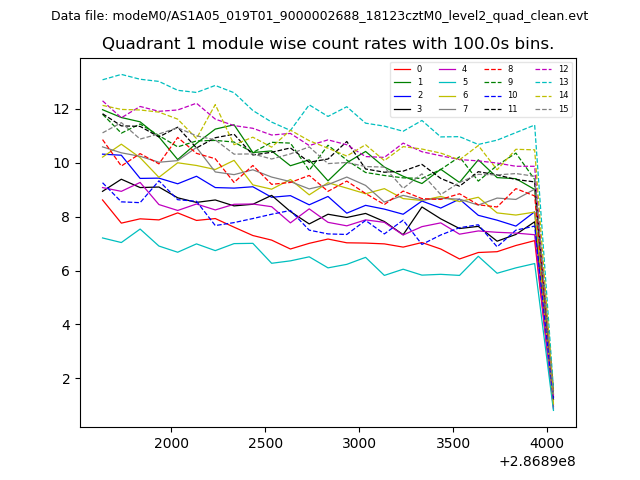 |
 |
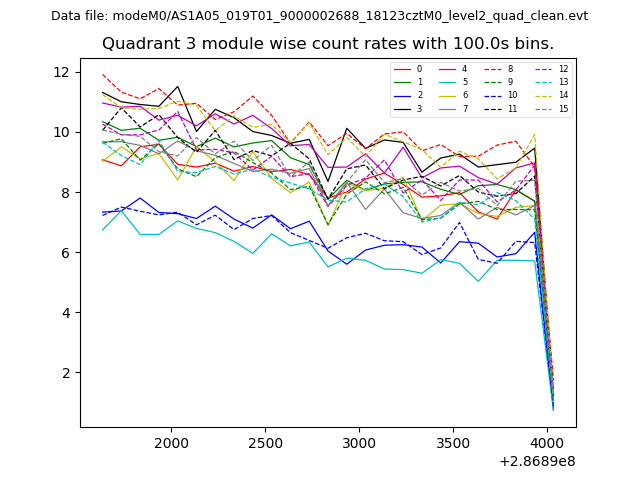
| Module-wise count rates for Quadrant C Data is divided into 100 sec bins |
 |
 |
| Module-wise count rates for Quadrant D Data is divided into 100 sec bins |
 |
 |
| Parameter | Plot |
|---|---|
| CZT HV Monitor | 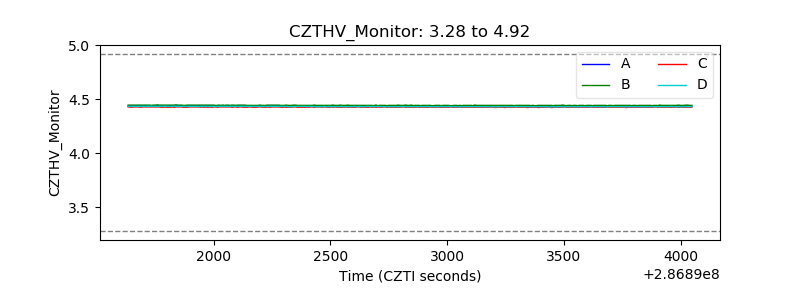 |
| D_VDD | 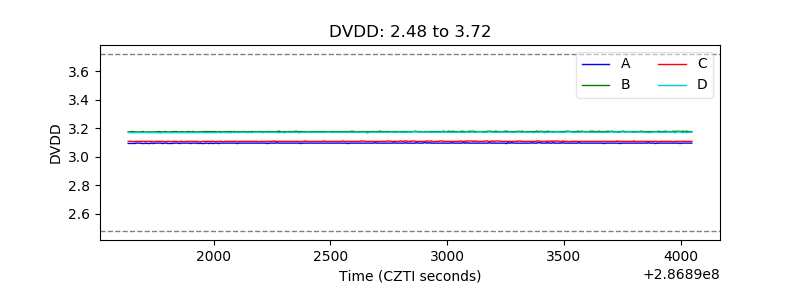 |
| Temperature 1 | 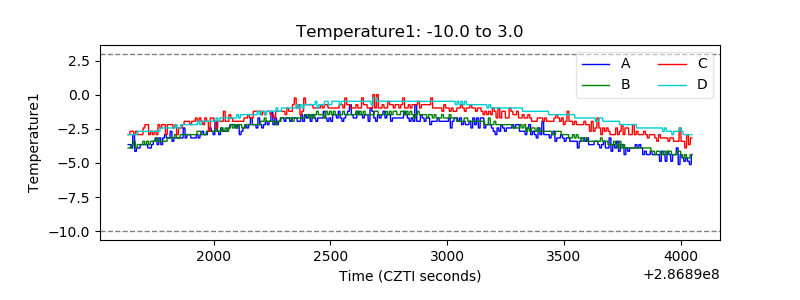 |
| Veto HV Monitor | 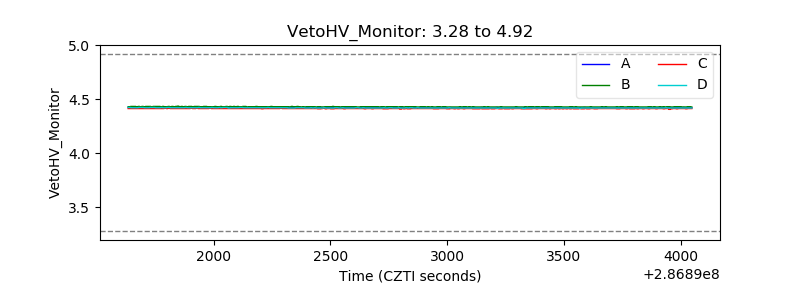 |
| Veto LLD | 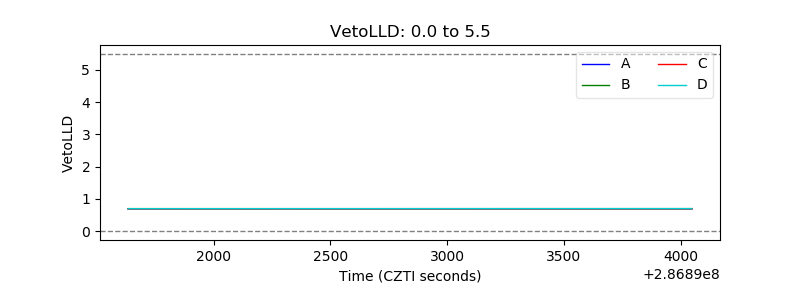 |
| Alpha Counter | 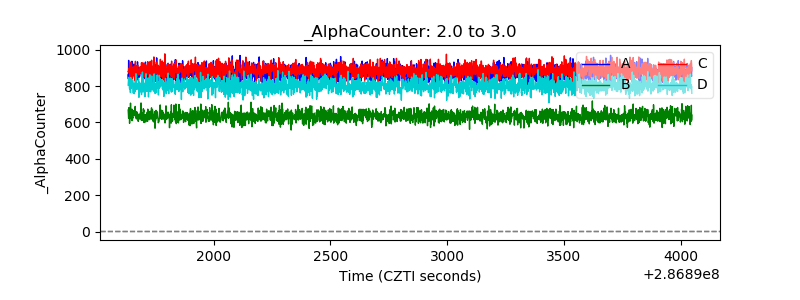 |
| _CPM_Rate |  |
| CZT Counter | 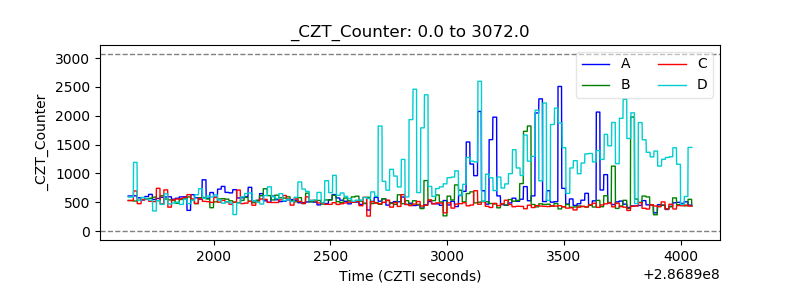 |
| +2.5 Volts monitor |  |
| +5 Volts monitor | 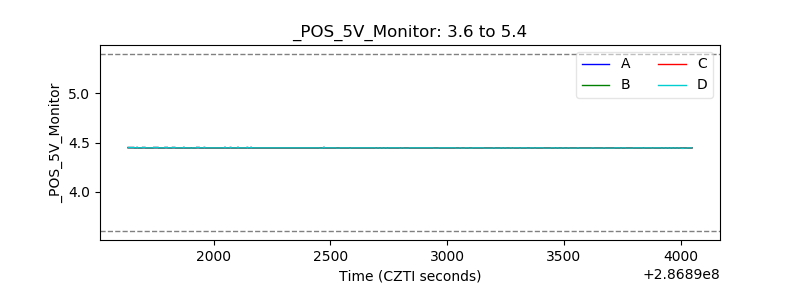 |
| _ROLL_ROT | 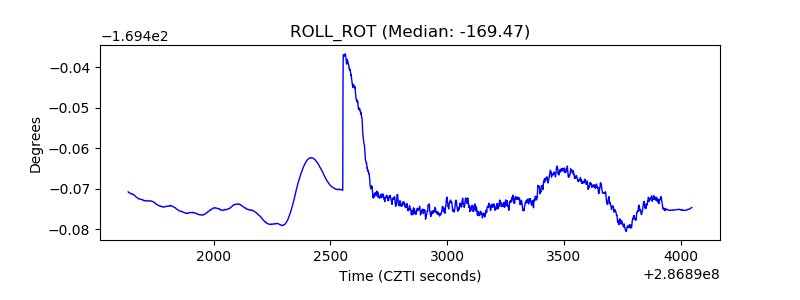 |
| _Roll_DEC | 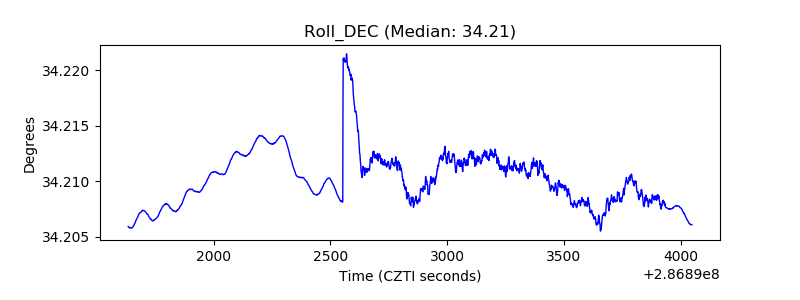 |
| _Roll_RA | 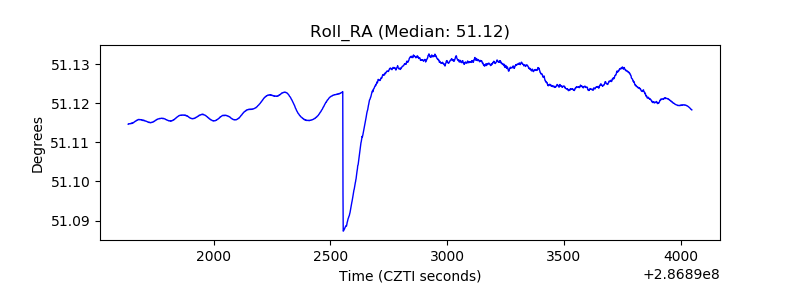 |
| Veto Counter | 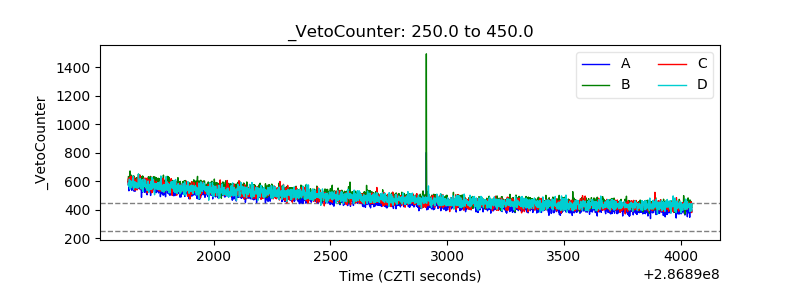 |