| Param | Original file | Final file |
|---|---|---|
| Filename | modeM0/AS1T03_080T01_9000002686_18087cztM0_level2.evt | modeM0/AS1T03_080T01_9000002686_18087cztM0_level2_quad_clean.evt |
| Size (bytes) | 720,967,680 | 210,055,680 |
| Size | 687.6 MB | 200.3 MB |
| Events in quadrant A | 5,072,044 | 1,450,896 |
| Events in quadrant B | 5,047,156 | 1,403,978 |
| Events in quadrant C | 4,985,949 | 1,382,905 |
| Events in quadrant D | 6,008,128 | 1,388,167 |
| Mode M9 | |||
|---|---|---|---|
| Quadrant | BADHDUFLAG | Total packets | Discarded packets |
| A | 0 | 15 | 0 |
| B | 0 | 15 | 0 |
| C | 0 | 15 | 0 |
| D | 0 | 15 | 0 |
| Mode SS | |||
|---|---|---|---|
| Quadrant | BADHDUFLAG | Total packets | Discarded packets |
| A | 0 | 218 | 0 |
| B | 0 | 218 | 0 |
| C | 0 | 218 | 0 |
| D | 0 | 218 | 0 |
| Mode M0 | |||
|---|---|---|---|
| Quadrant | BADHDUFLAG | Total packets | Discarded packets |
| A | 0 | 22550 | 2 |
| B | 0 | 22352 | 2 |
| C | 0 | 22286 | 2 |
| D | 0 | 25700 | 2 |
| Quadrant | Total seconds | Saturated seconds | Saturation percentage |
|---|---|---|---|
| A | 10634 | 50 | 0.470190% |
| B | 10634 | 86 | 0.808727% |
| C | 10634 | 111 | 1.043822% |
| D | 10634 | 284 | 2.670679% |
Noise dominated data is calculated using 1-second bins in cleaned event files. If a bin has >2000 counts, and if more than 50% of those come from <1% of pixels, then it is considered to be noise-dominated and hence unusable.
| Quadrant | # 1 sec bins | Bins with >0 counts | Bins with >2000 counts | High rate bins dominated by noise | Noise dominated (total time) | Noise dominated (detector-on time) | Marked lightcurve |
|---|---|---|---|---|---|---|---|
| A | 12189 | 10636 | 0 | 0 | 0.00% | 0.00% | 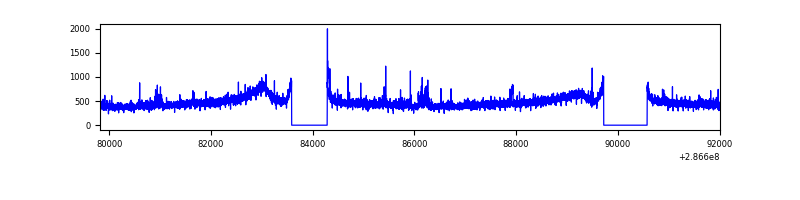 |
| B | 12189 | 10636 | 7 | 7 | 0.06% | 0.07% | 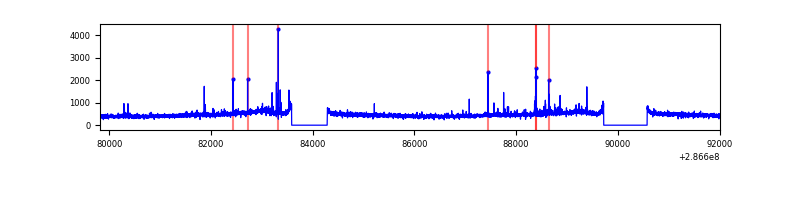 |
| C | 12189 | 10636 | 0 | 0 | 0.00% | 0.00% | 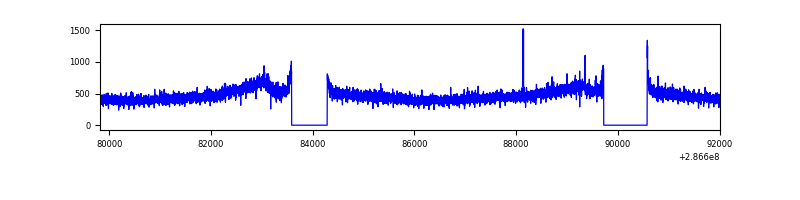 |
| D | 12189 | 10636 | 249 | 249 | 2.04% | 2.34% | 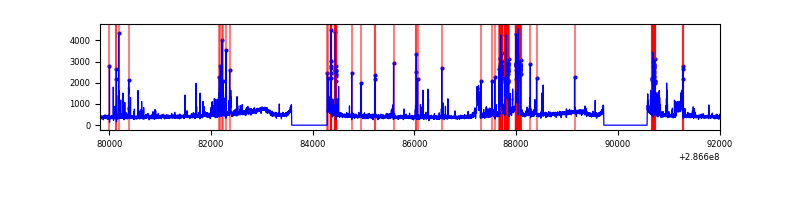 |
Top three noisy pixels from each quadrant. If the there are fewer than three noisy pixels in the level2.evt file, extra rows are filled as -1
| Pixel properties | Quadrant properties | ||||||
|---|---|---|---|---|---|---|---|
| Quadrant | DetID | PixID | Counts | Sigma | Mean | Median | Sigma |
| A | 4 | 2 | 38296 | 142.87 | 1283 | 1259 | 259.2 |
| A | 15 | 174 | 33968 | 126.18 | 1283 | 1259 | 259.2 |
| A | 14 | 111 | 32276 | 119.65 | 1283 | 1259 | 259.2 |
| B | 7 | 220 | 39371 | 159.75 | 1256 | 1227 | 238.8 |
| B | 0 | 189 | 33948 | 137.04 | 1256 | 1227 | 238.8 |
| B | 12 | 111 | 28553 | 114.45 | 1256 | 1227 | 238.8 |
| C | 14 | 238 | 188618 | 653.24 | 1212 | 1221 | 286.9 |
| C | 3 | 233 | 58074 | 198.18 | 1212 | 1221 | 286.9 |
| C | 13 | 61 | 8492 | 25.35 | 1212 | 1221 | 286.9 |
| D | 11 | 176 | 1067329 | 3497.73 | 1234 | 1202 | 304.8 |
| D | 10 | 70 | 128754 | 418.47 | 1234 | 1202 | 304.8 |
| D | 5 | 222 | 63351 | 203.9 | 1234 | 1202 | 304.8 |
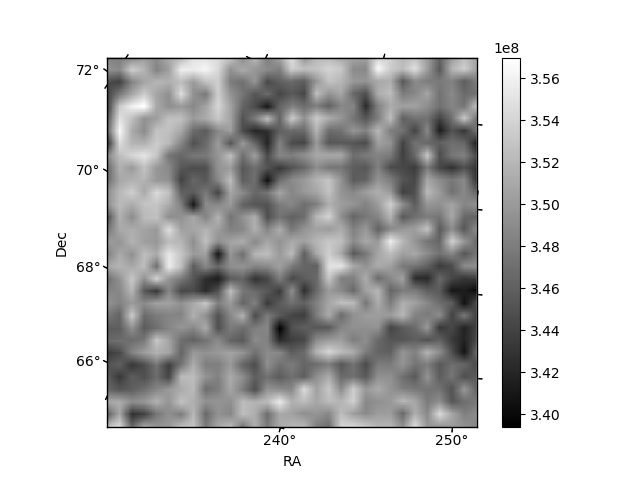
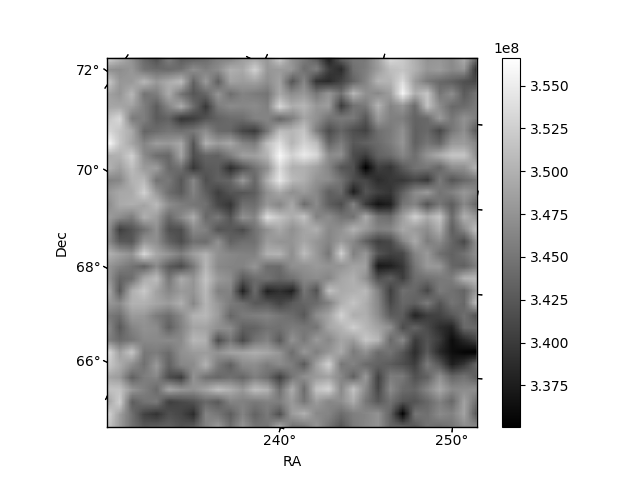
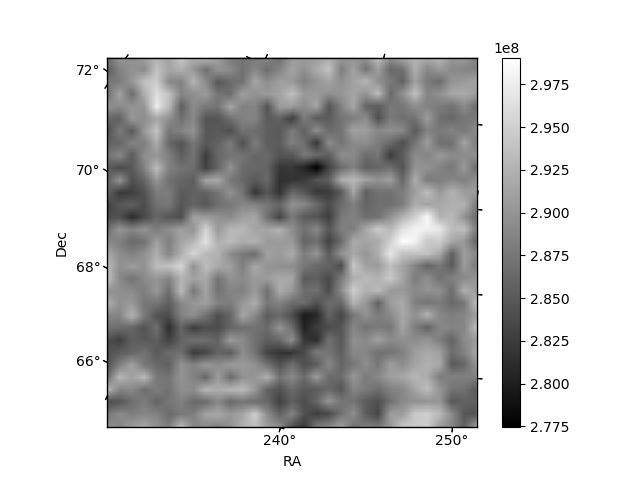
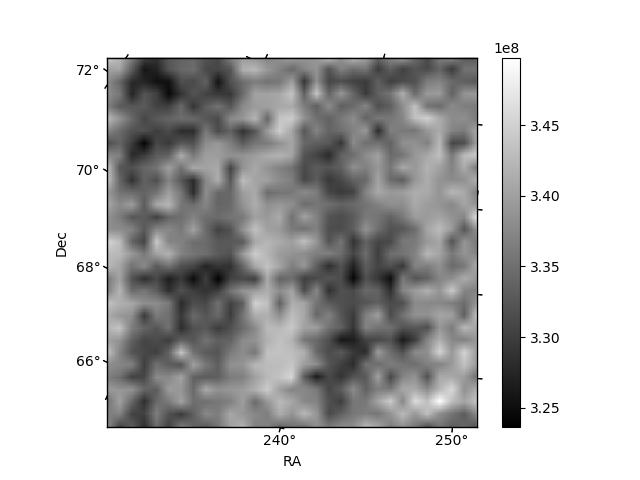
Histogram calculated using DETX and DETY for each event in the final _common_clean file
| Quadrant A | 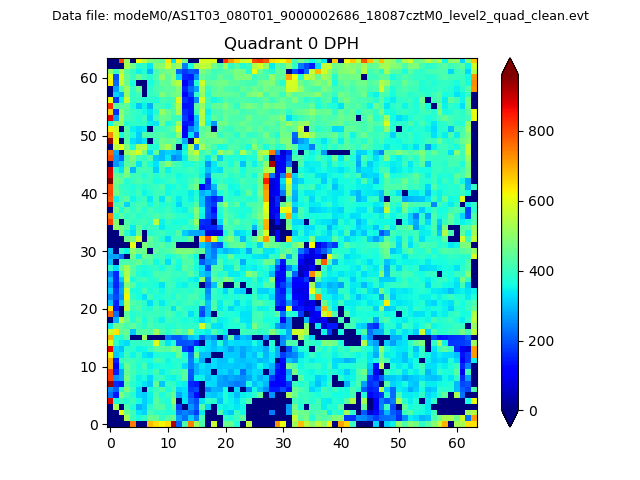 |
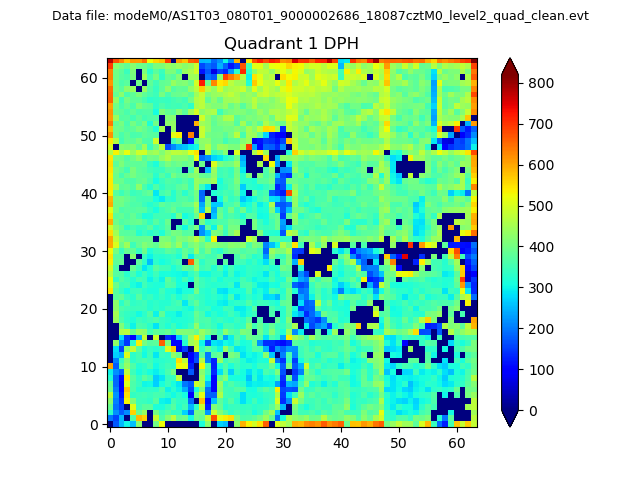 |
Quadrant B |
|---|---|---|---|
| Quadrant D |  |
 |
Quadrant C |
| Plot type | Count rate plots | Images |
|---|---|---|
| Comparison with Poisson distribution Blue bars denote a histogram of data divided into 1 sec bins. Red curve is a Poisson curve with rate = median count rate of data. |
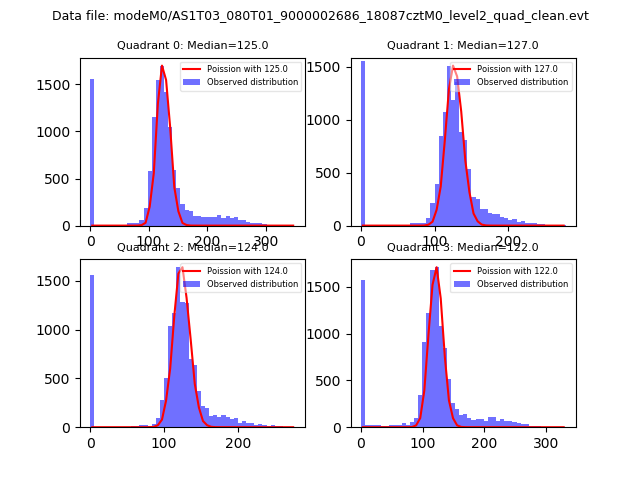 |
 |
| Quadrant-wise count rates Data is divided into 100 sec bins |
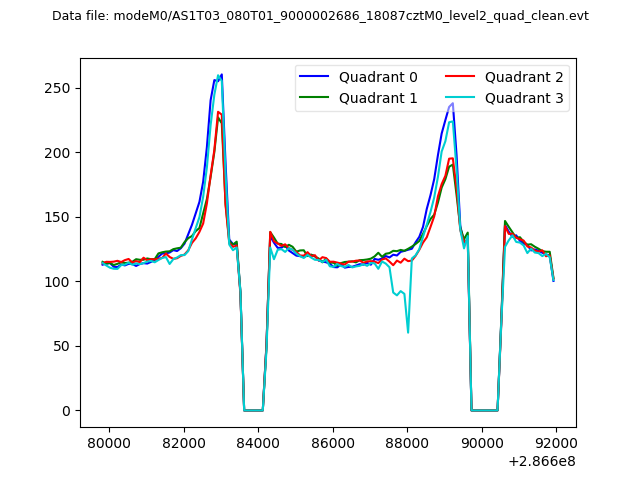 |
|
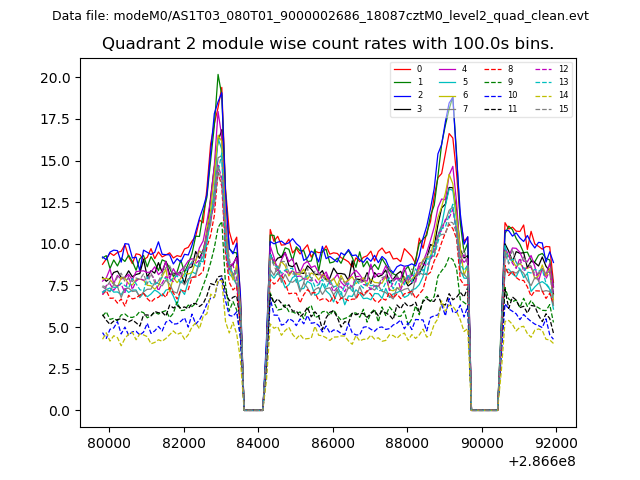
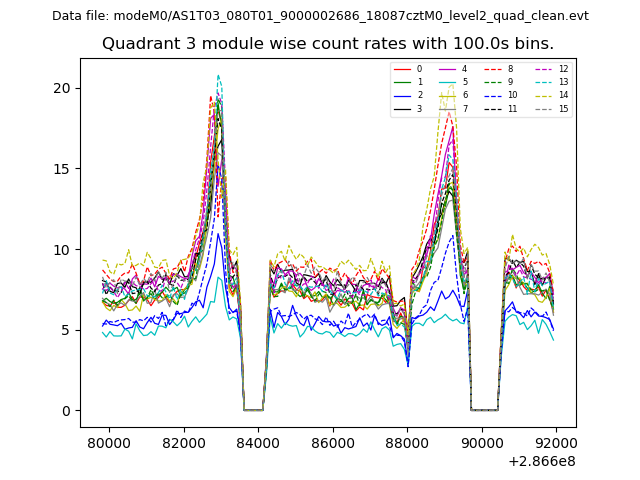
| Module-wise count rates for Quadrant A Data is divided into 100 sec bins |
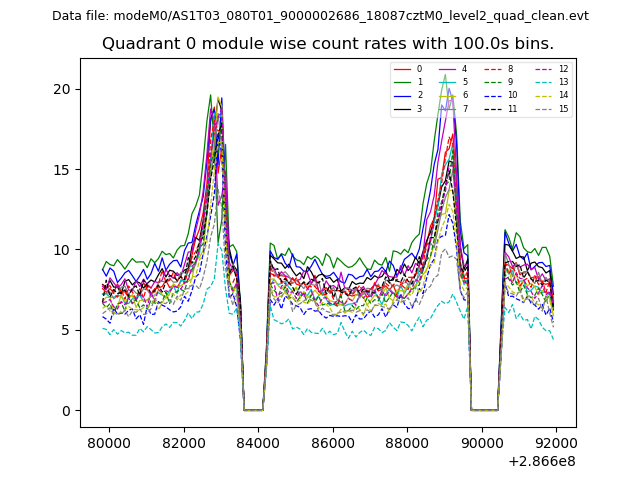 |
 |
| Module-wise count rates for Quadrant B Data is divided into 100 sec bins |
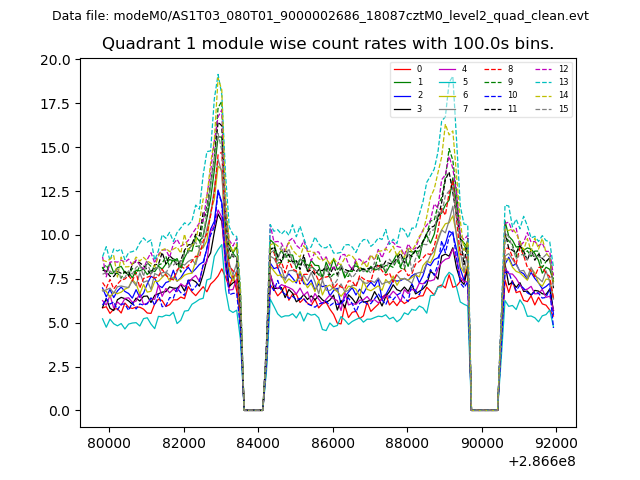 |
 |
| Module-wise count rates for Quadrant C Data is divided into 100 sec bins |
 |
 |
| Module-wise count rates for Quadrant D Data is divided into 100 sec bins |
 |
 |
| Parameter | Plot |
|---|---|
| CZT HV Monitor | 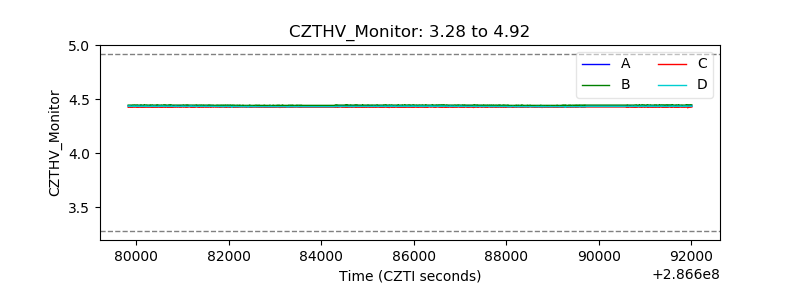 |
| D_VDD | 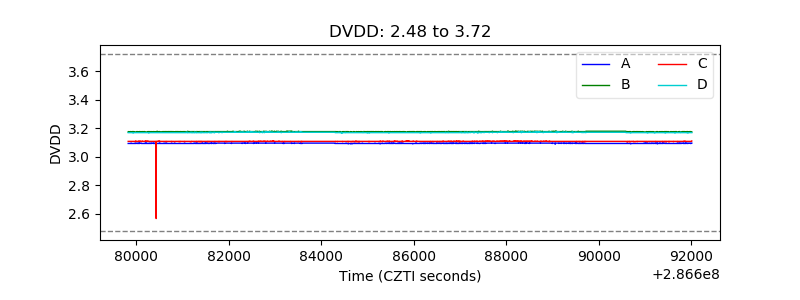 |
| Temperature 1 | 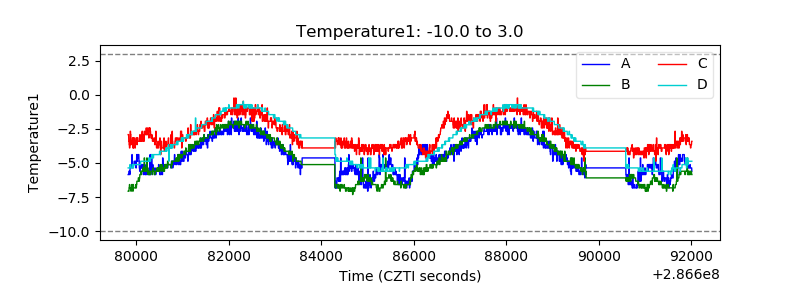 |
| Veto HV Monitor |  |
| Veto LLD | 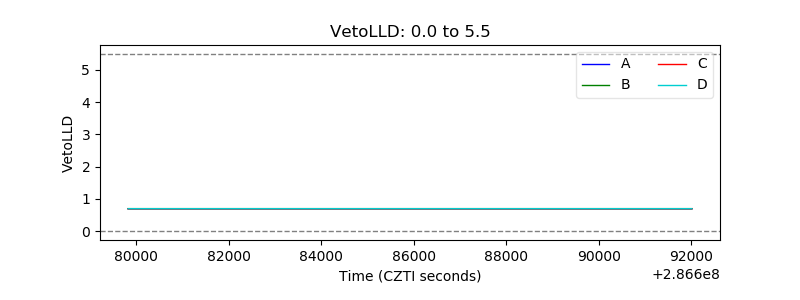 |
| Alpha Counter | 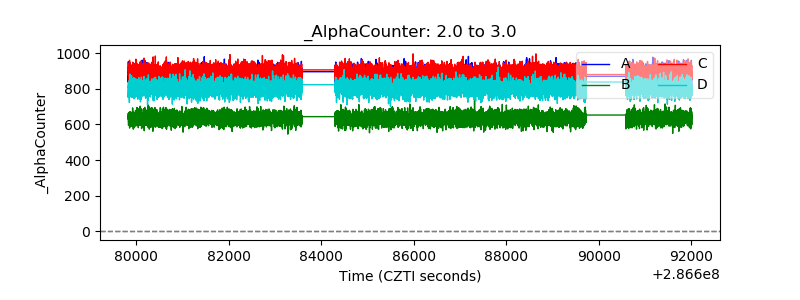 |
| _CPM_Rate | 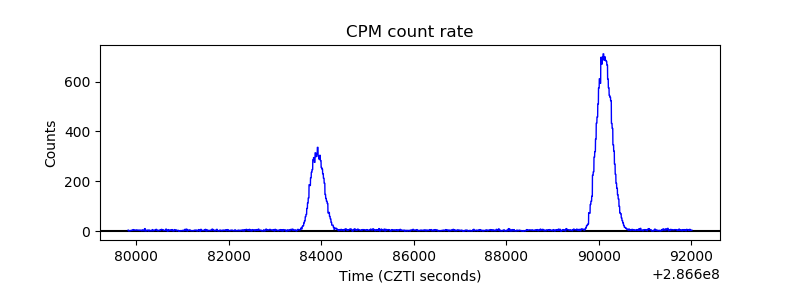 |
| CZT Counter | 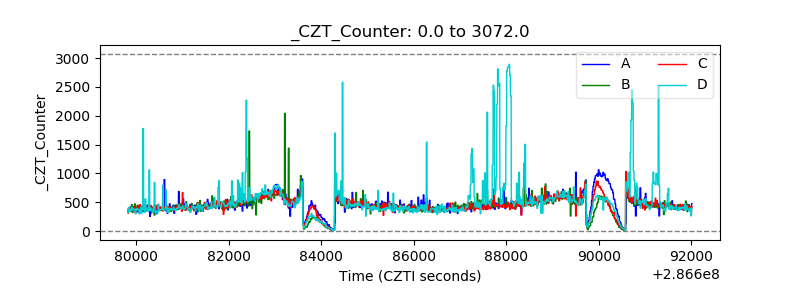 |
| +2.5 Volts monitor |  |
| +5 Volts monitor |  |
| _ROLL_ROT | 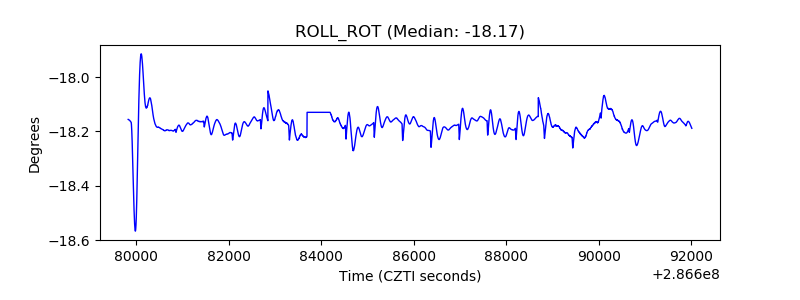 |
| _Roll_DEC | 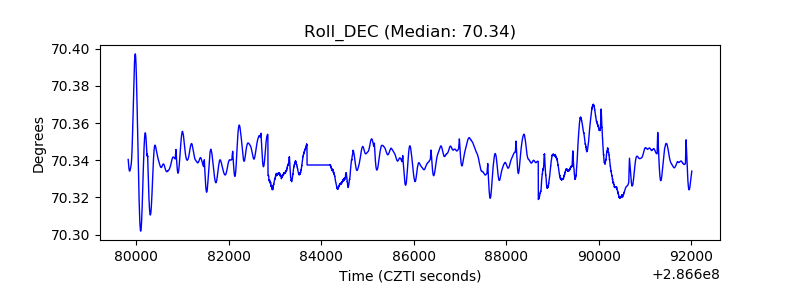 |
| _Roll_RA | 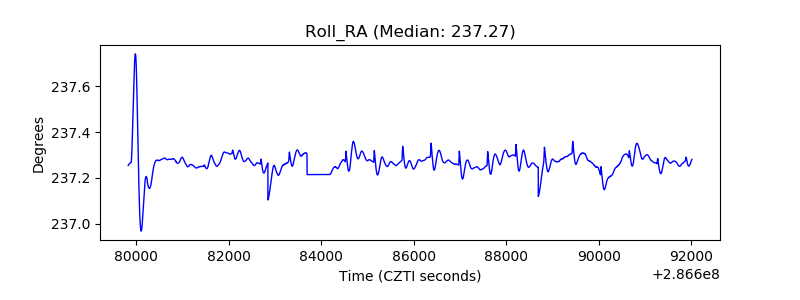 |
| Veto Counter | 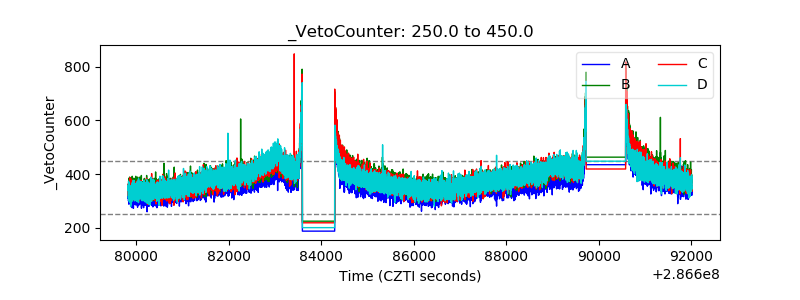 |