| Param | Original file | Final file |
|---|---|---|
| Filename | modeM0/AS1T03_080T01_9000002686_18088cztM0_level2.evt | modeM0/AS1T03_080T01_9000002686_18088cztM0_level2_quad_clean.evt |
| Size (bytes) | 401,595,840 | 120,119,040 |
| Size | 383.0 MB | 114.6 MB |
| Events in quadrant A | 2,981,352 | 813,432 |
| Events in quadrant B | 2,900,189 | 813,048 |
| Events in quadrant C | 2,845,898 | 789,444 |
| Events in quadrant D | 3,011,859 | 788,339 |
| Mode M9 | |||
|---|---|---|---|
| Quadrant | BADHDUFLAG | Total packets | Discarded packets |
| A | 0 | 10 | 0 |
| B | 0 | 10 | 0 |
| C | 0 | 10 | 0 |
| D | 0 | 10 | 0 |
| Mode SS | |||
|---|---|---|---|
| Quadrant | BADHDUFLAG | Total packets | Discarded packets |
| A | 0 | 126 | 0 |
| B | 0 | 126 | 0 |
| C | 0 | 126 | 0 |
| D | 0 | 126 | 0 |
| Mode M0 | |||
|---|---|---|---|
| Quadrant | BADHDUFLAG | Total packets | Discarded packets |
| A | 0 | 13011 | 1 |
| B | 0 | 12708 | 1 |
| C | 0 | 12649 | 1 |
| D | 0 | 13334 | 1 |
| Quadrant | Total seconds | Saturated seconds | Saturation percentage |
|---|---|---|---|
| A | 6217 | 43 | 0.691652% |
| B | 6217 | 41 | 0.659482% |
| C | 6218 | 47 | 0.755870% |
| D | 6218 | 40 | 0.643294% |
Noise dominated data is calculated using 1-second bins in cleaned event files. If a bin has >2000 counts, and if more than 50% of those come from <1% of pixels, then it is considered to be noise-dominated and hence unusable.
| Quadrant | # 1 sec bins | Bins with >0 counts | Bins with >2000 counts | High rate bins dominated by noise | Noise dominated (total time) | Noise dominated (detector-on time) | Marked lightcurve |
|---|---|---|---|---|---|---|---|
| A | 7222 | 6218 | 1 | 1 | 0.01% | 0.02% | 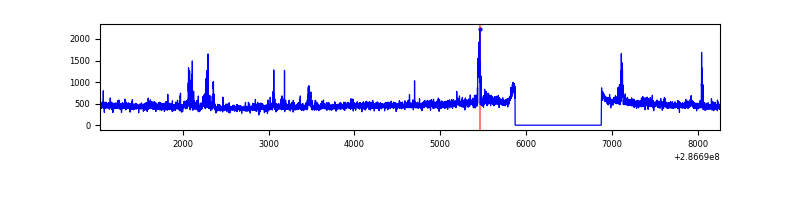 |
| B | 7222 | 6218 | 0 | 0 | 0.00% | 0.00% | 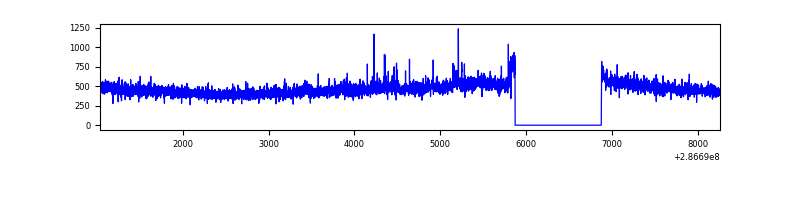 |
| C | 7223 | 6219 | 0 | 0 | 0.00% | 0.00% | 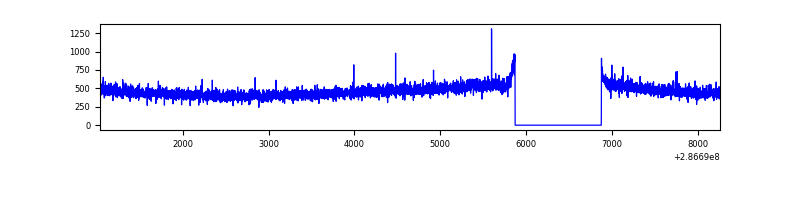 |
| D | 7223 | 6219 | 17 | 17 | 0.24% | 0.27% | 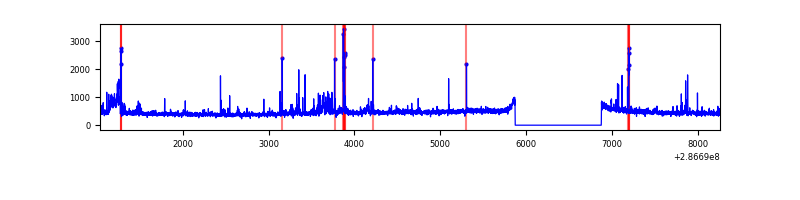 |
Top three noisy pixels from each quadrant. If the there are fewer than three noisy pixels in the level2.evt file, extra rows are filled as -1
| Pixel properties | Quadrant properties | ||||||
|---|---|---|---|---|---|---|---|
| Quadrant | DetID | PixID | Counts | Sigma | Mean | Median | Sigma |
| A | 4 | 2 | 123776 | 833.79 | 735 | 720 | 147.6 |
| A | 15 | 174 | 31818 | 210.71 | 735 | 720 | 147.6 |
| A | 0 | 226 | 6394 | 38.45 | 735 | 720 | 147.6 |
| B | 0 | 189 | 20505 | 142.93 | 727 | 709 | 138.5 |
| B | 12 | 111 | 16340 | 112.86 | 727 | 709 | 138.5 |
| B | 11 | 111 | 14281 | 97.99 | 727 | 709 | 138.5 |
| C | 14 | 238 | 109348 | 658.87 | 697 | 699 | 164.9 |
| C | 3 | 233 | 12433 | 71.16 | 697 | 699 | 164.9 |
| C | 9 | 160 | 5724 | 30.47 | 697 | 699 | 164.9 |
| D | 11 | 176 | 276845 | 1594.1 | 710 | 688 | 173.2 |
| D | 2 | 234 | 24172 | 135.56 | 710 | 688 | 173.2 |
| D | 2 | 152 | 16152 | 89.26 | 710 | 688 | 173.2 |
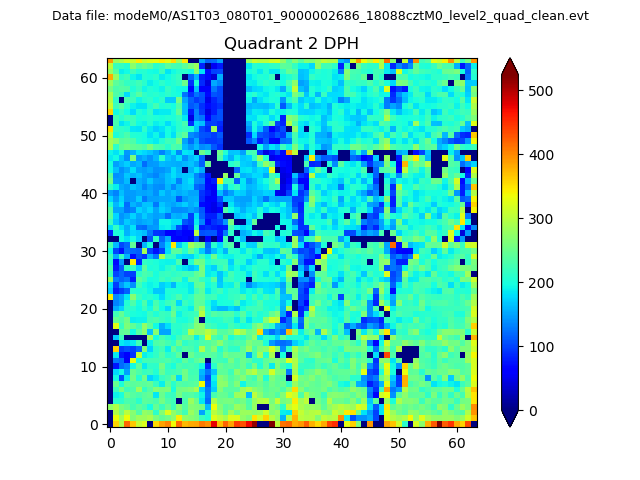
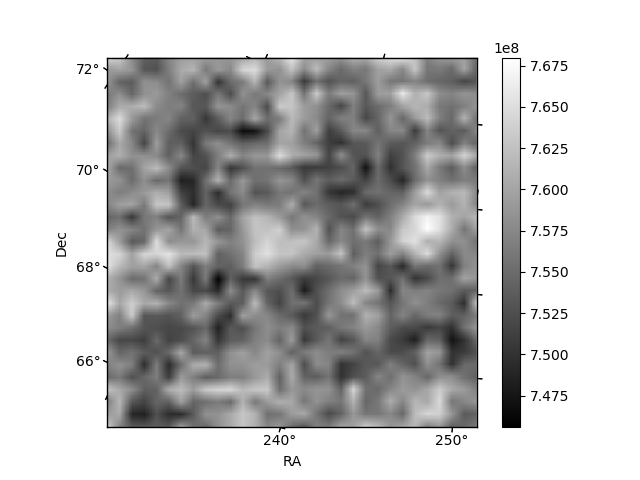
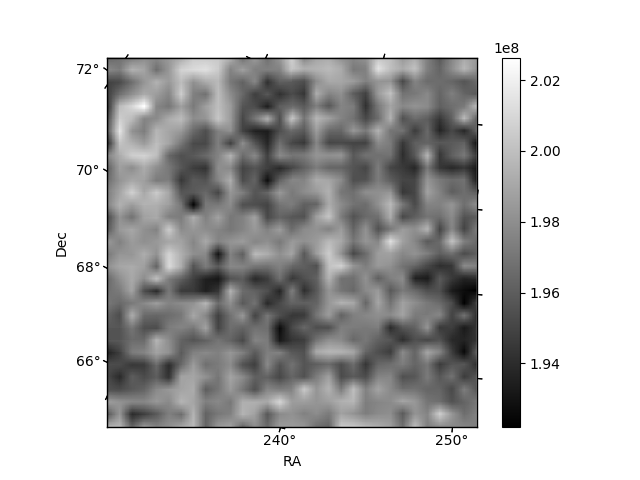
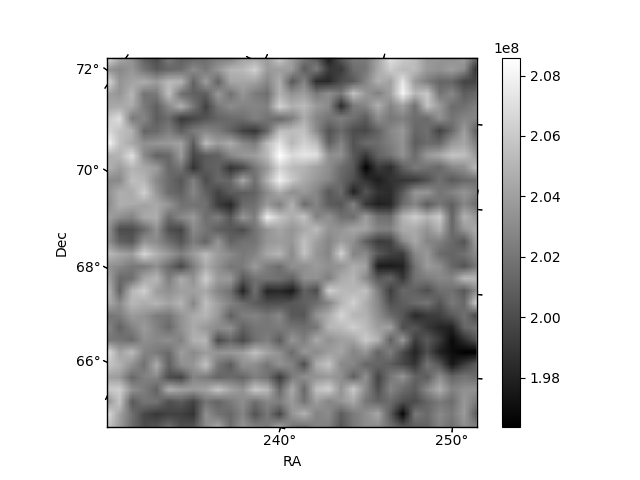
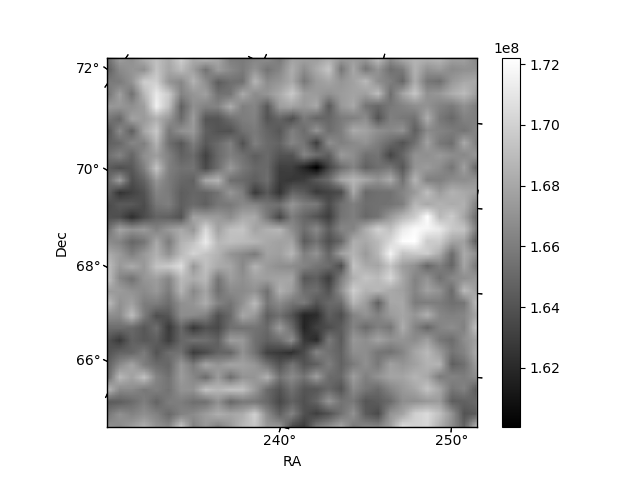
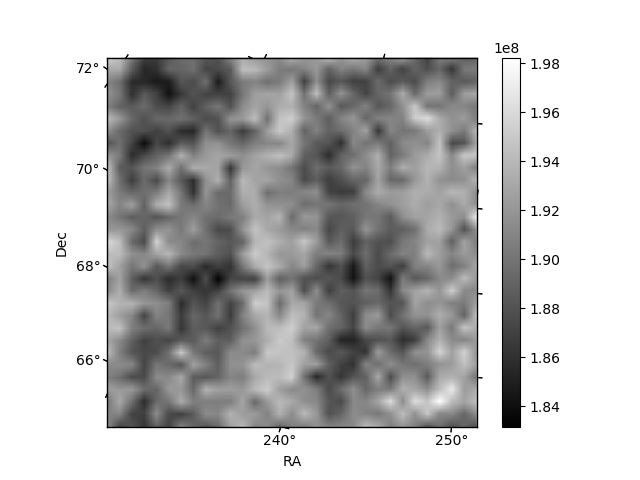
Histogram calculated using DETX and DETY for each event in the final _common_clean file
| Quadrant A | 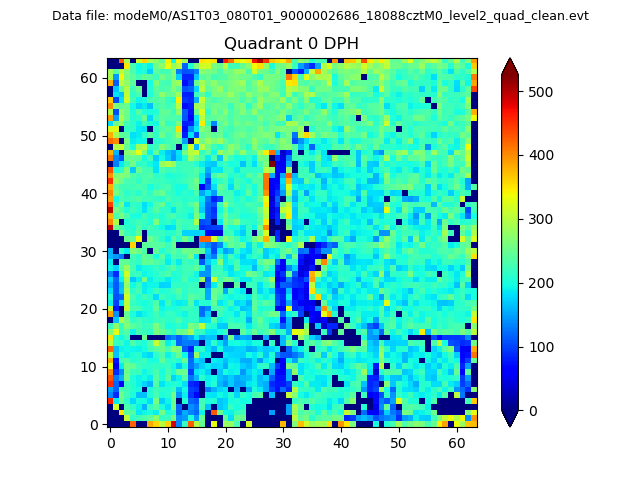 |
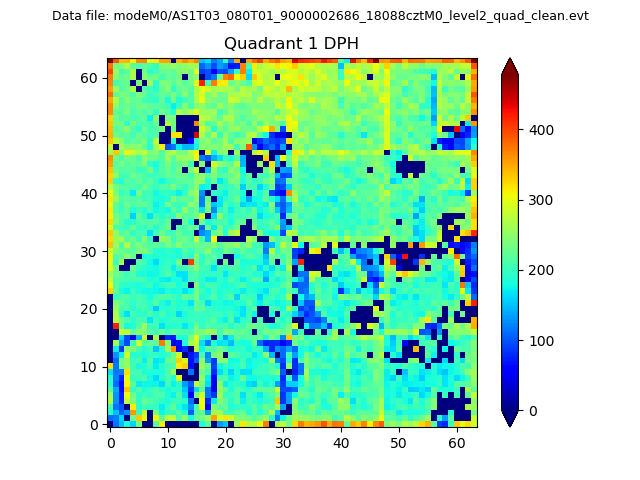 |
Quadrant B |
|---|---|---|---|
| Quadrant D | 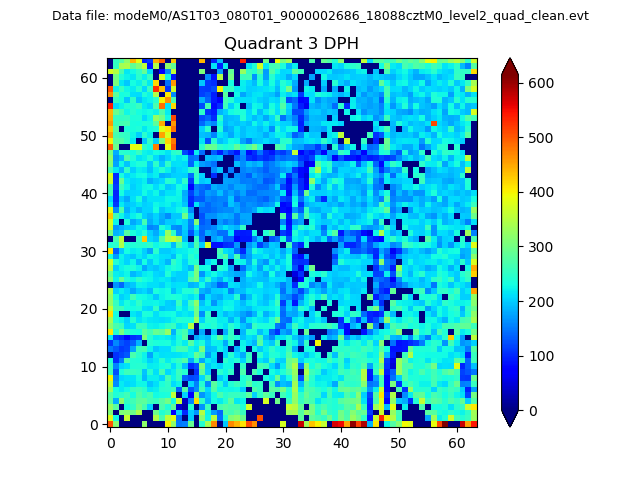 |
 |
Quadrant C |
| Plot type | Count rate plots | Images |
|---|---|---|
| Comparison with Poisson distribution Blue bars denote a histogram of data divided into 1 sec bins. Red curve is a Poisson curve with rate = median count rate of data. |
 |
 |
| Quadrant-wise count rates Data is divided into 100 sec bins |
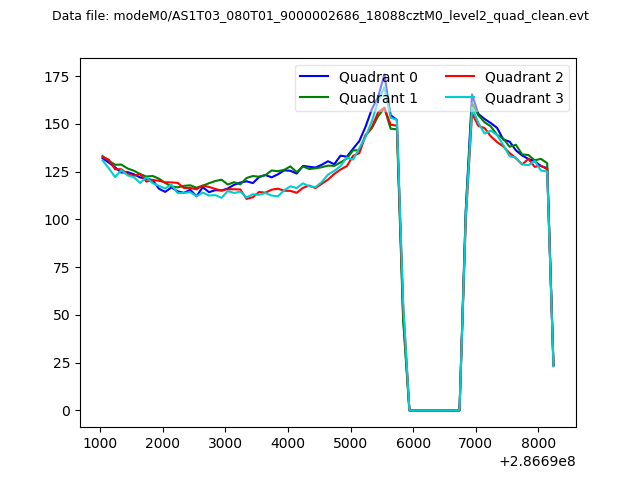 |
|
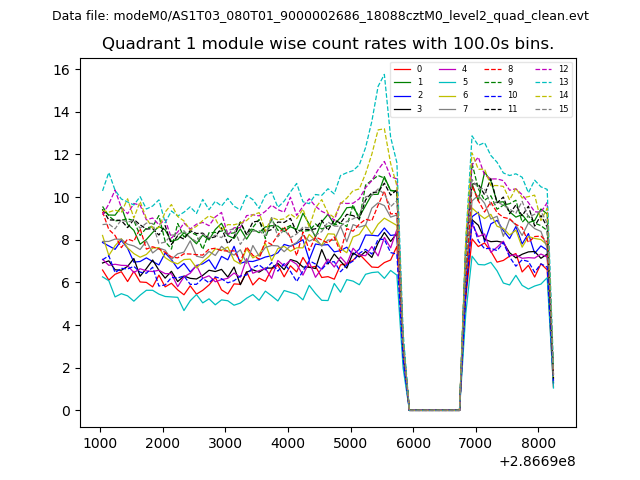
| Module-wise count rates for Quadrant A Data is divided into 100 sec bins |
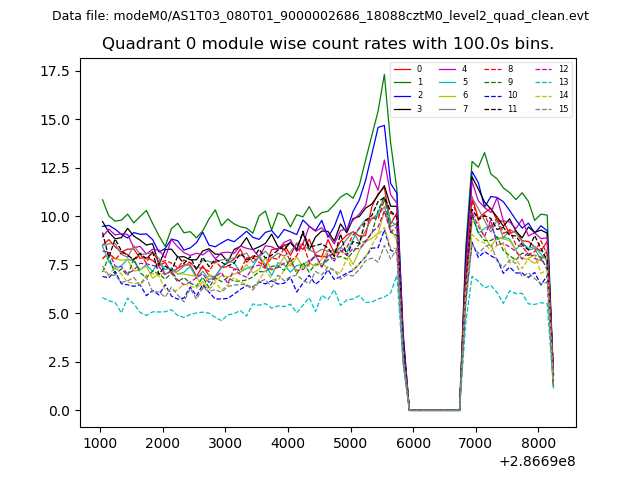 |
 |
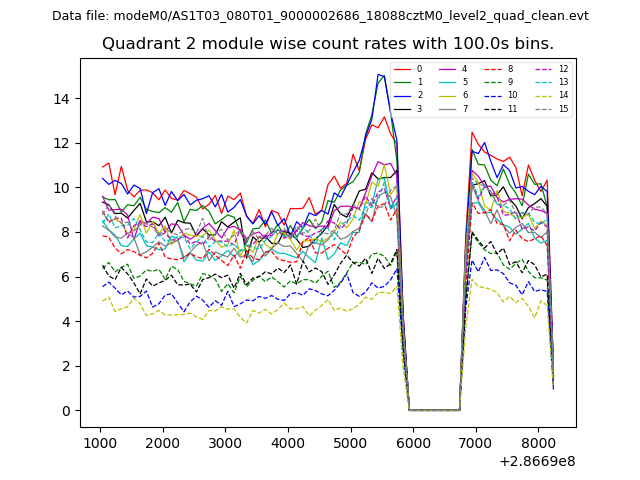
| Module-wise count rates for Quadrant B Data is divided into 100 sec bins |
 |
 |
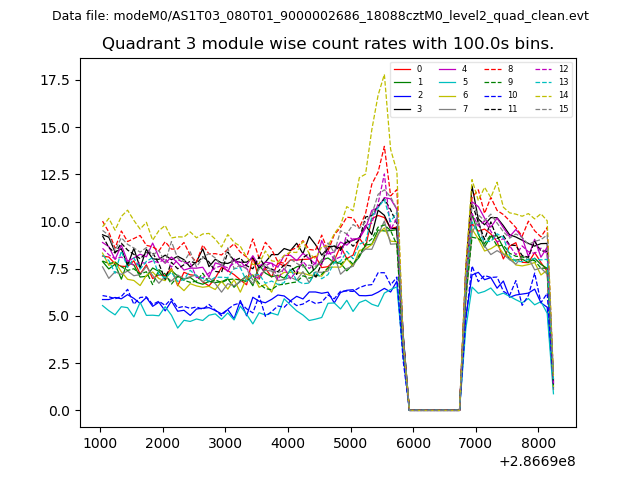
| Module-wise count rates for Quadrant C Data is divided into 100 sec bins |
 |
 |
| Module-wise count rates for Quadrant D Data is divided into 100 sec bins |
 |
 |
| Parameter | Plot |
|---|---|
| CZT HV Monitor | 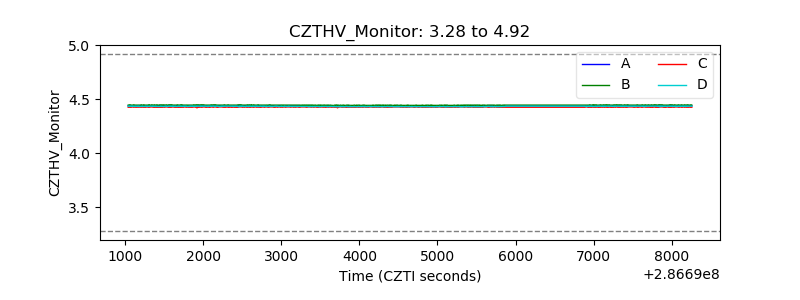 |
| D_VDD | 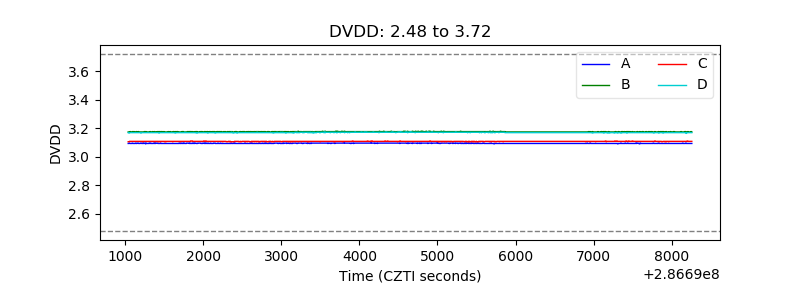 |
| Temperature 1 |  |
| Veto HV Monitor | 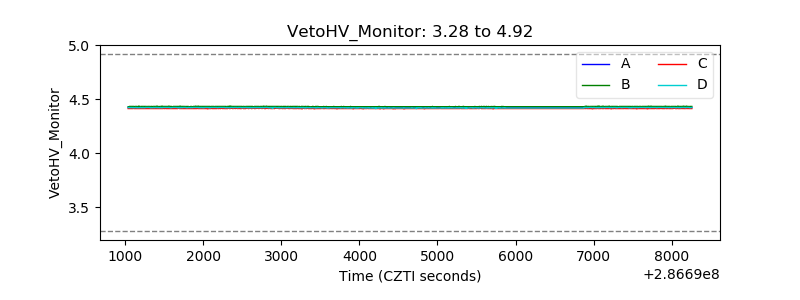 |
| Veto LLD | 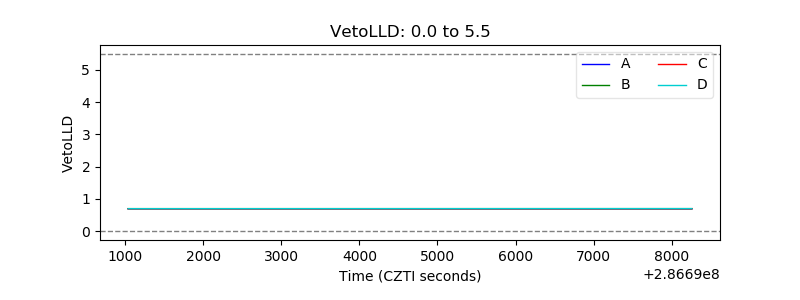 |
| Alpha Counter | 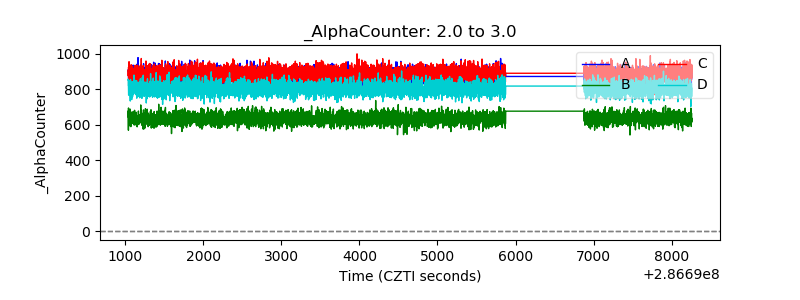 |
| _CPM_Rate | 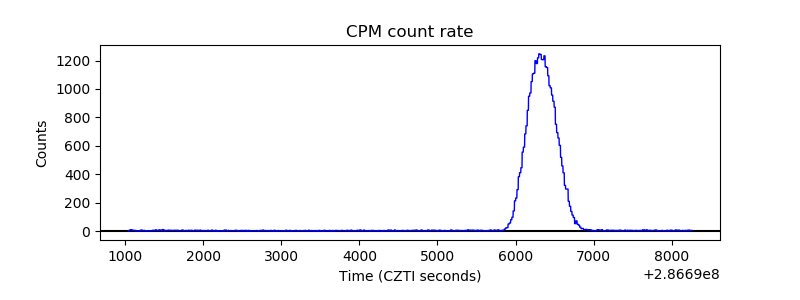 |
| CZT Counter | 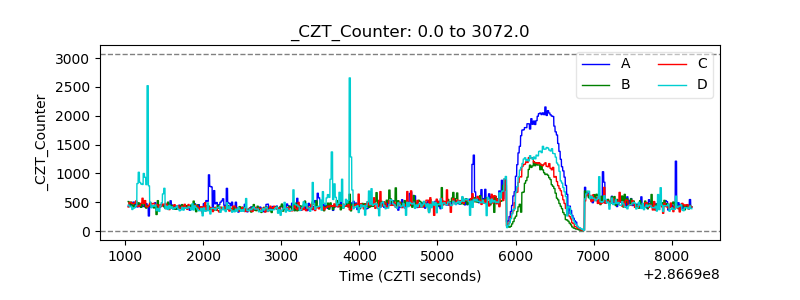 |
| +2.5 Volts monitor |  |
| +5 Volts monitor | 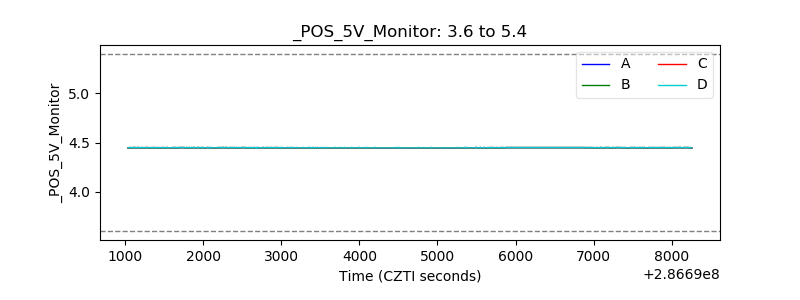 |
| _ROLL_ROT | 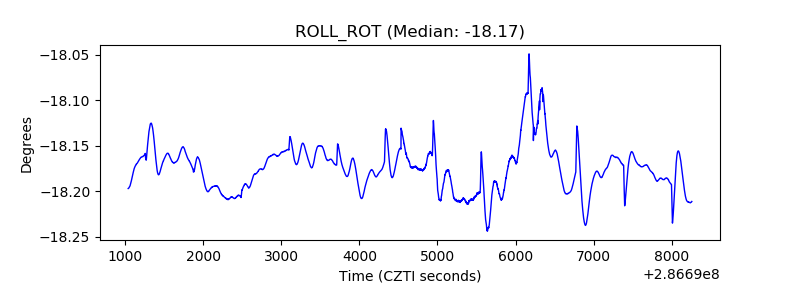 |
| _Roll_DEC | 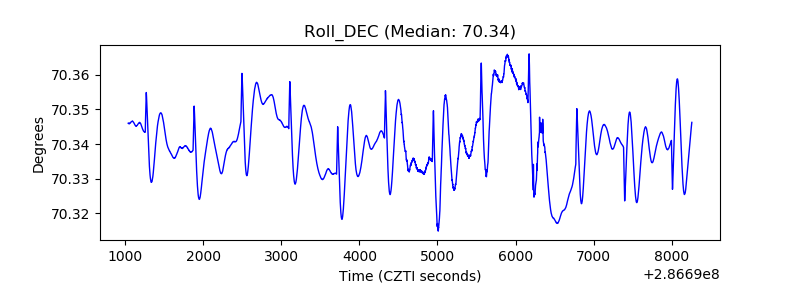 |
| _Roll_RA | 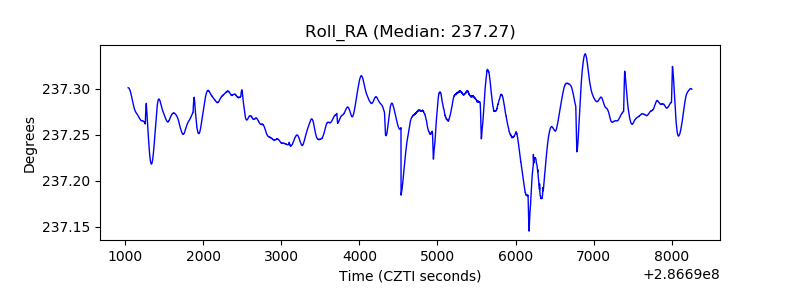 |
| Veto Counter | 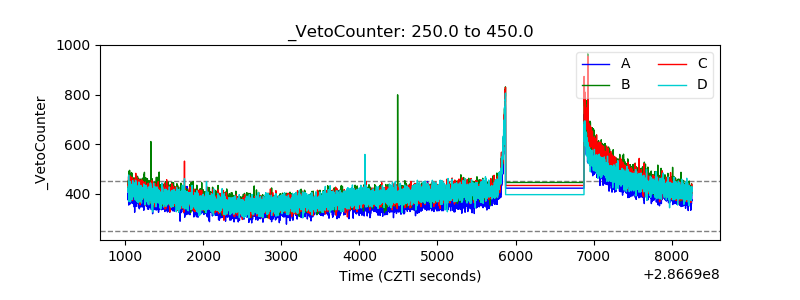 |