| Param | Original file | Final file |
|---|---|---|
| Filename | modeM0/AS1T03_080T01_9000002686_18091cztM0_level2.evt | modeM0/AS1T03_080T01_9000002686_18091cztM0_level2_quad_clean.evt |
| Size (bytes) | 406,008,000 | 119,419,200 |
| Size | 387.2 MB | 113.9 MB |
| Events in quadrant A | 3,030,477 | 815,948 |
| Events in quadrant B | 2,824,506 | 828,151 |
| Events in quadrant C | 2,789,293 | 790,673 |
| Events in quadrant D | 3,257,789 | 777,463 |
| Mode M9 | |||
|---|---|---|---|
| Quadrant | BADHDUFLAG | Total packets | Discarded packets |
| A | 0 | 13 | 0 |
| B | 0 | 13 | 0 |
| C | 0 | 13 | 0 |
| D | 0 | 13 | 0 |
| Mode SS | |||
|---|---|---|---|
| Quadrant | BADHDUFLAG | Total packets | Discarded packets |
| A | 0 | 116 | 0 |
| B | 0 | 116 | 0 |
| C | 0 | 116 | 0 |
| D | 0 | 116 | 0 |
| Mode M0 | |||
|---|---|---|---|
| Quadrant | BADHDUFLAG | Total packets | Discarded packets |
| A | 0 | 12631 | 1 |
| B | 0 | 11980 | 1 |
| C | 0 | 11909 | 1 |
| D | 0 | 13399 | 1 |
| Quadrant | Total seconds | Saturated seconds | Saturation percentage |
|---|---|---|---|
| A | 5794 | 153 | 2.640663% |
| B | 5795 | 37 | 0.638481% |
| C | 5795 | 47 | 0.811044% |
| D | 5795 | 146 | 2.519413% |
Noise dominated data is calculated using 1-second bins in cleaned event files. If a bin has >2000 counts, and if more than 50% of those come from <1% of pixels, then it is considered to be noise-dominated and hence unusable.
| Quadrant | # 1 sec bins | Bins with >0 counts | Bins with >2000 counts | High rate bins dominated by noise | Noise dominated (total time) | Noise dominated (detector-on time) | Marked lightcurve |
|---|---|---|---|---|---|---|---|
| A | 7029 | 5795 | 79 | 79 | 1.12% | 1.36% | 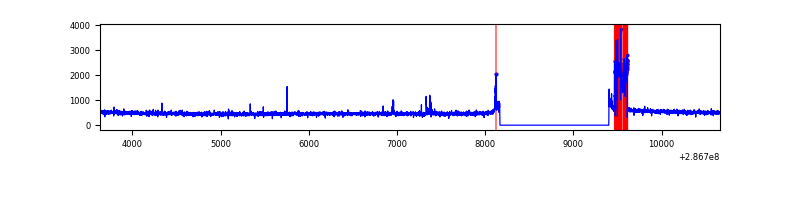 |
| B | 7030 | 5796 | 2 | 2 | 0.03% | 0.03% | 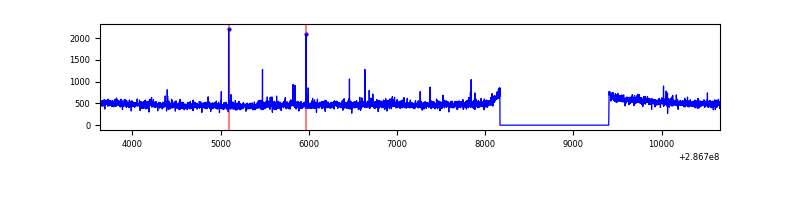 |
| C | 7030 | 5796 | 0 | 0 | 0.00% | 0.00% | 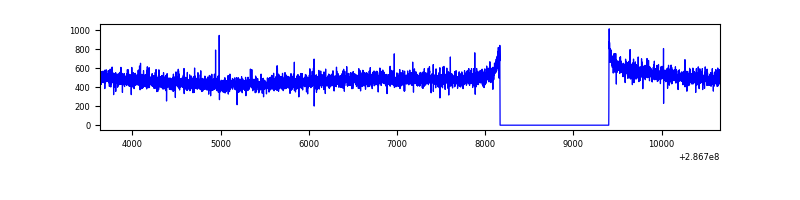 |
| D | 7030 | 5796 | 122 | 122 | 1.74% | 2.10% | 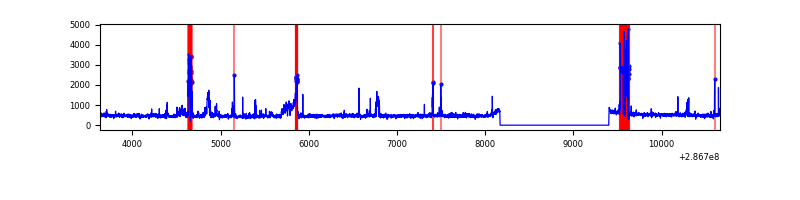 |
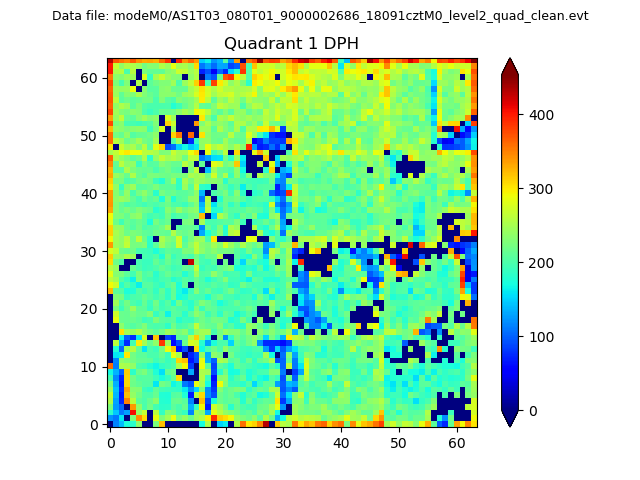
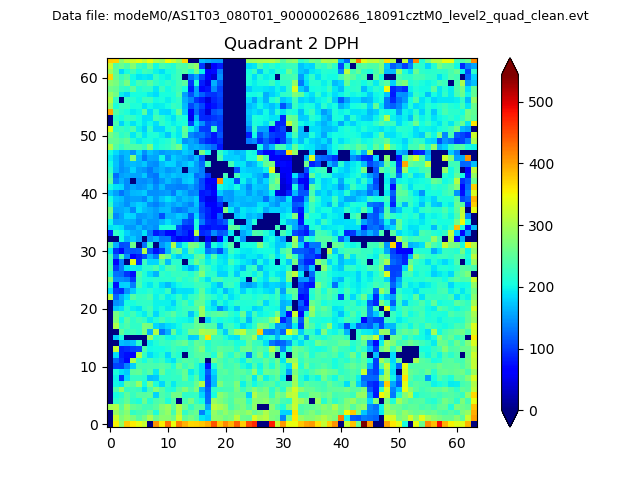
Top three noisy pixels from each quadrant. If the there are fewer than three noisy pixels in the level2.evt file, extra rows are filled as -1
| Pixel properties | Quadrant properties | ||||||
|---|---|---|---|---|---|---|---|
| Quadrant | DetID | PixID | Counts | Sigma | Mean | Median | Sigma |
| A | 14 | 4 | 231187 | 1611.38 | 716 | 703 | 143.0 |
| A | 4 | 2 | 21564 | 145.85 | 716 | 703 | 143.0 |
| A | 15 | 174 | 16794 | 112.5 | 716 | 703 | 143.0 |
| B | 12 | 111 | 15108 | 108.92 | 712 | 696 | 132.3 |
| B | 0 | 189 | 14147 | 101.65 | 712 | 696 | 132.3 |
| B | 11 | 111 | 13382 | 95.87 | 712 | 696 | 132.3 |
| C | 14 | 238 | 109261 | 692.55 | 682 | 687 | 156.8 |
| C | 3 | 233 | 13512 | 81.81 | 682 | 687 | 156.8 |
| C | 13 | 61 | 4916 | 26.98 | 682 | 687 | 156.8 |
| D | 11 | 176 | 599806 | 3596.82 | 692 | 673 | 166.6 |
| D | 2 | 234 | 22741 | 132.48 | 692 | 673 | 166.6 |
| D | 2 | 152 | 10511 | 59.06 | 692 | 673 | 166.6 |
Histogram calculated using DETX and DETY for each event in the final _common_clean file
| Quadrant A | 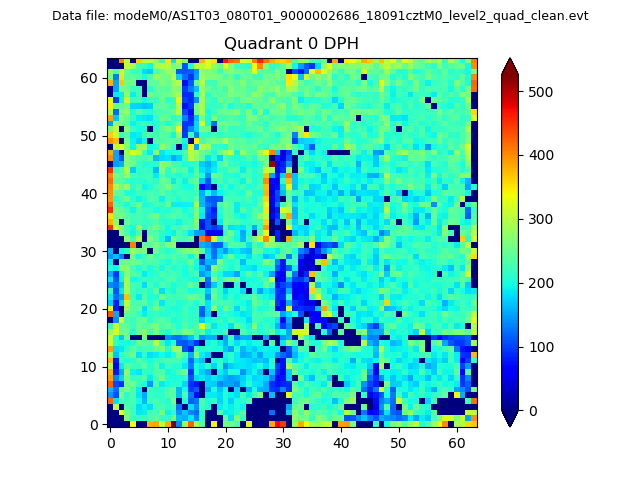 |
 |
Quadrant B |
|---|---|---|---|
| Quadrant D | 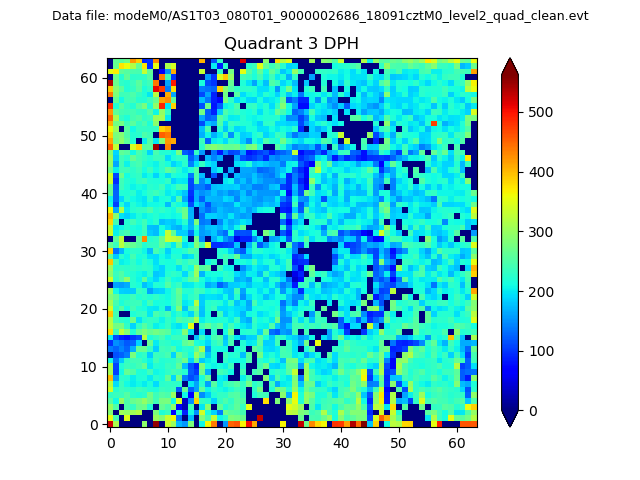 |
 |
Quadrant C |
| Plot type | Count rate plots | Images |
|---|---|---|
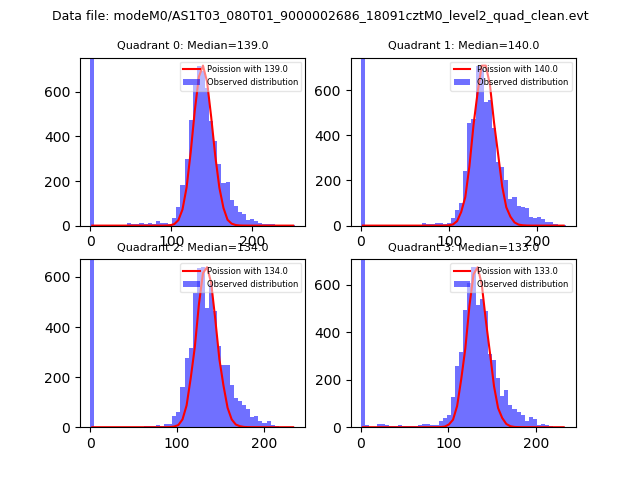
| Comparison with Poisson distribution Blue bars denote a histogram of data divided into 1 sec bins. Red curve is a Poisson curve with rate = median count rate of data. |
 |
 |
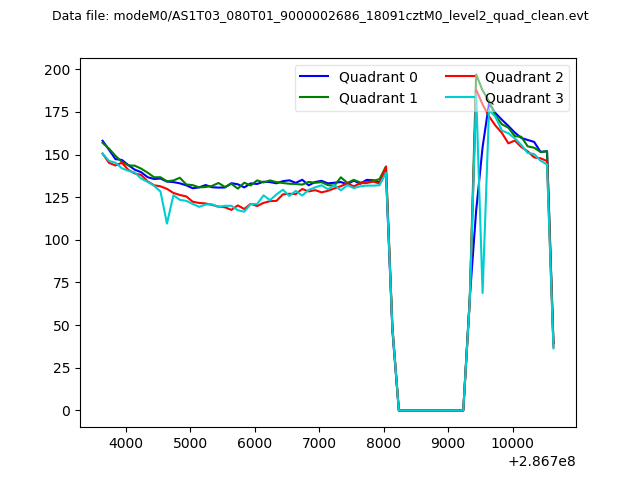
| Quadrant-wise count rates Data is divided into 100 sec bins |
 |
|
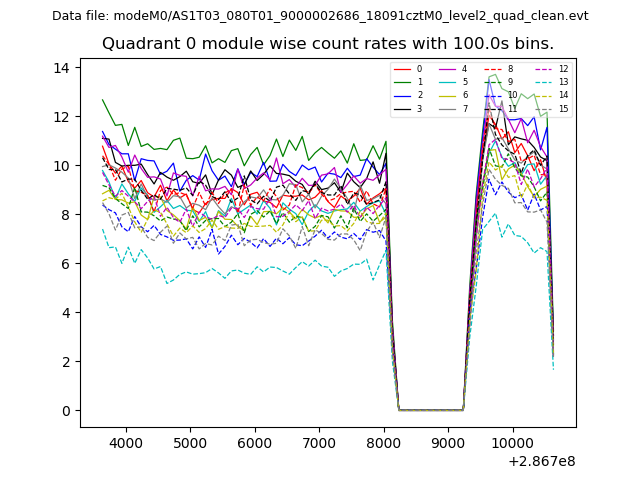
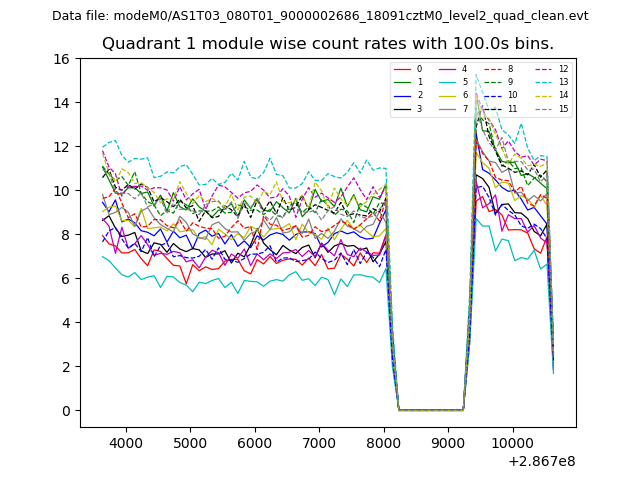
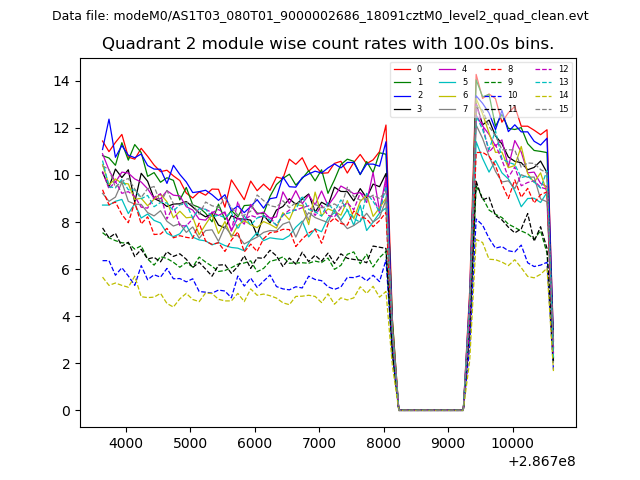
| Module-wise count rates for Quadrant A Data is divided into 100 sec bins |
 |
 |
| Module-wise count rates for Quadrant B Data is divided into 100 sec bins |
 |
 |
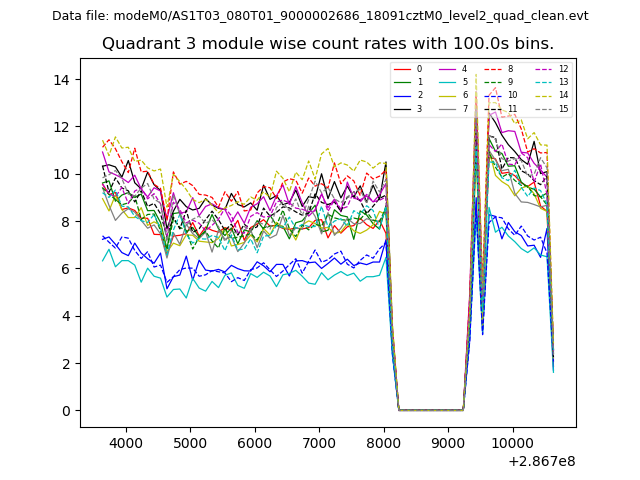
| Module-wise count rates for Quadrant C Data is divided into 100 sec bins |
 |
 |
| Module-wise count rates for Quadrant D Data is divided into 100 sec bins |
 |
 |
| Parameter | Plot |
|---|---|
| CZT HV Monitor | 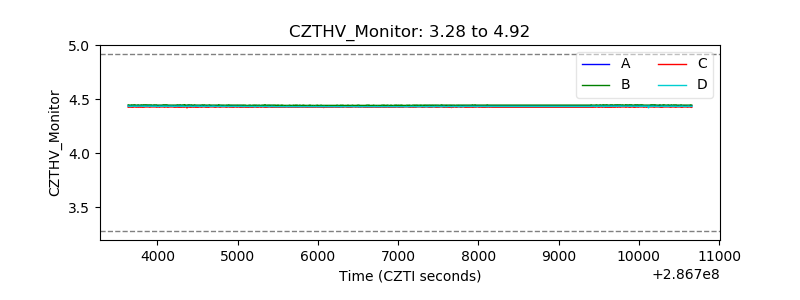 |
| D_VDD | 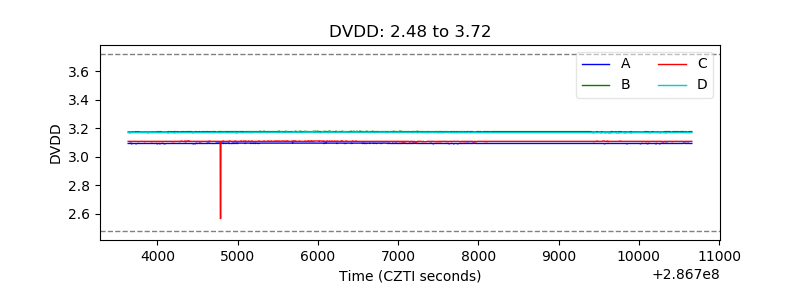 |
| Temperature 1 | 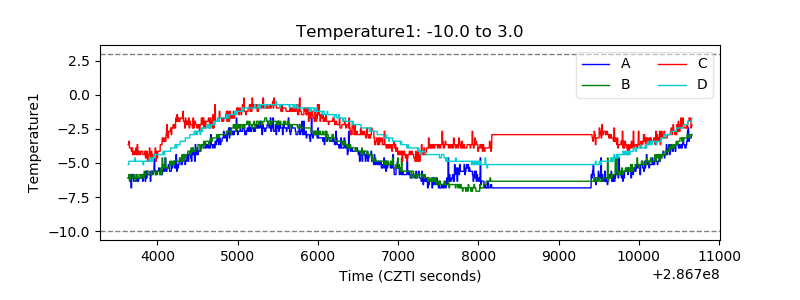 |
| Veto HV Monitor | 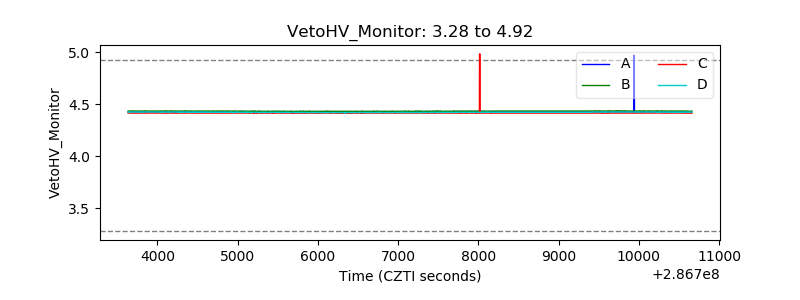 |
| Veto LLD |  |
| Alpha Counter | 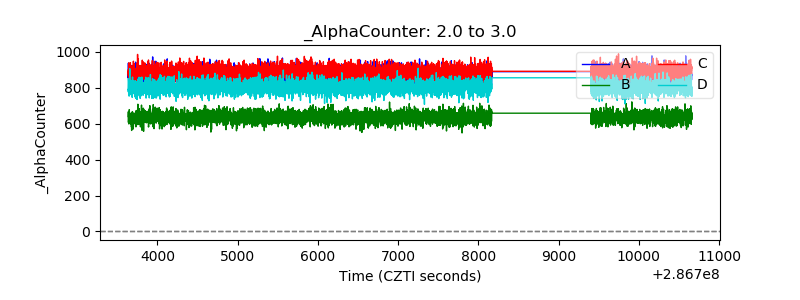 |
| _CPM_Rate | 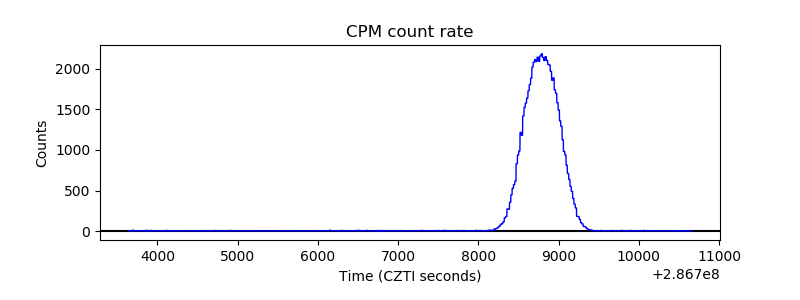 |
| CZT Counter | 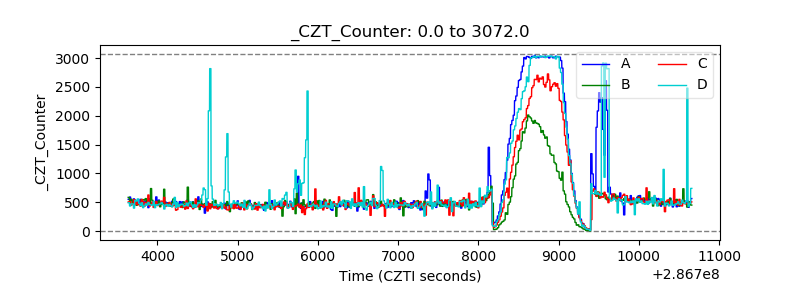 |
| +2.5 Volts monitor |  |
| +5 Volts monitor |  |
| _ROLL_ROT | 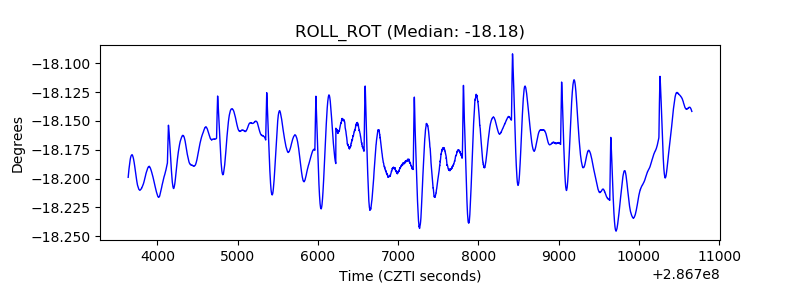 |
| _Roll_DEC | 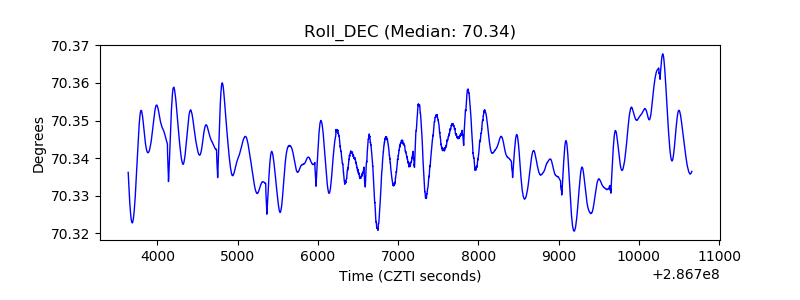 |
| _Roll_RA | 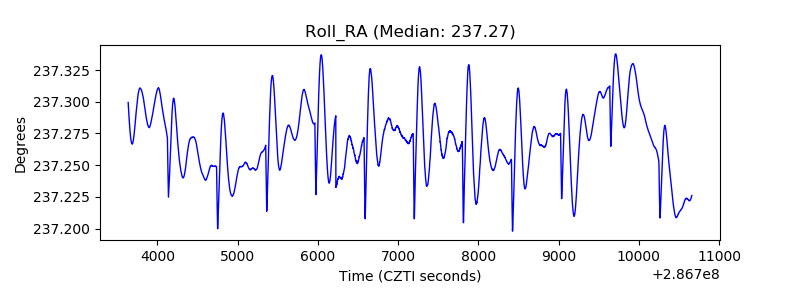 |
| Veto Counter | 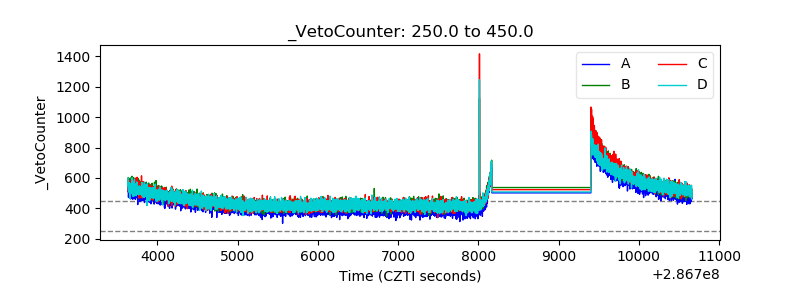 |