| Param | Original file | Final file |
|---|---|---|
| Filename | modeM0/AS1T03_080T01_9000002686_18092cztM0_level2.evt | modeM0/AS1T03_080T01_9000002686_18092cztM0_level2_quad_clean.evt |
| Size (bytes) | 415,376,640 | 126,190,080 |
| Size | 396.1 MB | 120.3 MB |
| Events in quadrant A | 2,940,040 | 876,104 |
| Events in quadrant B | 3,060,080 | 869,094 |
| Events in quadrant C | 2,945,702 | 835,016 |
| Events in quadrant D | 3,235,570 | 832,596 |
| Mode M9 | |||
|---|---|---|---|
| Quadrant | BADHDUFLAG | Total packets | Discarded packets |
| A | 0 | 13 | 0 |
| B | 0 | 13 | 0 |
| C | 0 | 13 | 0 |
| D | 0 | 13 | 0 |
| Mode SS | |||
|---|---|---|---|
| Quadrant | BADHDUFLAG | Total packets | Discarded packets |
| A | 0 | 118 | 0 |
| B | 0 | 118 | 0 |
| C | 0 | 118 | 0 |
| D | 0 | 118 | 0 |
| Mode M0 | |||
|---|---|---|---|
| Quadrant | BADHDUFLAG | Total packets | Discarded packets |
| A | 0 | 12258 | 1 |
| B | 0 | 12615 | 1 |
| C | 0 | 12186 | 1 |
| D | 0 | 13294 | 1 |
| Quadrant | Total seconds | Saturated seconds | Saturation percentage |
|---|---|---|---|
| A | 5861 | 61 | 1.040778% |
| B | 5862 | 102 | 1.740020% |
| C | 5862 | 69 | 1.177073% |
| D | 5862 | 146 | 2.490618% |
Noise dominated data is calculated using 1-second bins in cleaned event files. If a bin has >2000 counts, and if more than 50% of those come from <1% of pixels, then it is considered to be noise-dominated and hence unusable.
| Quadrant | # 1 sec bins | Bins with >0 counts | Bins with >2000 counts | High rate bins dominated by noise | Noise dominated (total time) | Noise dominated (detector-on time) | Marked lightcurve |
|---|---|---|---|---|---|---|---|
| A | 7146 | 5862 | 0 | 0 | 0.00% | 0.00% | 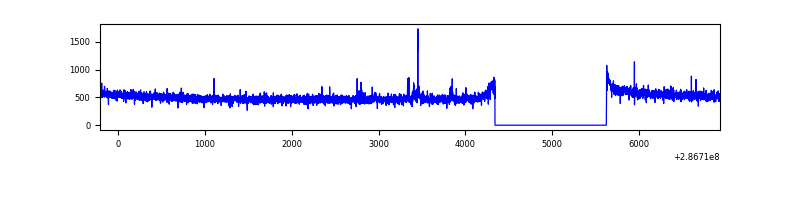 |
| B | 7147 | 5863 | 23 | 23 | 0.32% | 0.39% | 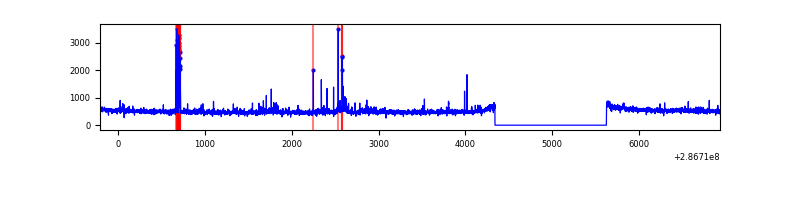 |
| C | 7147 | 5863 | 0 | 0 | 0.00% | 0.00% | 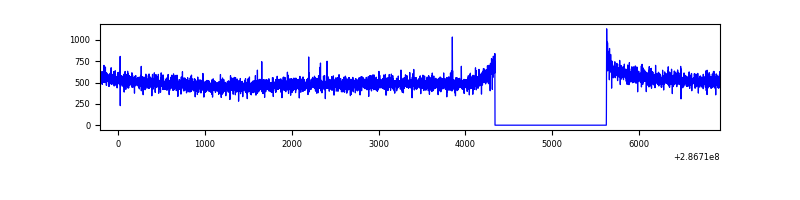 |
| D | 7147 | 5863 | 107 | 107 | 1.50% | 1.83% | 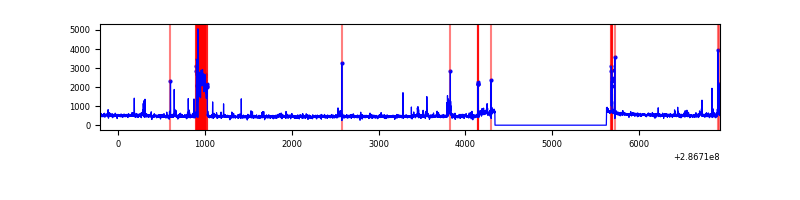 |
Top three noisy pixels from each quadrant. If the there are fewer than three noisy pixels in the level2.evt file, extra rows are filled as -1
| Pixel properties | Quadrant properties | ||||||
|---|---|---|---|---|---|---|---|
| Quadrant | DetID | PixID | Counts | Sigma | Mean | Median | Sigma |
| A | 15 | 174 | 19962 | 128.73 | 757 | 744 | 149.3 |
| A | 0 | 226 | 6744 | 40.19 | 757 | 744 | 149.3 |
| A | 4 | 2 | 6708 | 39.95 | 757 | 744 | 149.3 |
| B | 10 | 247 | 95159 | 696.22 | 737 | 720 | 135.6 |
| B | 4 | 171 | 40203 | 291.07 | 737 | 720 | 135.6 |
| B | 12 | 111 | 15628 | 109.9 | 737 | 720 | 135.6 |
| C | 14 | 238 | 114570 | 695.83 | 711 | 714 | 163.6 |
| C | 3 | 233 | 49092 | 295.66 | 711 | 714 | 163.6 |
| C | 13 | 61 | 4991 | 26.14 | 711 | 714 | 163.6 |
| D | 11 | 176 | 407024 | 2297.27 | 733 | 711 | 176.9 |
| D | 2 | 234 | 23391 | 128.23 | 733 | 711 | 176.9 |
| D | 2 | 152 | 19316 | 105.19 | 733 | 711 | 176.9 |
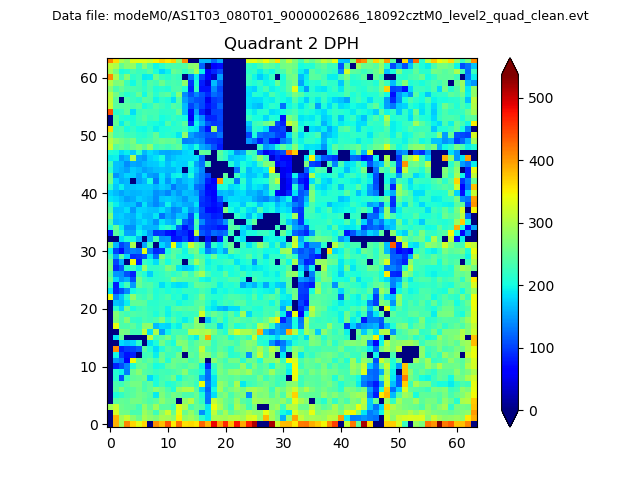
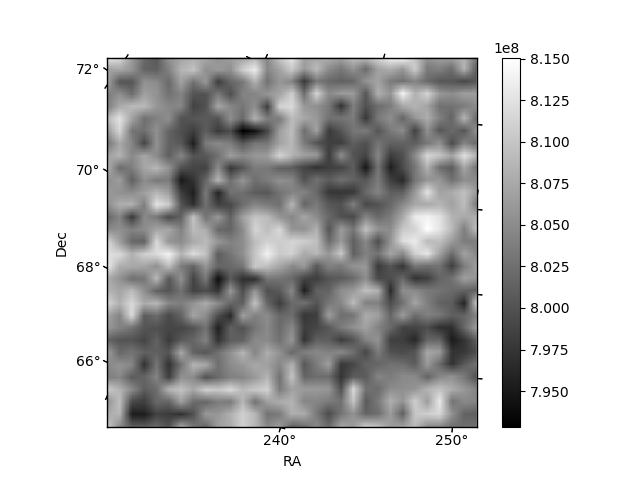
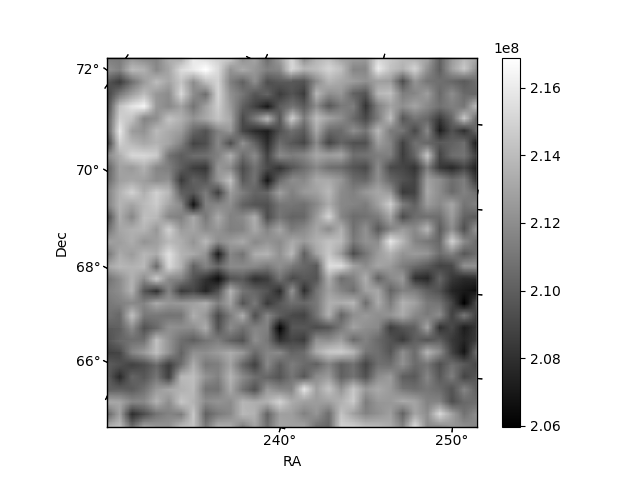
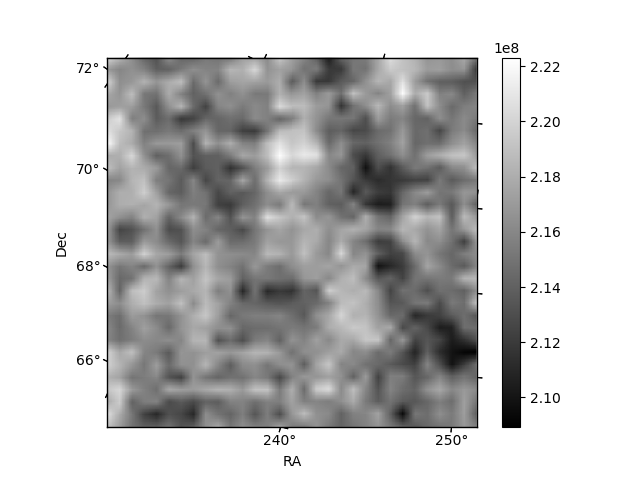
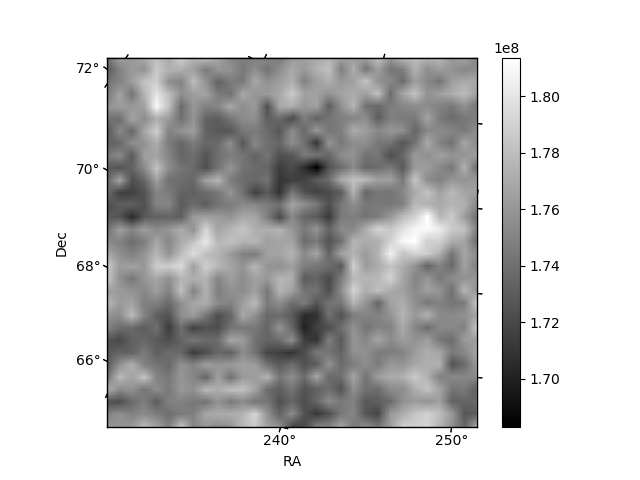
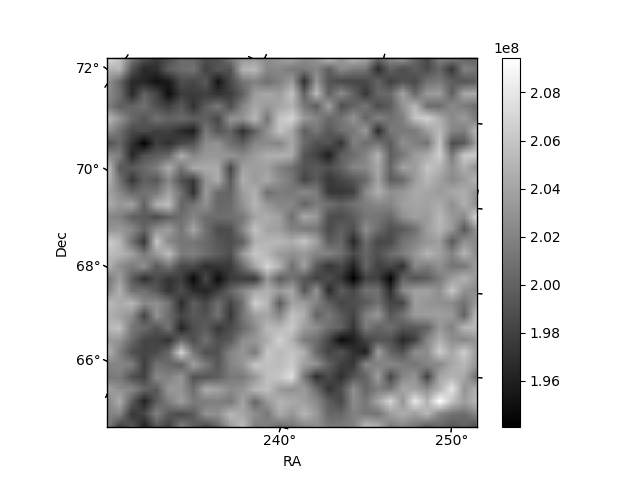
Histogram calculated using DETX and DETY for each event in the final _common_clean file
| Quadrant A | 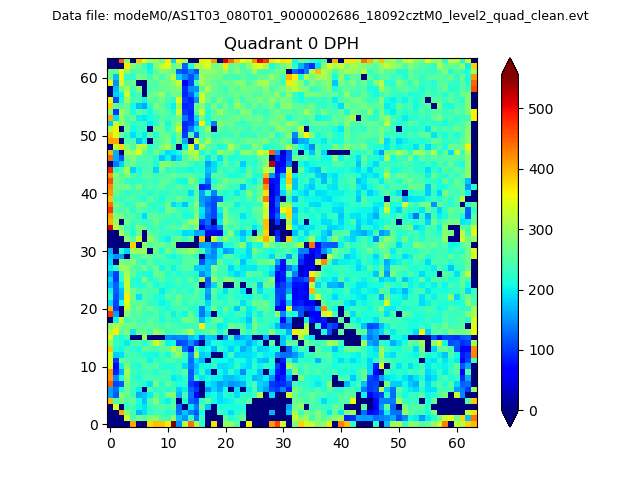 |
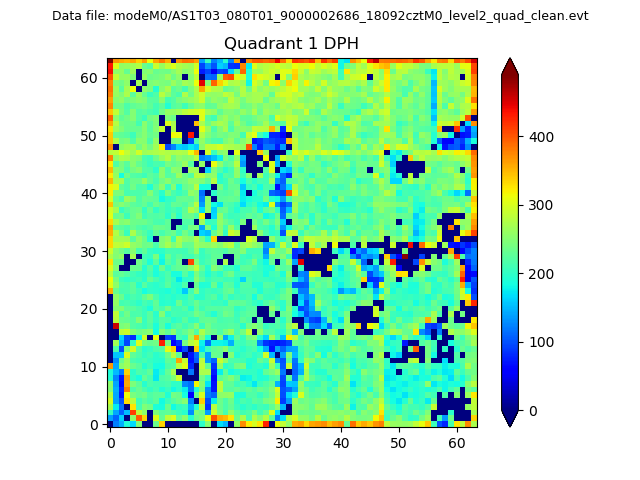 |
Quadrant B |
|---|---|---|---|
| Quadrant D | 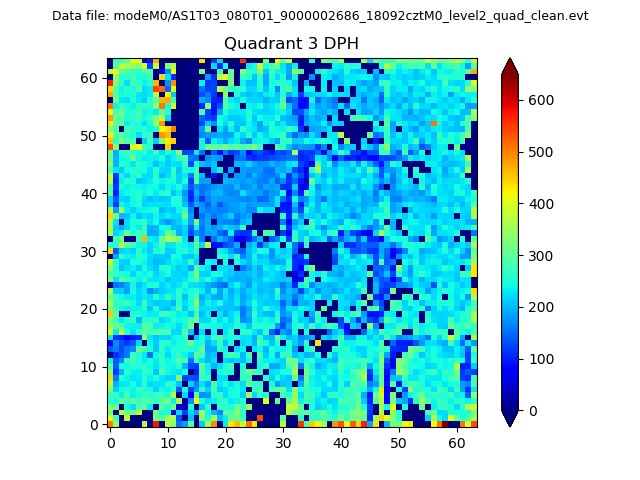 |
 |
Quadrant C |
| Plot type | Count rate plots | Images |
|---|---|---|
| Comparison with Poisson distribution Blue bars denote a histogram of data divided into 1 sec bins. Red curve is a Poisson curve with rate = median count rate of data. |
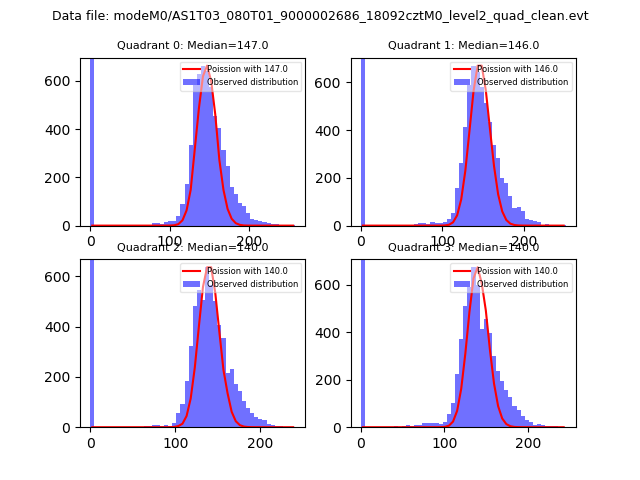 |
 |
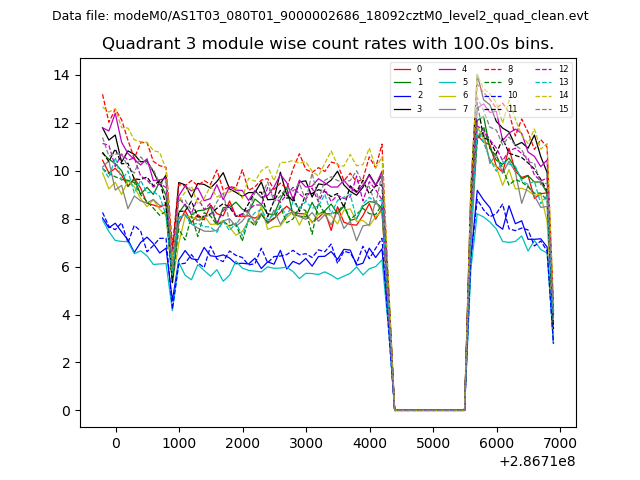
| Quadrant-wise count rates Data is divided into 100 sec bins |
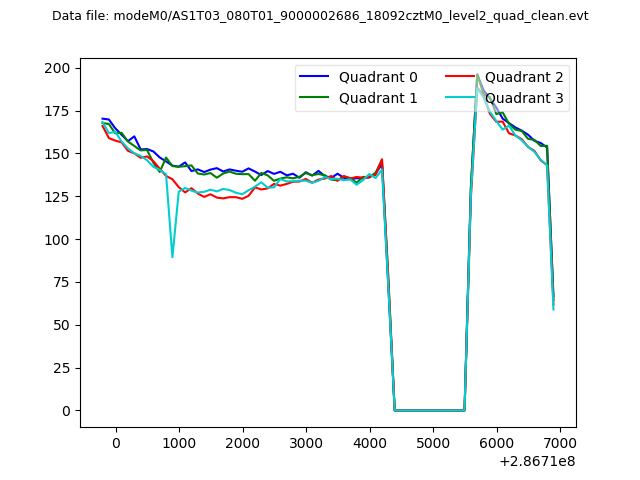 |
|
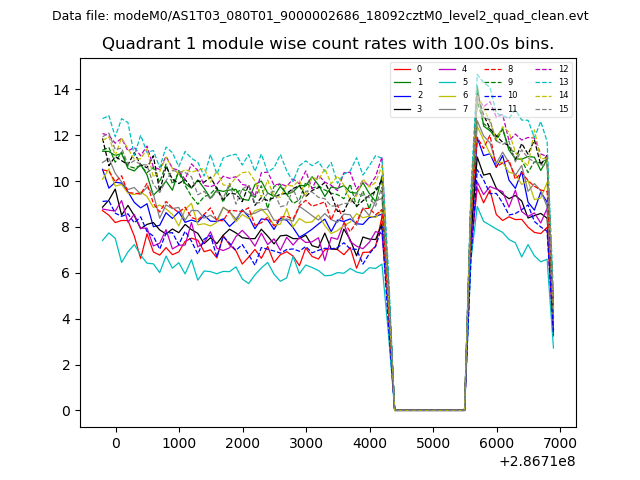
| Module-wise count rates for Quadrant A Data is divided into 100 sec bins |
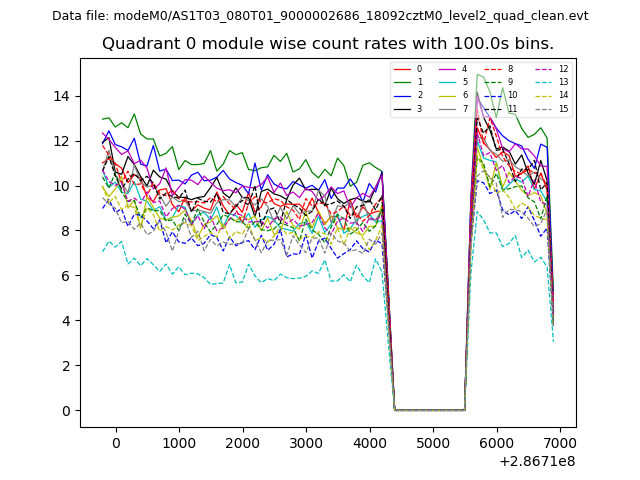 |
 |
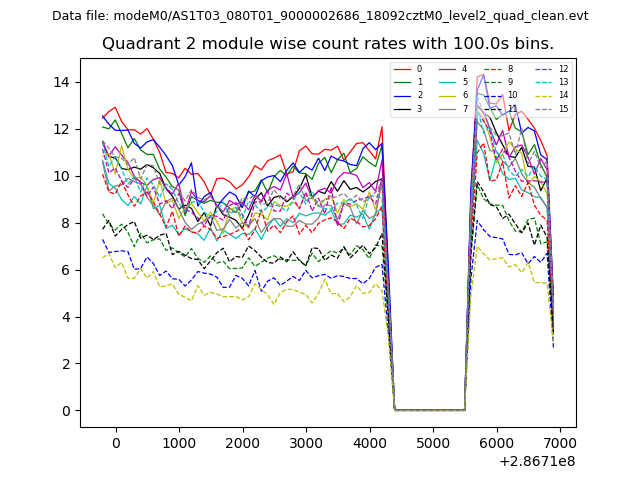
| Module-wise count rates for Quadrant B Data is divided into 100 sec bins |
 |
 |
| Module-wise count rates for Quadrant C Data is divided into 100 sec bins |
 |
 |
| Module-wise count rates for Quadrant D Data is divided into 100 sec bins |
 |
 |
| Parameter | Plot |
|---|---|
| CZT HV Monitor | 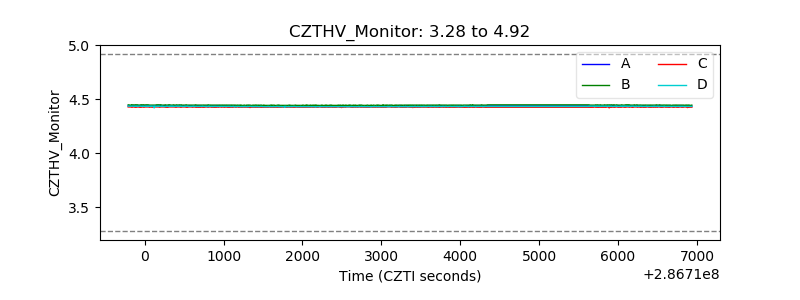 |
| D_VDD |  |
| Temperature 1 | 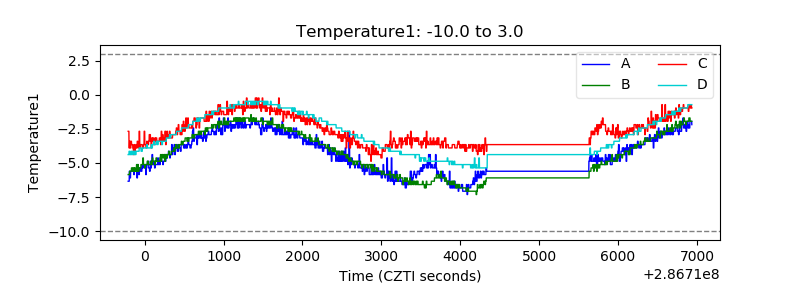 |
| Veto HV Monitor |  |
| Veto LLD |  |
| Alpha Counter | 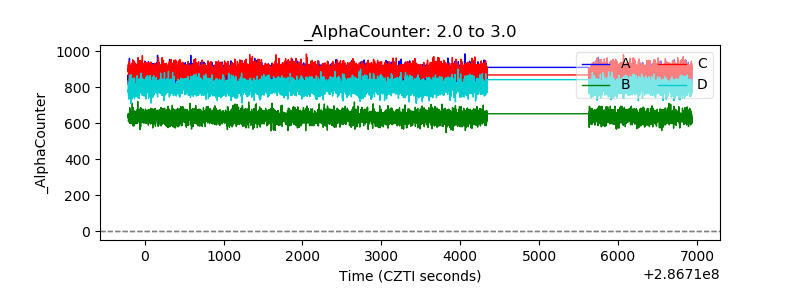 |
| _CPM_Rate | 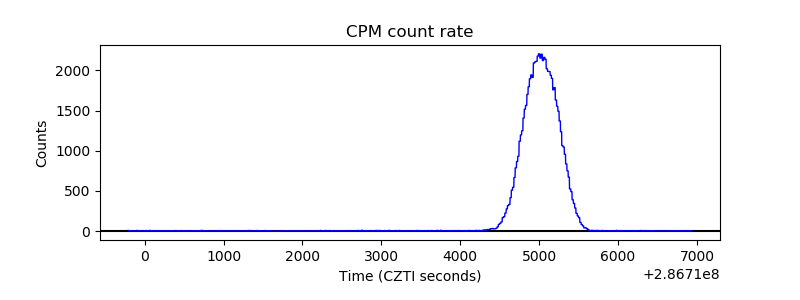 |
| CZT Counter | 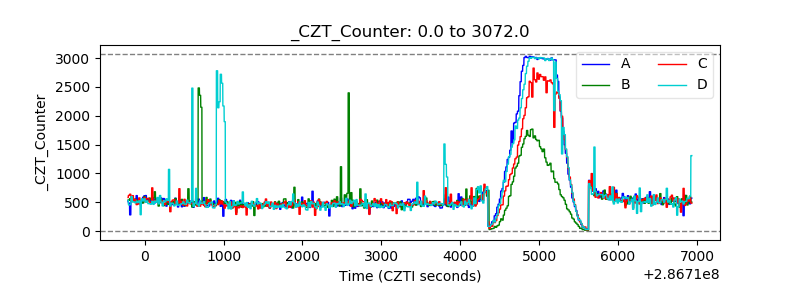 |
| +2.5 Volts monitor |  |
| +5 Volts monitor | 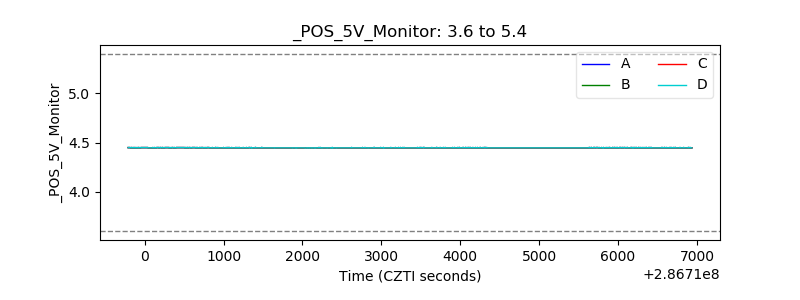 |
| _ROLL_ROT | 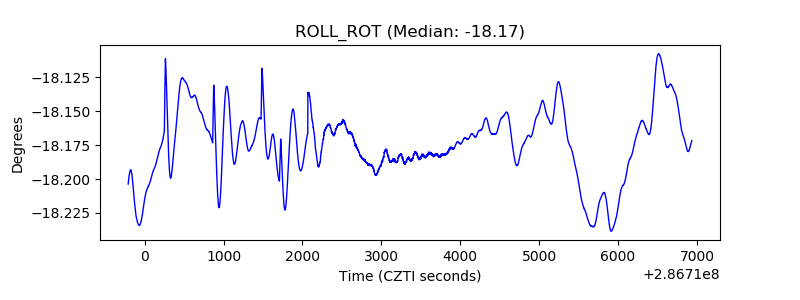 |
| _Roll_DEC | 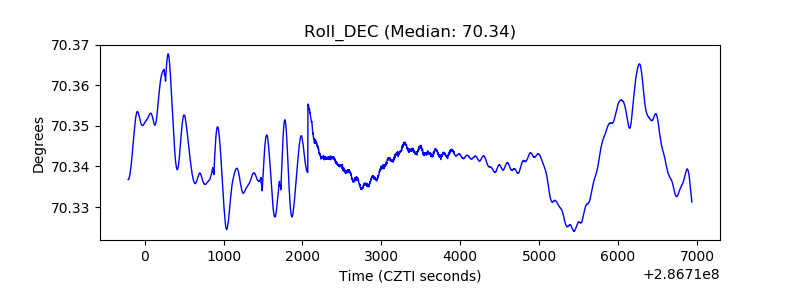 |
| _Roll_RA | 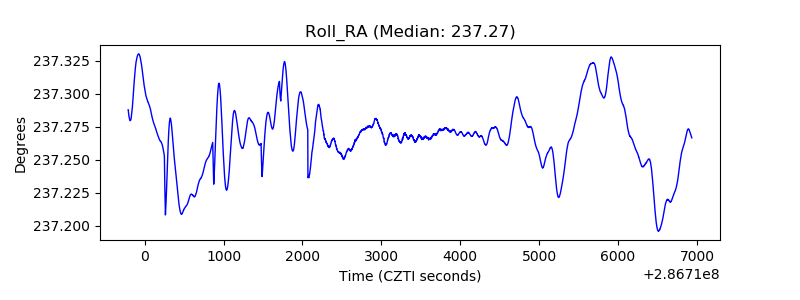 |
| Veto Counter | 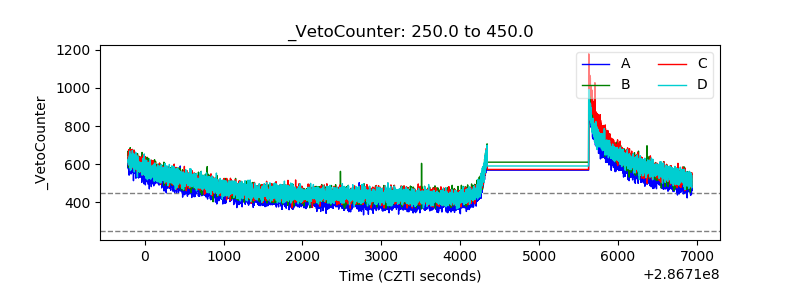 |