| Param | Original file | Final file |
|---|---|---|
| Filename | modeM0/AS1T03_080T01_9000002686_18093cztM0_level2.evt | modeM0/AS1T03_080T01_9000002686_18093cztM0_level2_quad_clean.evt |
| Size (bytes) | 438,984,000 | 130,602,240 |
| Size | 418.6 MB | 124.6 MB |
| Events in quadrant A | 3,134,523 | 904,206 |
| Events in quadrant B | 3,152,282 | 898,931 |
| Events in quadrant C | 3,083,979 | 864,644 |
| Events in quadrant D | 3,508,723 | 861,505 |
| Mode M9 | |||
|---|---|---|---|
| Quadrant | BADHDUFLAG | Total packets | Discarded packets |
| A | 0 | 14 | 0 |
| B | 0 | 14 | 0 |
| C | 0 | 14 | 0 |
| D | 0 | 14 | 0 |
| Mode SS | |||
|---|---|---|---|
| Quadrant | BADHDUFLAG | Total packets | Discarded packets |
| A | 0 | 124 | 0 |
| B | 0 | 124 | 0 |
| C | 0 | 124 | 0 |
| D | 0 | 124 | 0 |
| Mode M0 | |||
|---|---|---|---|
| Quadrant | BADHDUFLAG | Total packets | Discarded packets |
| A | 0 | 12974 | 1 |
| B | 0 | 12956 | 1 |
| C | 0 | 12597 | 1 |
| D | 0 | 14223 | 1 |
| Quadrant | Total seconds | Saturated seconds | Saturation percentage |
|---|---|---|---|
| A | 6109 | 108 | 1.767883% |
| B | 6110 | 95 | 1.554828% |
| C | 6110 | 91 | 1.489362% |
| D | 6110 | 153 | 2.504092% |
Noise dominated data is calculated using 1-second bins in cleaned event files. If a bin has >2000 counts, and if more than 50% of those come from <1% of pixels, then it is considered to be noise-dominated and hence unusable.
| Quadrant | # 1 sec bins | Bins with >0 counts | Bins with >2000 counts | High rate bins dominated by noise | Noise dominated (total time) | Noise dominated (detector-on time) | Marked lightcurve |
|---|---|---|---|---|---|---|---|
| A | 7429 | 6110 | 15 | 15 | 0.20% | 0.25% | 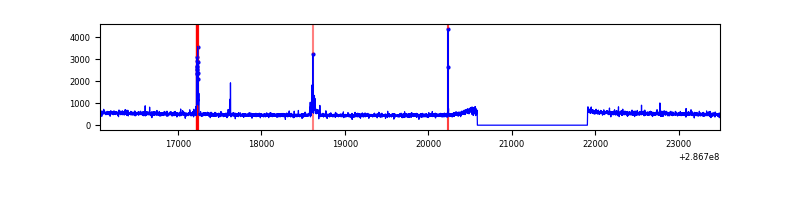 |
| B | 7430 | 6111 | 12 | 12 | 0.16% | 0.20% | 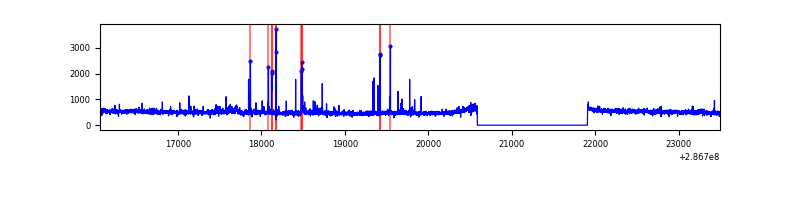 |
| C | 7430 | 6110 | 0 | 0 | 0.00% | 0.00% | 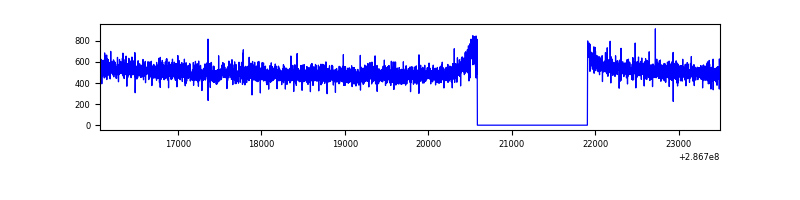 |
| D | 7430 | 6111 | 65 | 65 | 0.87% | 1.06% | 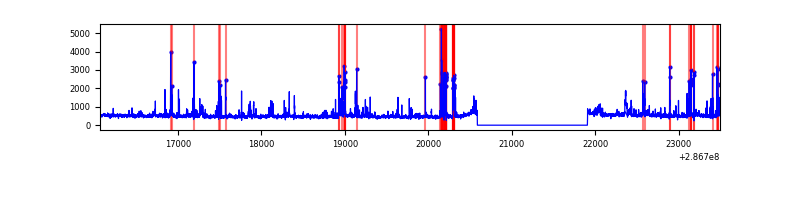 |
Top three noisy pixels from each quadrant. If the there are fewer than three noisy pixels in the level2.evt file, extra rows are filled as -1
| Pixel properties | Quadrant properties | ||||||
|---|---|---|---|---|---|---|---|
| Quadrant | DetID | PixID | Counts | Sigma | Mean | Median | Sigma |
| A | 15 | 174 | 98585 | 632.1 | 783 | 767 | 154.8 |
| A | 4 | 2 | 21140 | 131.65 | 783 | 767 | 154.8 |
| A | 0 | 226 | 6941 | 39.9 | 783 | 767 | 154.8 |
| B | 0 | 197 | 34967 | 241.86 | 765 | 748 | 141.5 |
| B | 3 | 64 | 27522 | 189.24 | 765 | 748 | 141.5 |
| B | 0 | 189 | 25977 | 178.32 | 765 | 748 | 141.5 |
| C | 14 | 238 | 117436 | 675.85 | 743 | 748 | 172.7 |
| C | 3 | 233 | 64514 | 369.33 | 743 | 748 | 172.7 |
| C | 13 | 61 | 5350 | 26.65 | 743 | 748 | 172.7 |
| D | 11 | 176 | 515642 | 2834.24 | 761 | 739 | 181.7 |
| D | 2 | 234 | 26020 | 139.16 | 761 | 739 | 181.7 |
| D | 10 | 70 | 24790 | 132.39 | 761 | 739 | 181.7 |
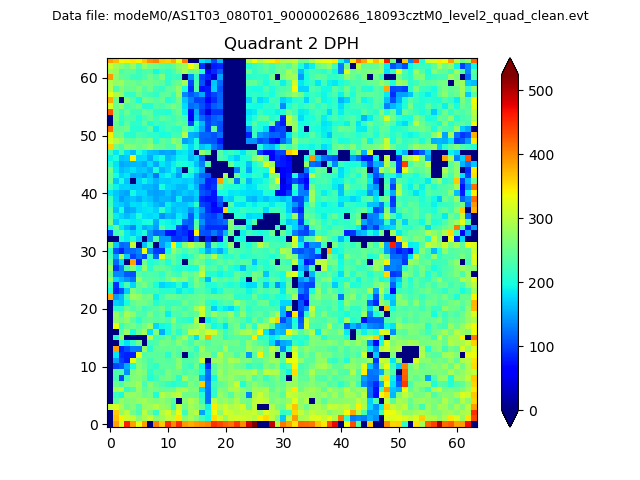
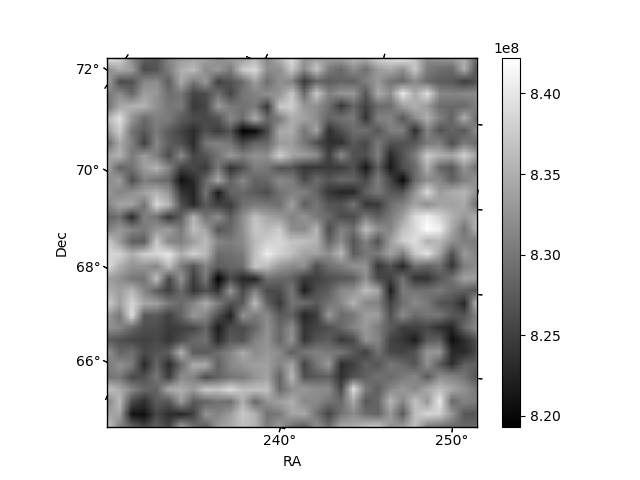
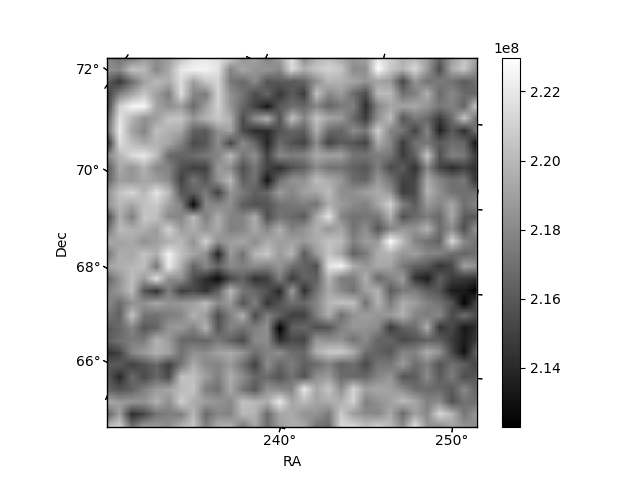
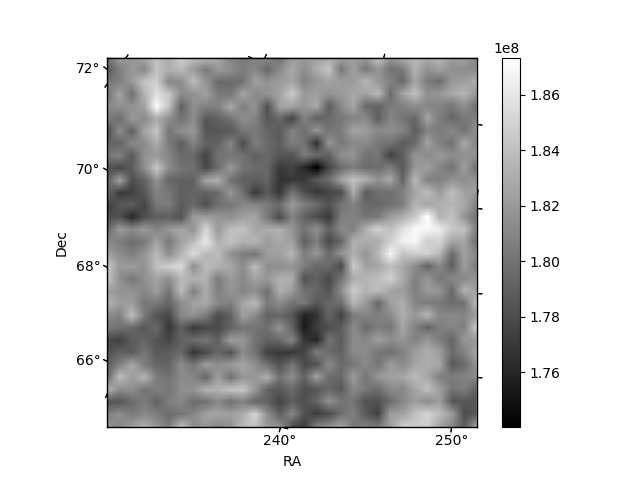
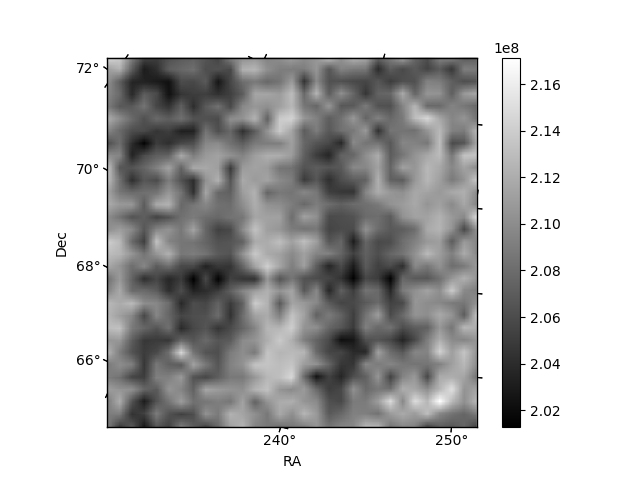
Histogram calculated using DETX and DETY for each event in the final _common_clean file
| Quadrant A | 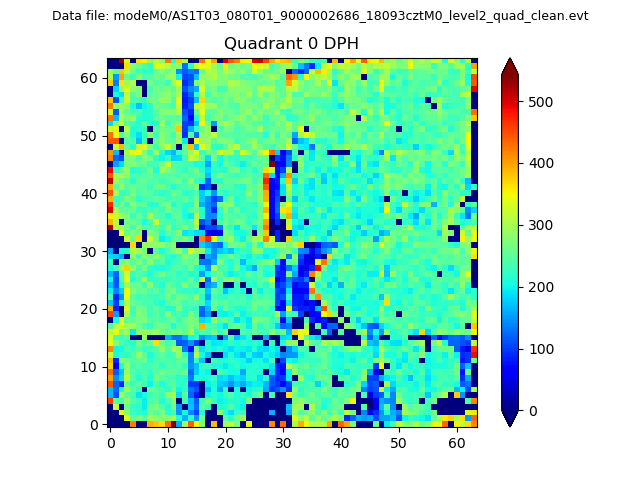 |
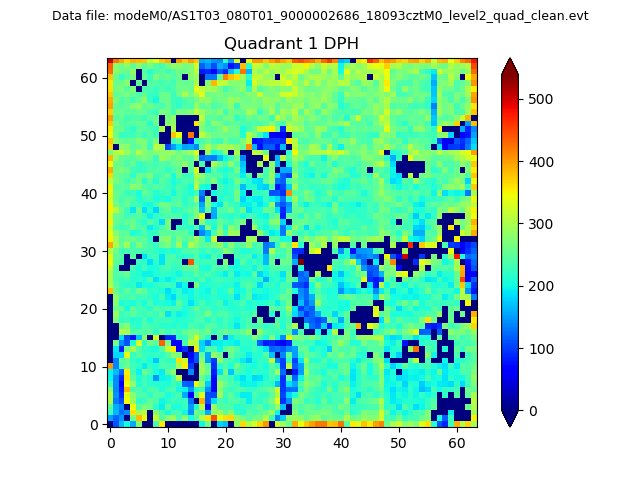 |
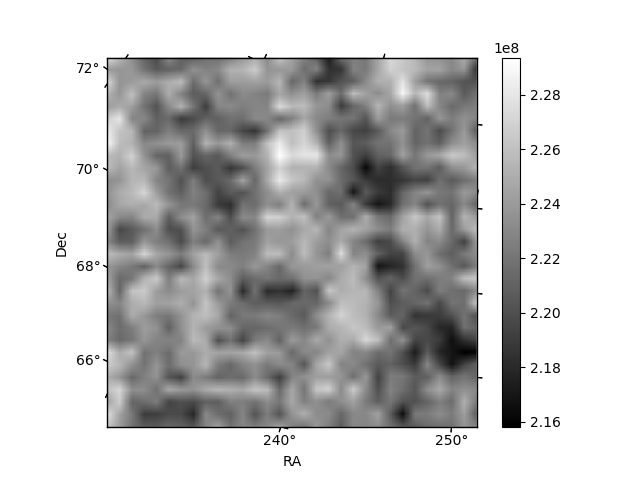
Quadrant B |
|---|---|---|---|
| Quadrant D | 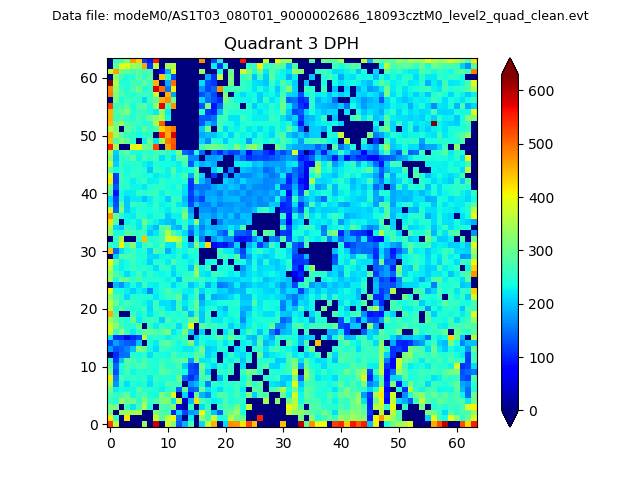 |
 |
Quadrant C |
| Plot type | Count rate plots | Images |
|---|---|---|
| Comparison with Poisson distribution Blue bars denote a histogram of data divided into 1 sec bins. Red curve is a Poisson curve with rate = median count rate of data. |
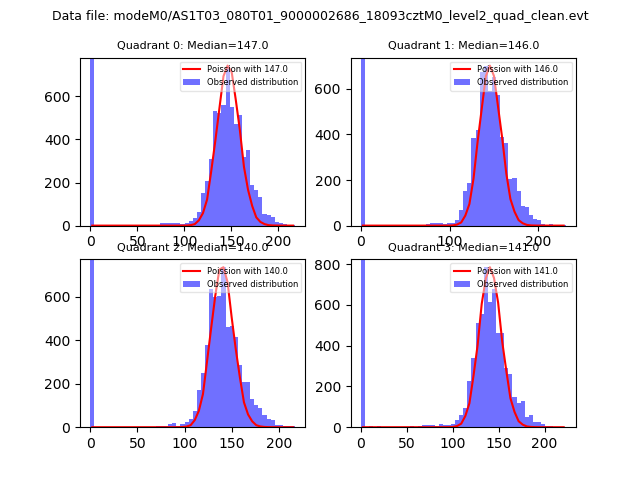 |
 |
| Quadrant-wise count rates Data is divided into 100 sec bins |
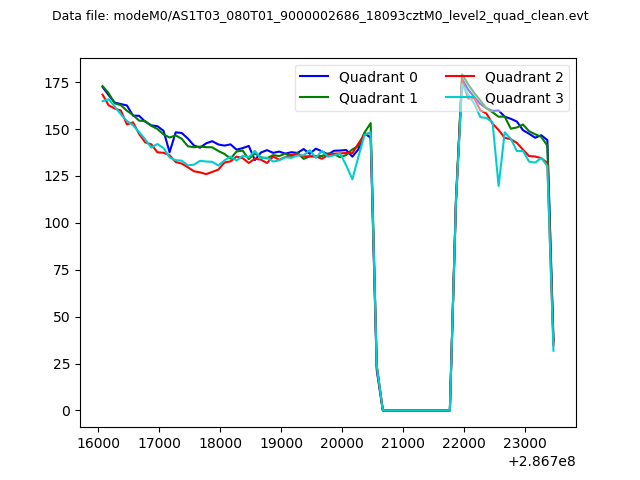 |
|
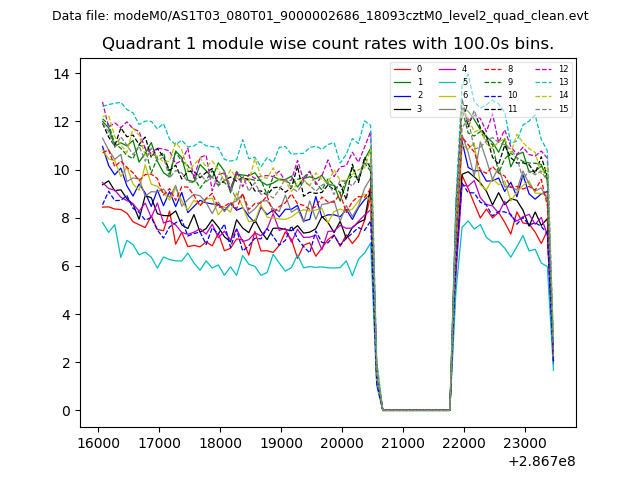
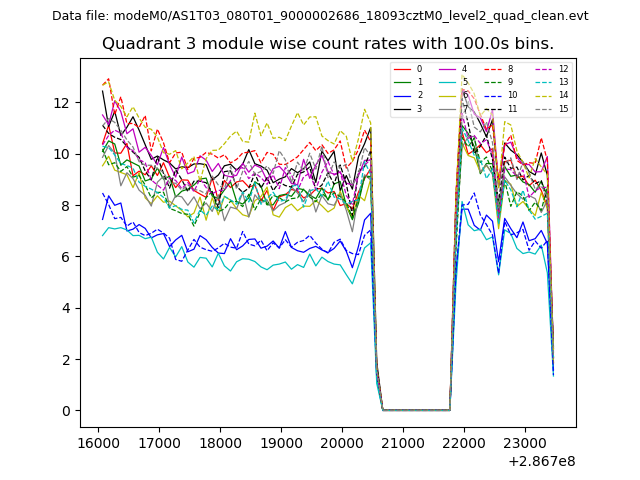
| Module-wise count rates for Quadrant A Data is divided into 100 sec bins |
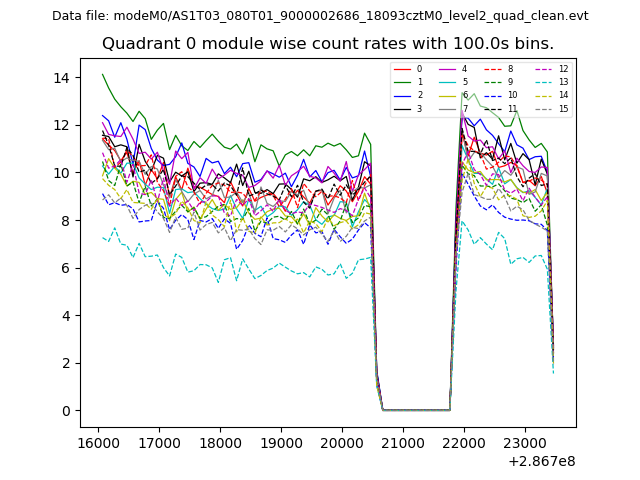 |
 |
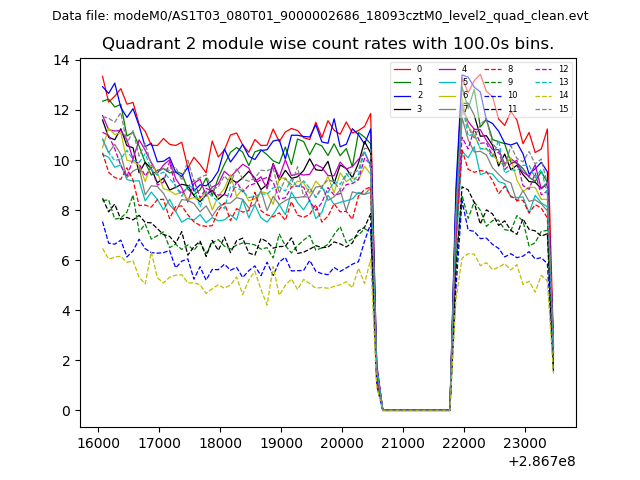
| Module-wise count rates for Quadrant B Data is divided into 100 sec bins |
 |
 |
| Module-wise count rates for Quadrant C Data is divided into 100 sec bins |
 |
 |
| Module-wise count rates for Quadrant D Data is divided into 100 sec bins |
 |
 |
| Parameter | Plot |
|---|---|
| CZT HV Monitor | 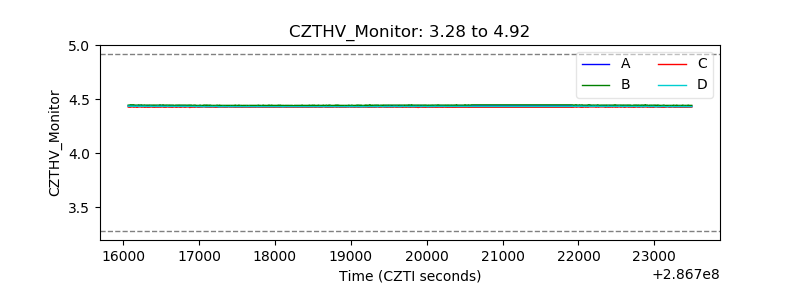 |
| D_VDD | 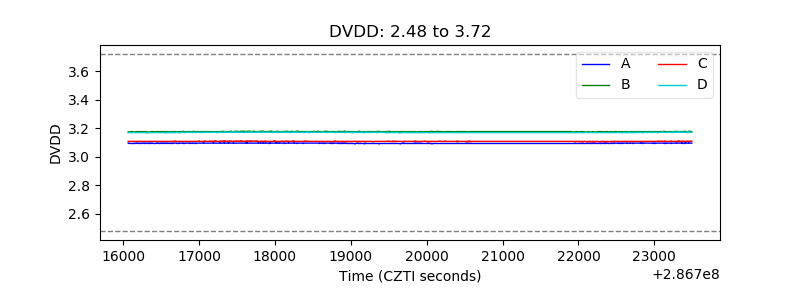 |
| Temperature 1 | 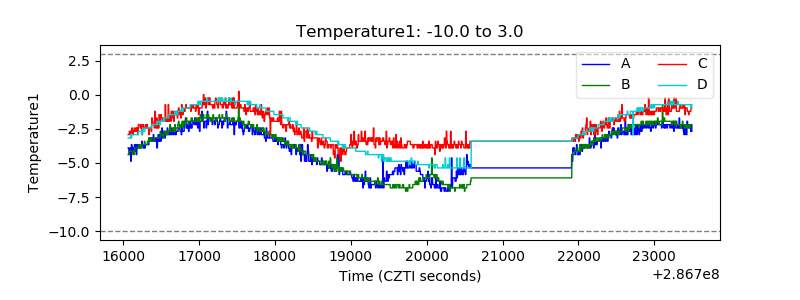 |
| Veto HV Monitor | 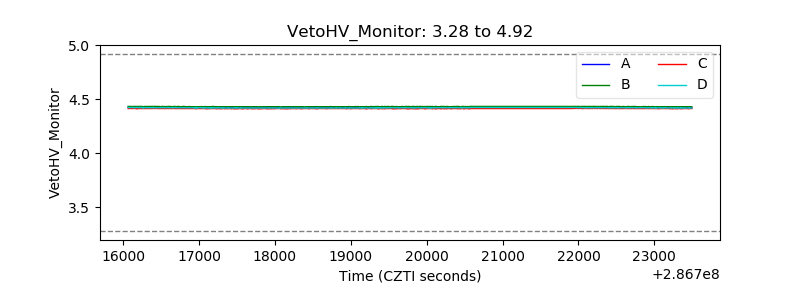 |
| Veto LLD | 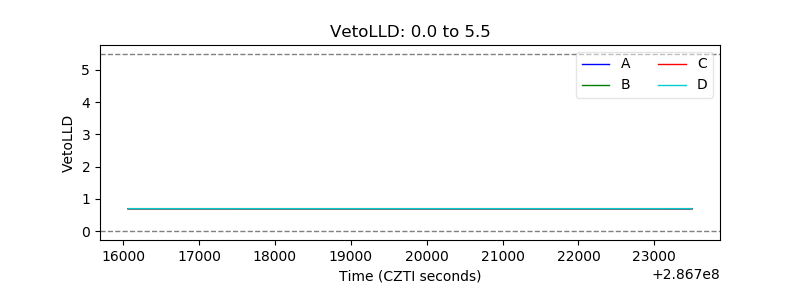 |
| Alpha Counter | 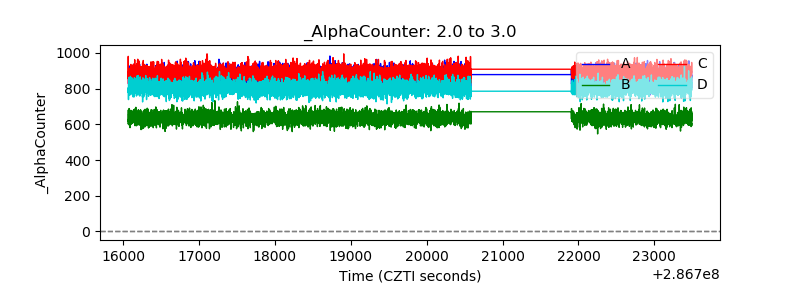 |
| _CPM_Rate | 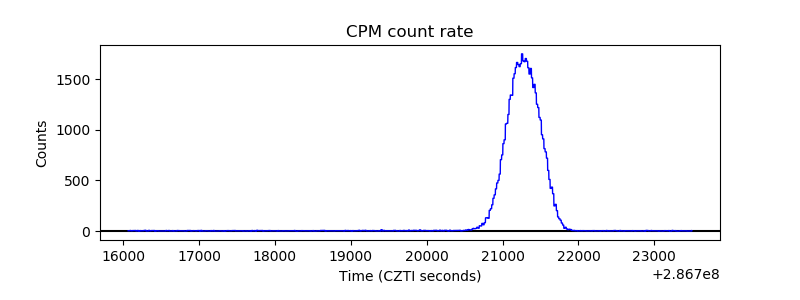 |
| CZT Counter | 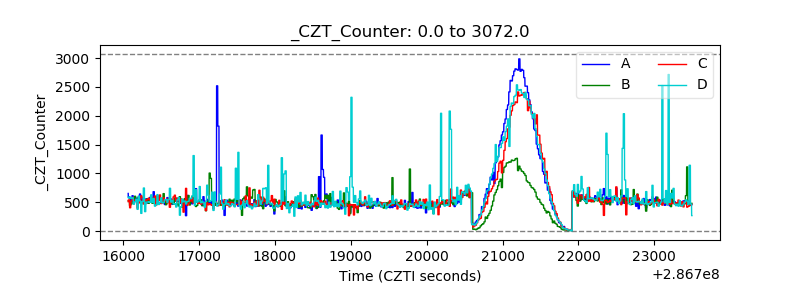 |
| +2.5 Volts monitor |  |
| +5 Volts monitor |  |
| _ROLL_ROT | 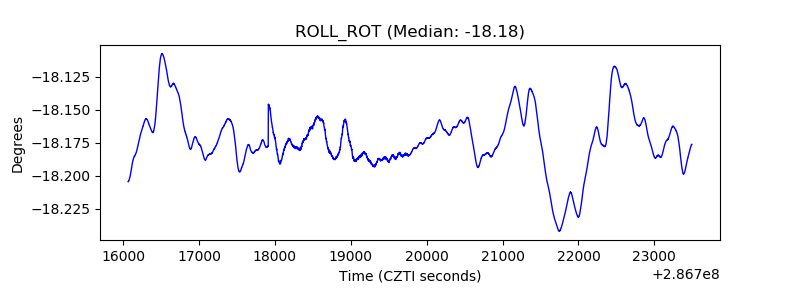 |
| _Roll_DEC |  |
| _Roll_RA | 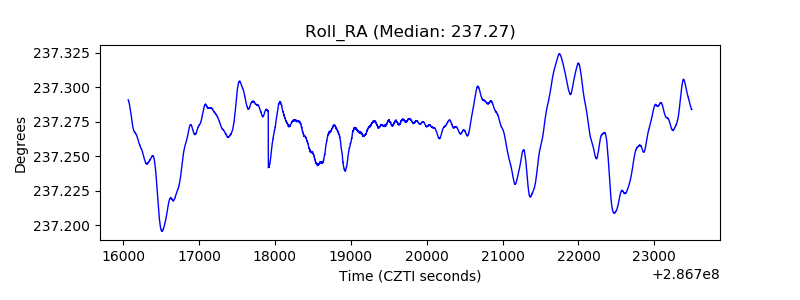 |
| Veto Counter | 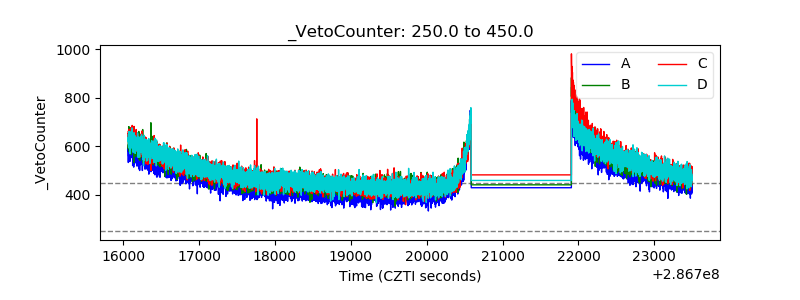 |