| Param | Original file | Final file |
|---|---|---|
| Filename | modeM0/AS1T03_080T01_9000002686_18094cztM0_level2.evt | modeM0/AS1T03_080T01_9000002686_18094cztM0_level2_quad_clean.evt |
| Size (bytes) | 447,963,840 | 127,224,000 |
| Size | 427.2 MB | 121.3 MB |
| Events in quadrant A | 3,018,271 | 880,219 |
| Events in quadrant B | 3,141,178 | 873,120 |
| Events in quadrant C | 3,063,752 | 846,409 |
| Events in quadrant D | 3,923,833 | 822,648 |
| Mode M9 | |||
|---|---|---|---|
| Quadrant | BADHDUFLAG | Total packets | Discarded packets |
| A | 0 | 12 | 0 |
| B | 0 | 12 | 0 |
| C | 0 | 12 | 0 |
| D | 0 | 12 | 0 |
| Mode SS | |||
|---|---|---|---|
| Quadrant | BADHDUFLAG | Total packets | Discarded packets |
| A | 0 | 126 | 0 |
| B | 0 | 126 | 0 |
| C | 0 | 126 | 0 |
| D | 0 | 126 | 0 |
| Mode M0 | |||
|---|---|---|---|
| Quadrant | BADHDUFLAG | Total packets | Discarded packets |
| A | 0 | 12818 | 1 |
| B | 0 | 13163 | 1 |
| C | 0 | 12730 | 1 |
| D | 0 | 15703 | 1 |
| Quadrant | Total seconds | Saturated seconds | Saturation percentage |
|---|---|---|---|
| A | 6168 | 136 | 2.204929% |
| B | 6168 | 136 | 2.204929% |
| C | 6168 | 150 | 2.431907% |
| D | 6168 | 397 | 6.436446% |
Noise dominated data is calculated using 1-second bins in cleaned event files. If a bin has >2000 counts, and if more than 50% of those come from <1% of pixels, then it is considered to be noise-dominated and hence unusable.
| Quadrant | # 1 sec bins | Bins with >0 counts | Bins with >2000 counts | High rate bins dominated by noise | Noise dominated (total time) | Noise dominated (detector-on time) | Marked lightcurve |
|---|---|---|---|---|---|---|---|
| A | 7358 | 6168 | 0 | 0 | 0.00% | 0.00% | 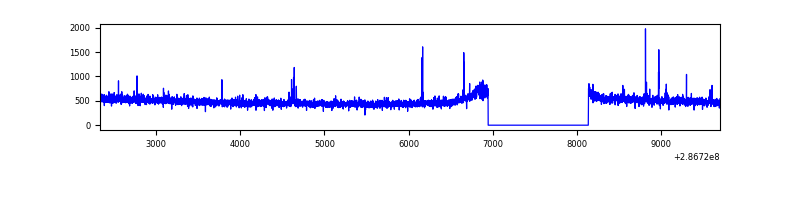 |
| B | 7358 | 6168 | 4 | 4 | 0.05% | 0.06% | 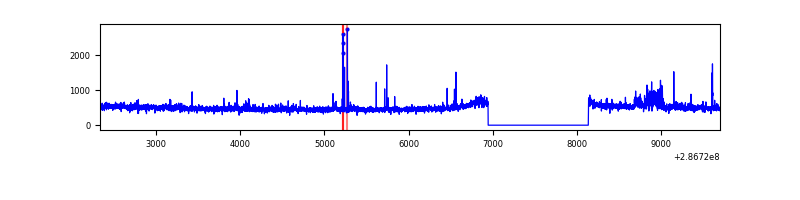 |
| C | 7358 | 6169 | 0 | 0 | 0.00% | 0.00% | 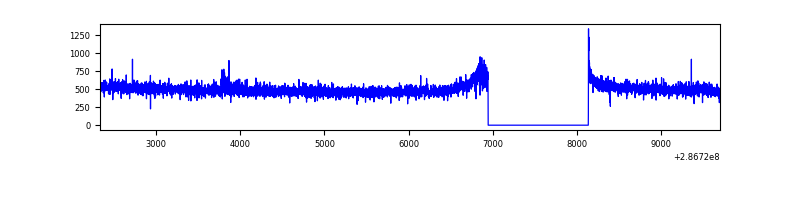 |
| D | 7358 | 6168 | 185 | 185 | 2.51% | 3.00% | 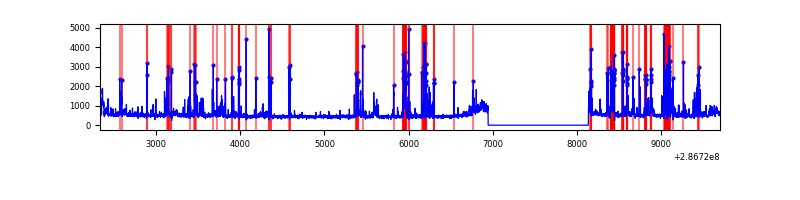 |
Top three noisy pixels from each quadrant. If the there are fewer than three noisy pixels in the level2.evt file, extra rows are filled as -1
| Pixel properties | Quadrant properties | ||||||
|---|---|---|---|---|---|---|---|
| Quadrant | DetID | PixID | Counts | Sigma | Mean | Median | Sigma |
| A | 4 | 2 | 31165 | 196.6 | 774 | 759 | 154.7 |
| A | 15 | 174 | 13006 | 79.19 | 774 | 759 | 154.7 |
| A | 0 | 226 | 6710 | 38.48 | 774 | 759 | 154.7 |
| B | 0 | 189 | 96884 | 673.77 | 760 | 739 | 142.7 |
| B | 3 | 64 | 42952 | 295.82 | 760 | 739 | 142.7 |
| B | 12 | 111 | 16104 | 107.68 | 760 | 739 | 142.7 |
| C | 14 | 238 | 114963 | 664.26 | 741 | 745 | 171.9 |
| C | 3 | 233 | 37403 | 213.19 | 741 | 745 | 171.9 |
| C | 0 | 207 | 17489 | 97.38 | 741 | 745 | 171.9 |
| D | 11 | 176 | 1023157 | 5702.31 | 743 | 720 | 179.3 |
| D | 10 | 70 | 27823 | 151.16 | 743 | 720 | 179.3 |
| D | 2 | 234 | 27644 | 150.16 | 743 | 720 | 179.3 |
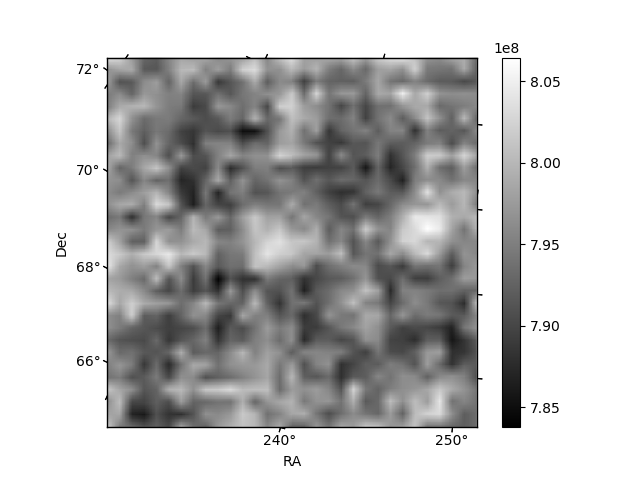
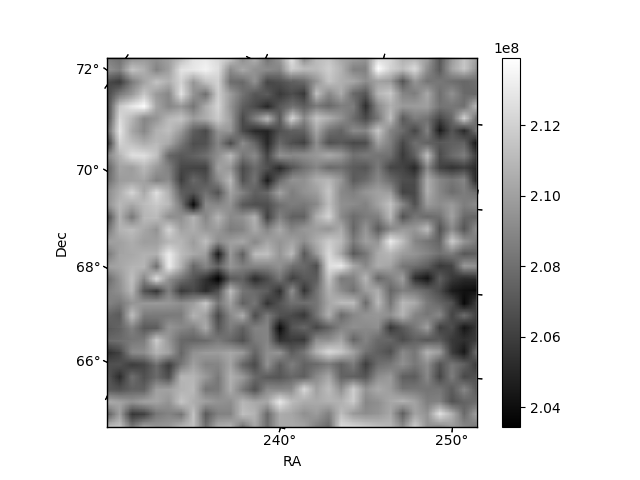
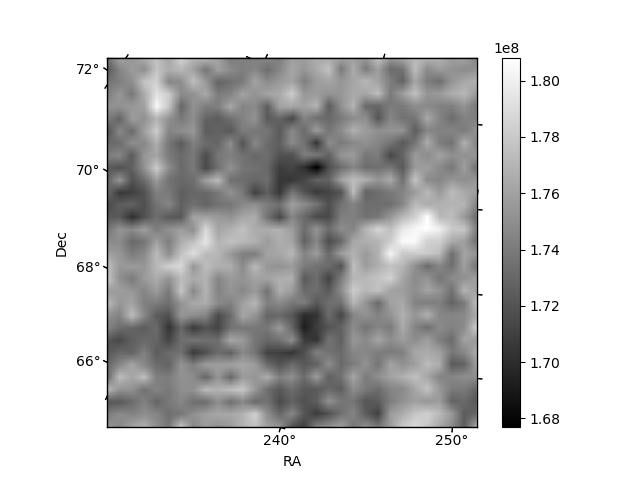
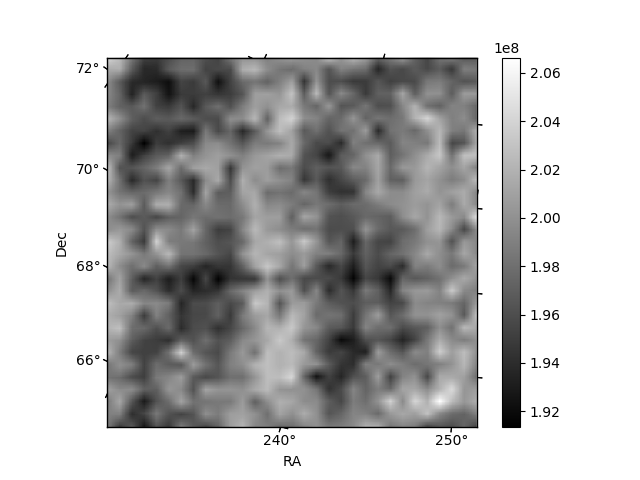
Histogram calculated using DETX and DETY for each event in the final _common_clean file
| Quadrant A | 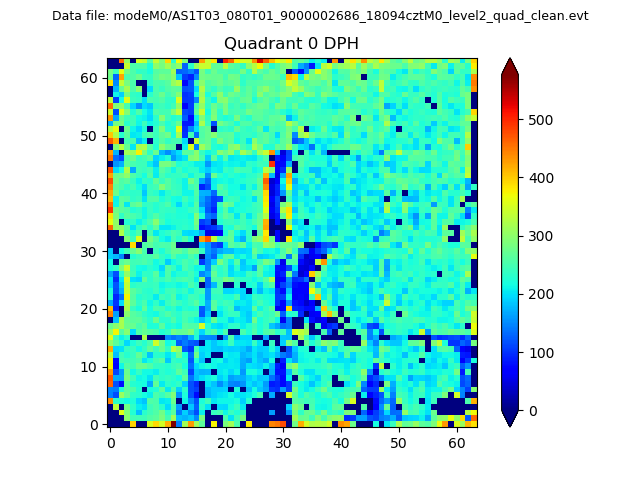 |
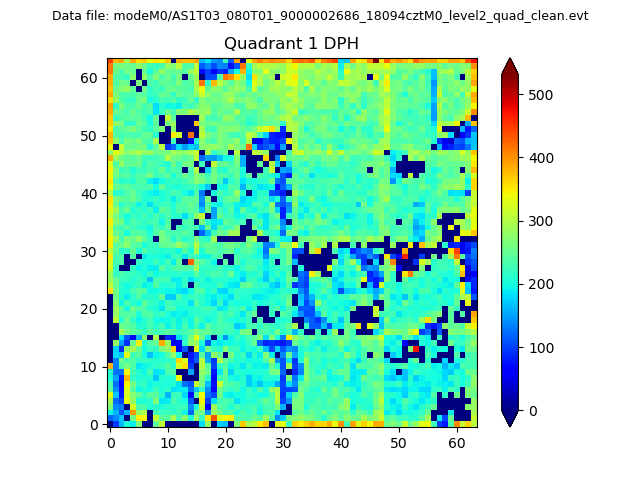 |
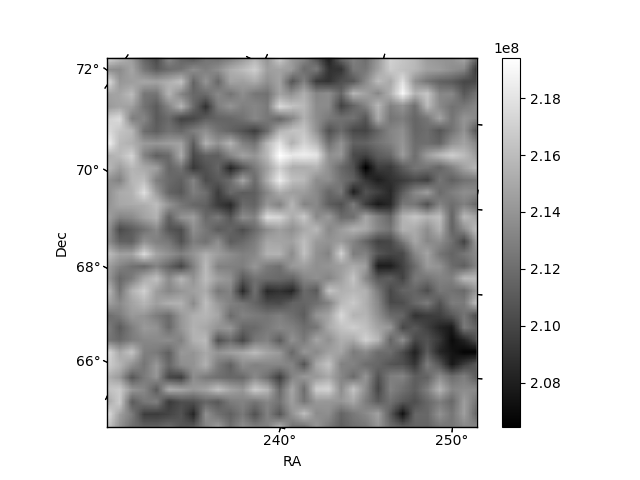
Quadrant B |
|---|---|---|---|
| Quadrant D | 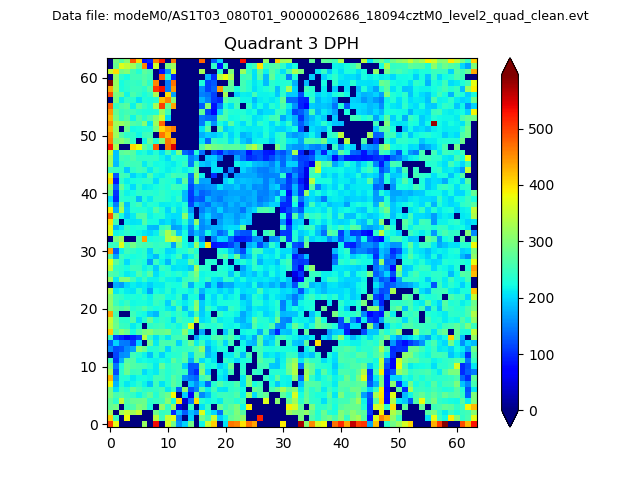 |
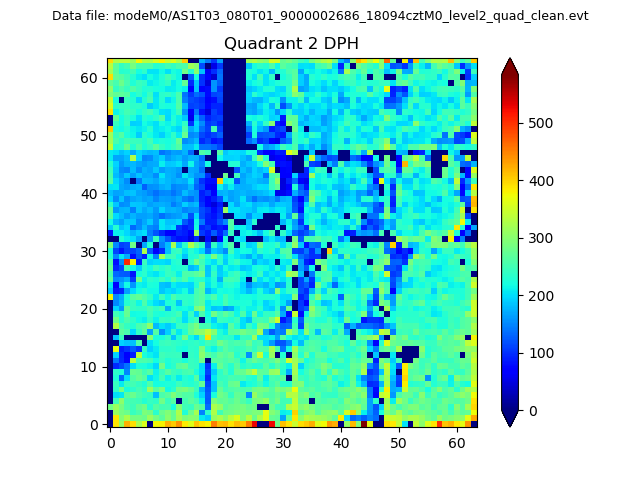 |
Quadrant C |
| Plot type | Count rate plots | Images |
|---|---|---|
| Comparison with Poisson distribution Blue bars denote a histogram of data divided into 1 sec bins. Red curve is a Poisson curve with rate = median count rate of data. |
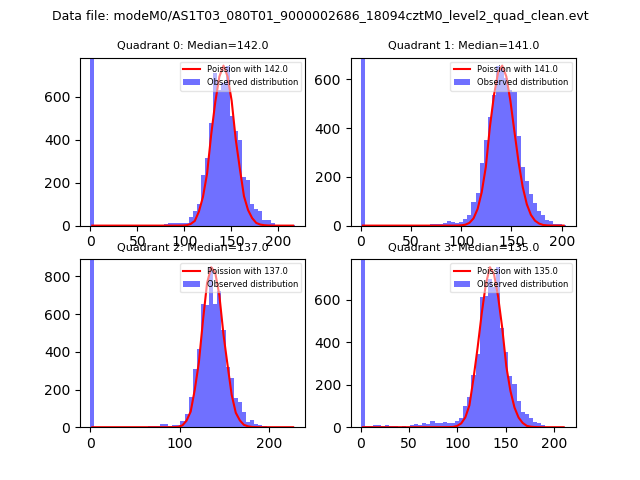 |
 |
| Quadrant-wise count rates Data is divided into 100 sec bins |
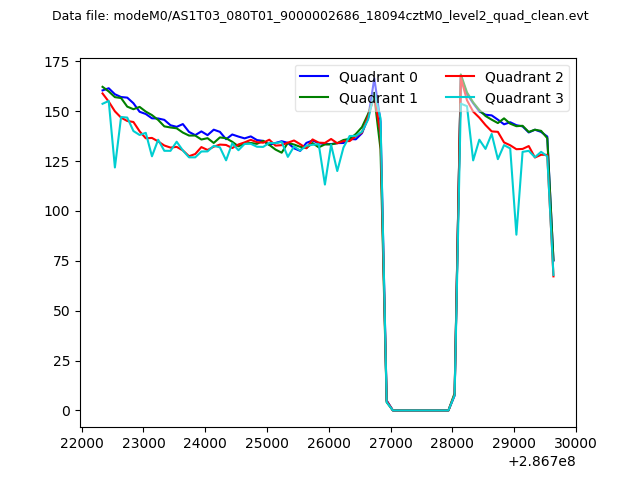 |
|
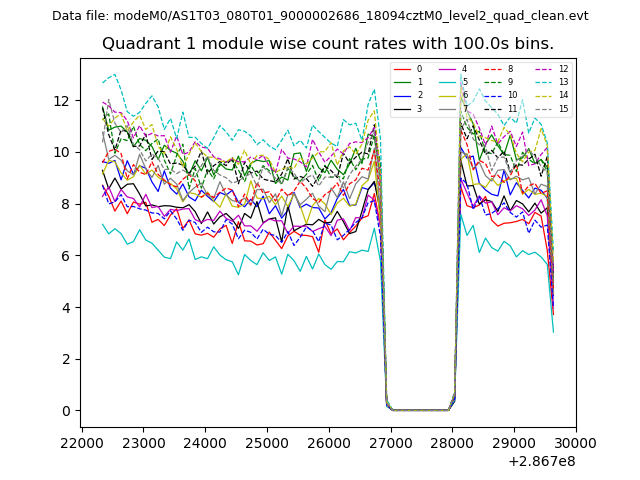
| Module-wise count rates for Quadrant A Data is divided into 100 sec bins |
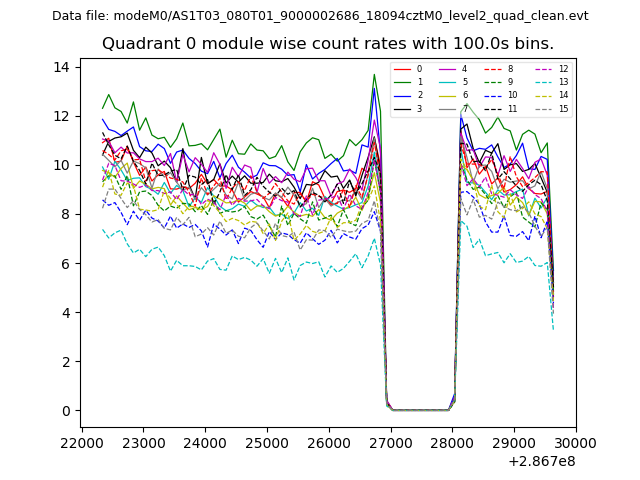 |
 |
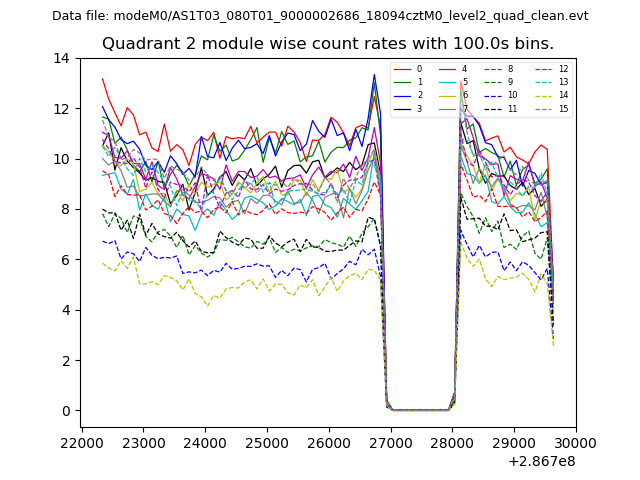
| Module-wise count rates for Quadrant B Data is divided into 100 sec bins |
 |
 |
| Module-wise count rates for Quadrant C Data is divided into 100 sec bins |
 |
 |
| Module-wise count rates for Quadrant D Data is divided into 100 sec bins |
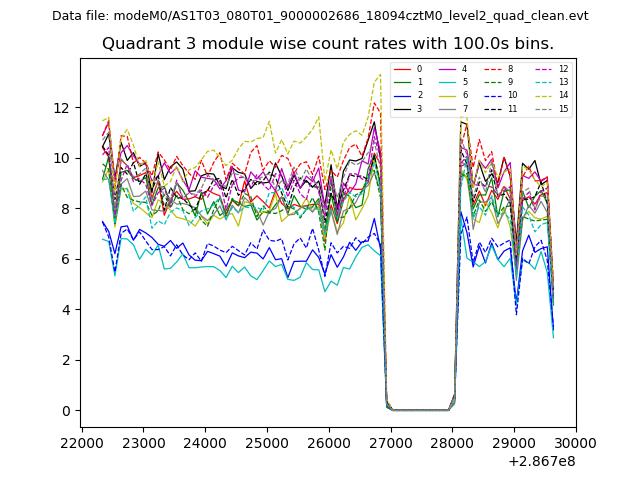 |
 |
| Parameter | Plot |
|---|---|
| CZT HV Monitor | 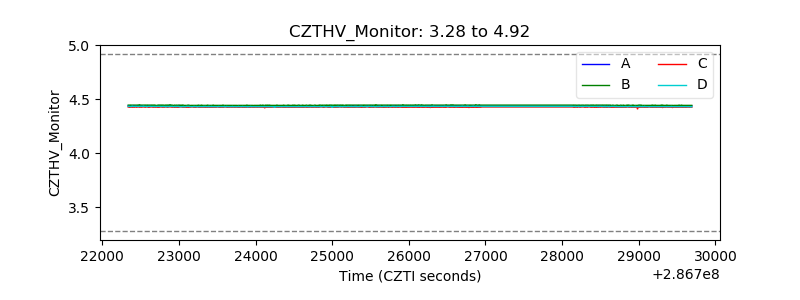 |
| D_VDD | 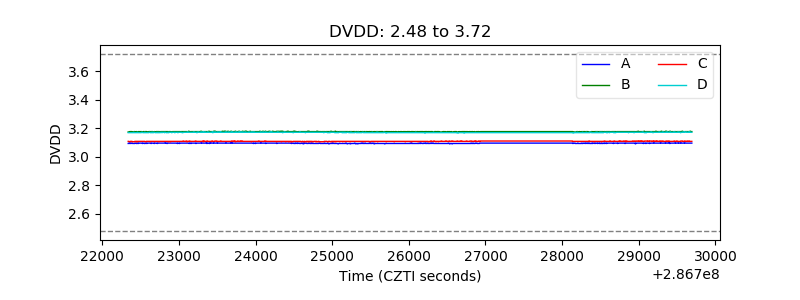 |
| Temperature 1 | 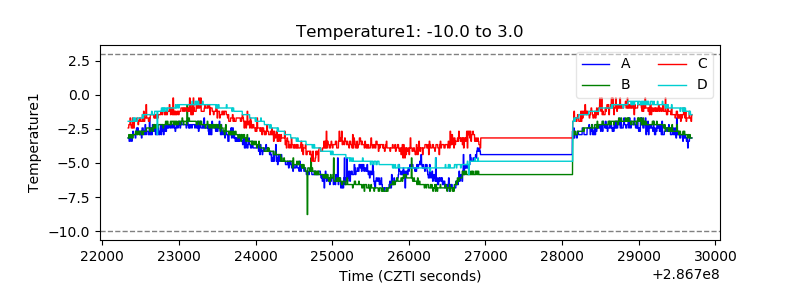 |
| Veto HV Monitor | 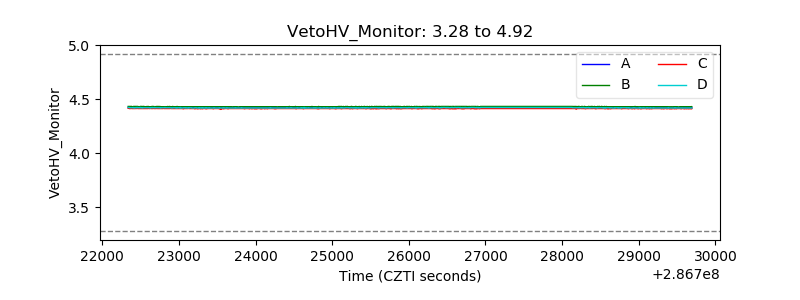 |
| Veto LLD | 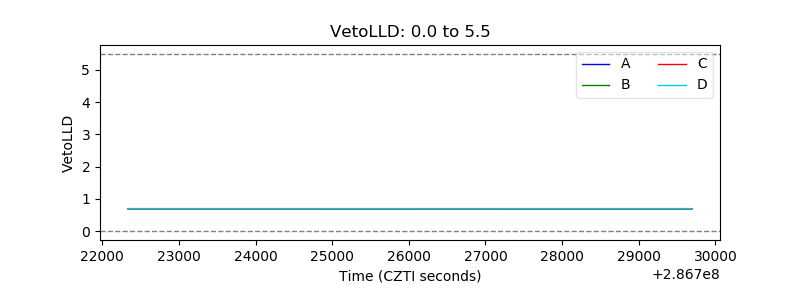 |
| Alpha Counter | 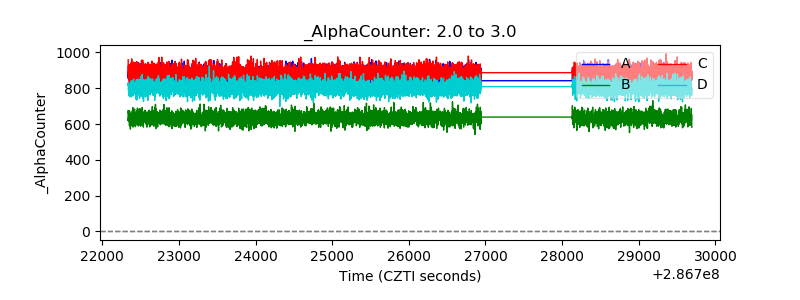 |
| _CPM_Rate | 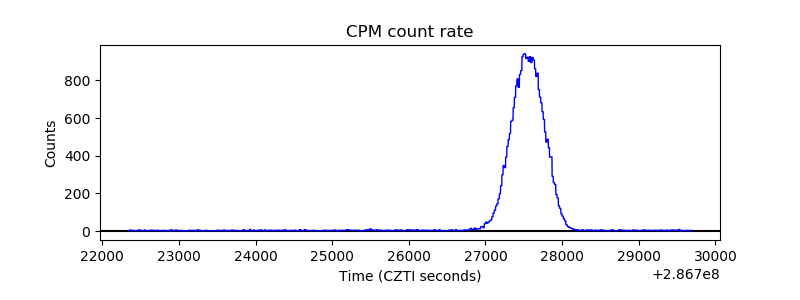 |
| CZT Counter | 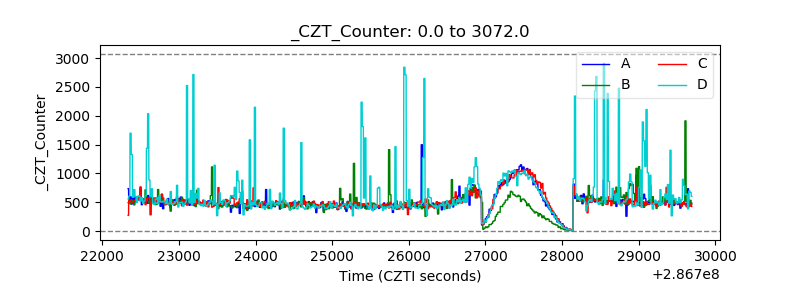 |
| +2.5 Volts monitor | 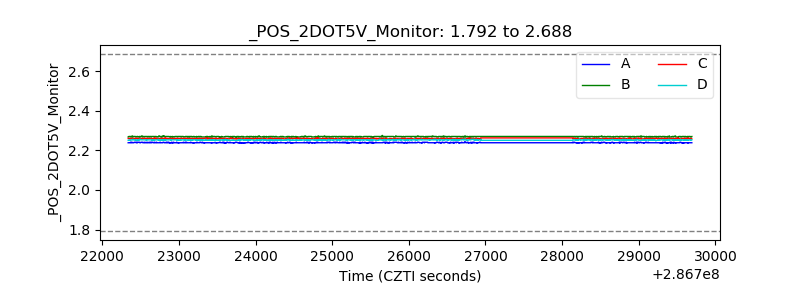 |
| +5 Volts monitor |  |
| _ROLL_ROT | 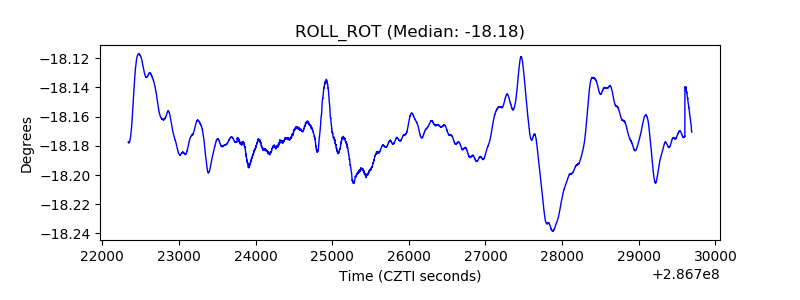 |
| _Roll_DEC |  |
| _Roll_RA | 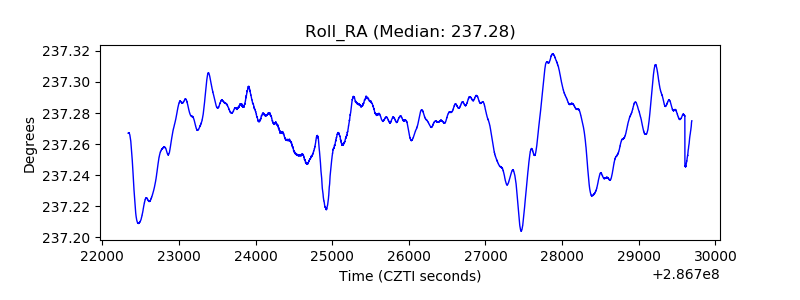 |
| Veto Counter | 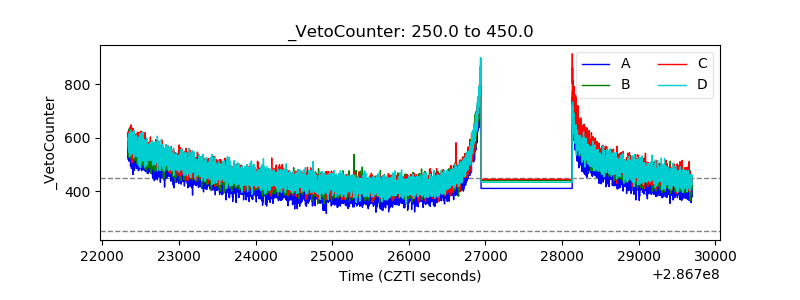 |