| Param | Original file | Final file |
|---|---|---|
| Filename | modeM0/AS1T03_080T01_9000002686_18095cztM0_level2.evt | modeM0/AS1T03_080T01_9000002686_18095cztM0_level2_quad_clean.evt |
| Size (bytes) | 492,888,960 | 122,843,520 |
| Size | 470.1 MB | 117.2 MB |
| Events in quadrant A | 2,983,179 | 844,050 |
| Events in quadrant B | 3,214,100 | 845,043 |
| Events in quadrant C | 3,015,560 | 819,596 |
| Events in quadrant D | 5,286,996 | 772,694 |
| Mode M9 | |||
|---|---|---|---|
| Quadrant | BADHDUFLAG | Total packets | Discarded packets |
| A | 0 | 10 | 0 |
| B | 0 | 10 | 0 |
| C | 0 | 10 | 0 |
| D | 0 | 10 | 0 |
| Mode SS | |||
|---|---|---|---|
| Quadrant | BADHDUFLAG | Total packets | Discarded packets |
| A | 0 | 128 | 0 |
| B | 0 | 128 | 0 |
| C | 0 | 128 | 0 |
| D | 0 | 128 | 0 |
| Mode M0 | |||
|---|---|---|---|
| Quadrant | BADHDUFLAG | Total packets | Discarded packets |
| A | 0 | 13024 | 1 |
| B | 0 | 13641 | 1 |
| C | 0 | 12862 | 1 |
| D | 0 | 19916 | 1 |
| Quadrant | Total seconds | Saturated seconds | Saturation percentage |
|---|---|---|---|
| A | 6288 | 94 | 1.494911% |
| B | 6288 | 109 | 1.733461% |
| C | 6289 | 118 | 1.876292% |
| D | 6289 | 749 | 11.909684% |
Noise dominated data is calculated using 1-second bins in cleaned event files. If a bin has >2000 counts, and if more than 50% of those come from <1% of pixels, then it is considered to be noise-dominated and hence unusable.
| Quadrant | # 1 sec bins | Bins with >0 counts | Bins with >2000 counts | High rate bins dominated by noise | Noise dominated (total time) | Noise dominated (detector-on time) | Marked lightcurve |
|---|---|---|---|---|---|---|---|
| A | 7268 | 6289 | 3 | 3 | 0.04% | 0.05% | 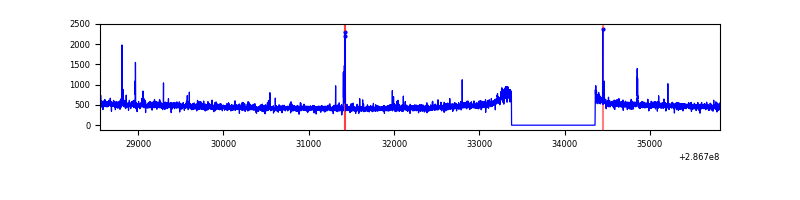 |
| B | 7268 | 6289 | 8 | 8 | 0.11% | 0.13% | 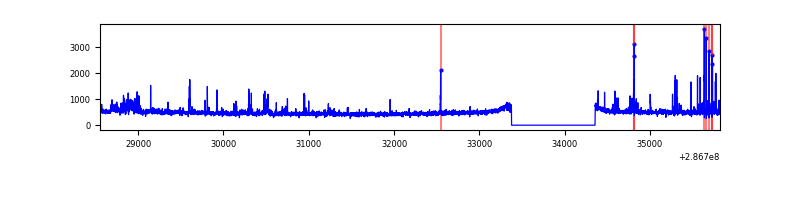 |
| C | 7269 | 6290 | 0 | 0 | 0.00% | 0.00% | 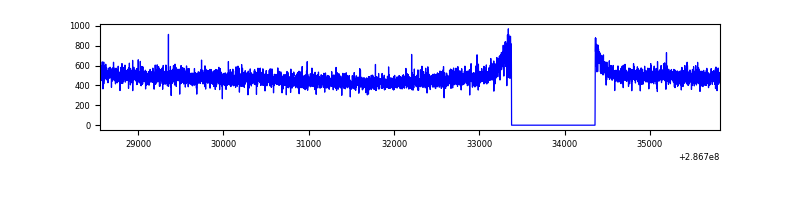 |
| D | 7269 | 6290 | 499 | 499 | 6.86% | 7.93% | 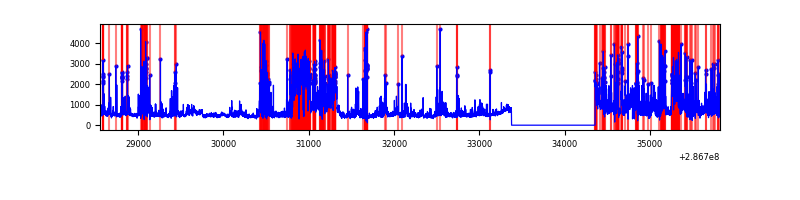 |
Top three noisy pixels from each quadrant. If the there are fewer than three noisy pixels in the level2.evt file, extra rows are filled as -1
| Pixel properties | Quadrant properties | ||||||
|---|---|---|---|---|---|---|---|
| Quadrant | DetID | PixID | Counts | Sigma | Mean | Median | Sigma |
| A | 4 | 2 | 47349 | 307.37 | 760 | 746 | 151.6 |
| A | 15 | 174 | 14366 | 89.83 | 760 | 746 | 151.6 |
| A | 0 | 226 | 6635 | 38.84 | 760 | 746 | 151.6 |
| B | 0 | 189 | 95689 | 671.44 | 753 | 731 | 141.4 |
| B | 0 | 197 | 65120 | 455.29 | 753 | 731 | 141.4 |
| B | 4 | 171 | 30998 | 214.02 | 753 | 731 | 141.4 |
| C | 14 | 238 | 113679 | 667.77 | 731 | 734 | 169.1 |
| C | 3 | 233 | 44629 | 259.52 | 731 | 734 | 169.1 |
| C | 13 | 61 | 5216 | 26.5 | 731 | 734 | 169.1 |
| D | 7 | 238 | 1059947 | 6107.26 | 714 | 693 | 173.4 |
| D | 11 | 176 | 958102 | 5520.06 | 714 | 693 | 173.4 |
| D | 1 | 52 | 477643 | 2749.92 | 714 | 693 | 173.4 |
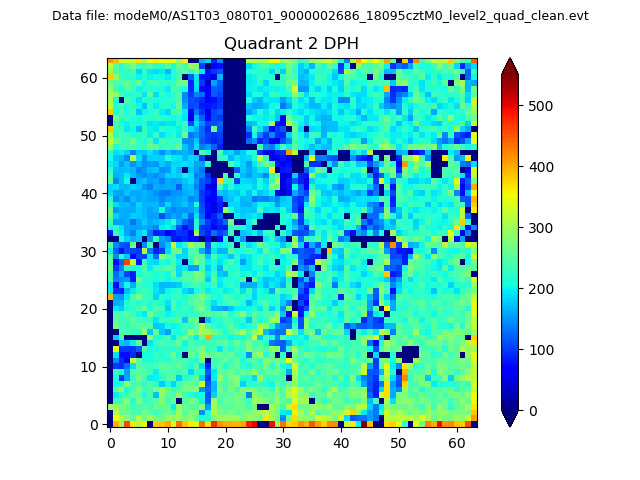
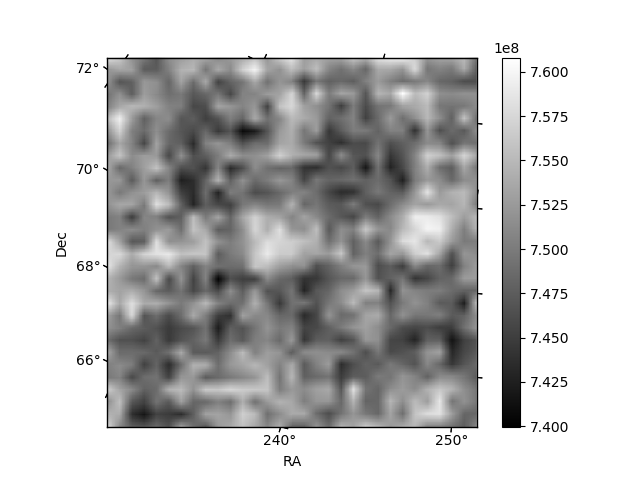
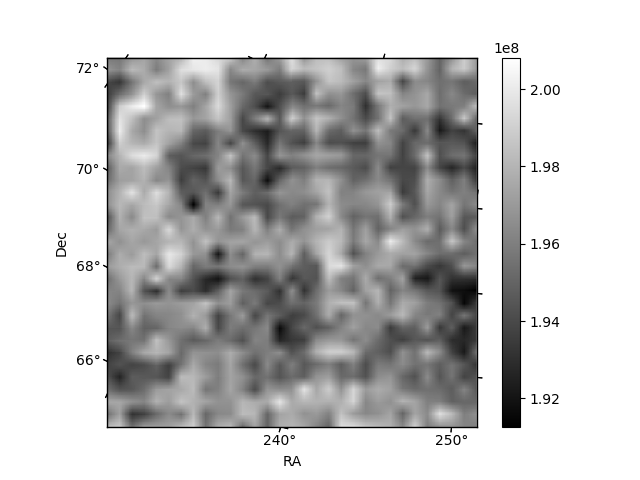
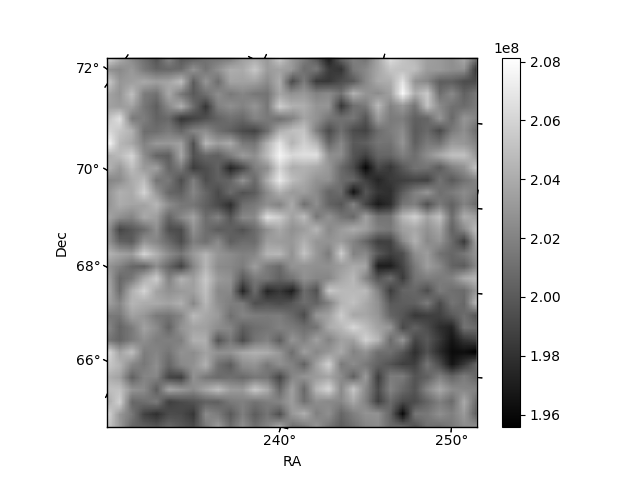
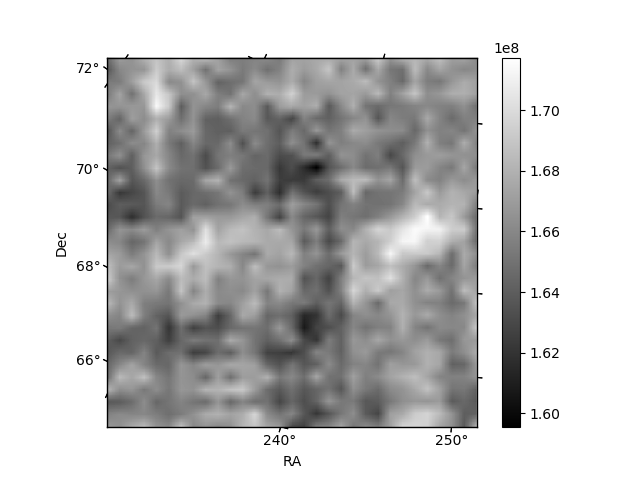
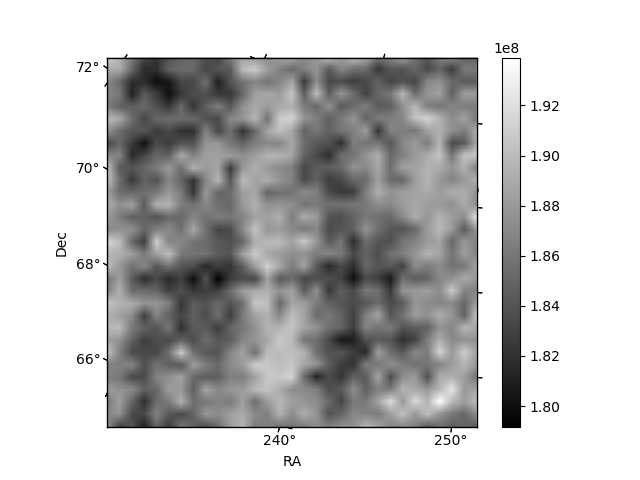
Histogram calculated using DETX and DETY for each event in the final _common_clean file
| Quadrant A | 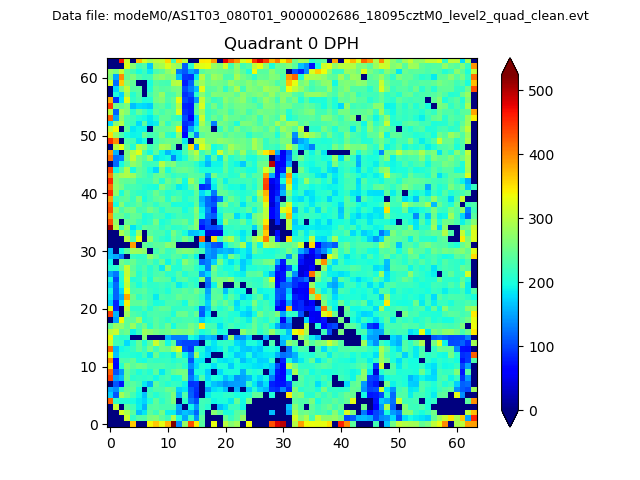 |
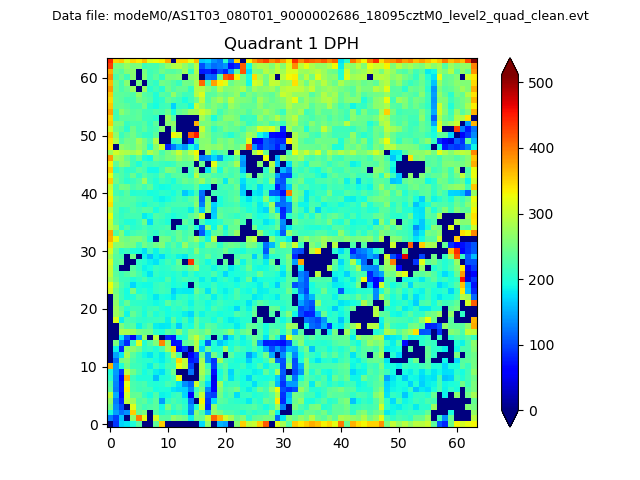 |
Quadrant B |
|---|---|---|---|
| Quadrant D | 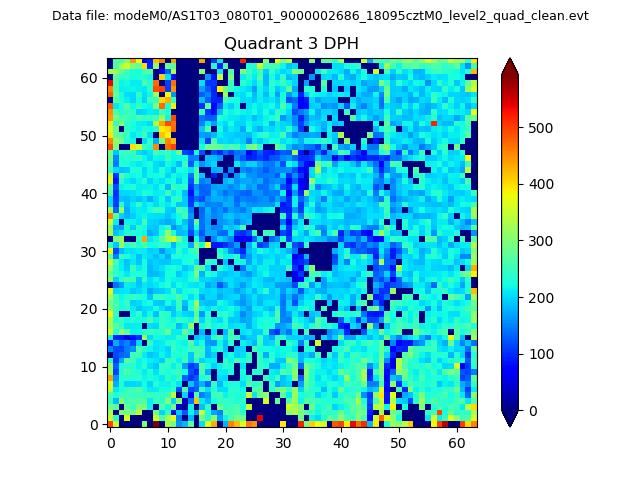 |
 |
Quadrant C |
| Plot type | Count rate plots | Images |
|---|---|---|
| Comparison with Poisson distribution Blue bars denote a histogram of data divided into 1 sec bins. Red curve is a Poisson curve with rate = median count rate of data. |
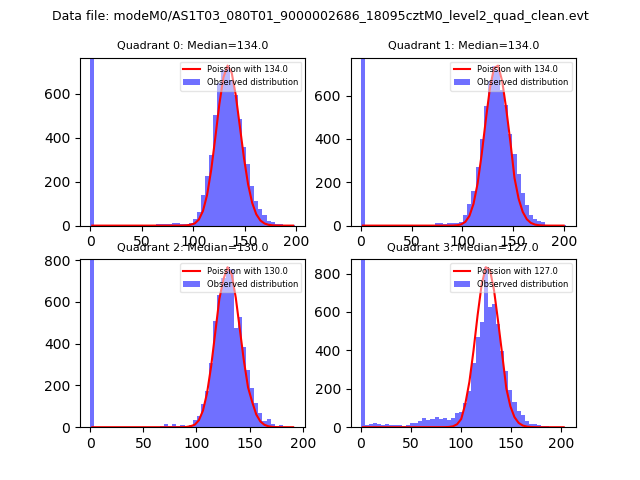 |
 |
| Quadrant-wise count rates Data is divided into 100 sec bins |
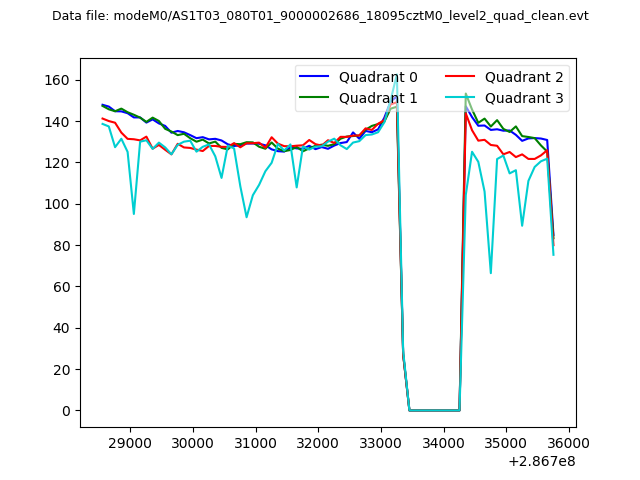 |
|
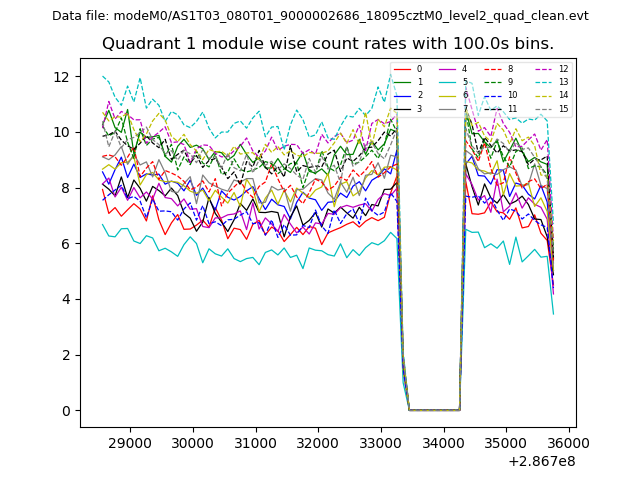
| Module-wise count rates for Quadrant A Data is divided into 100 sec bins |
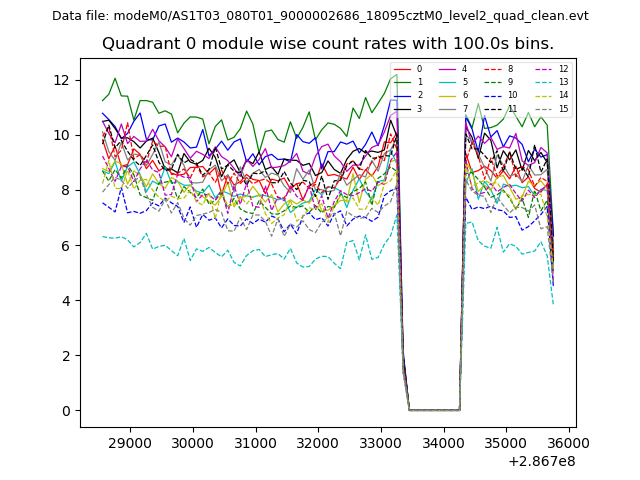 |
 |
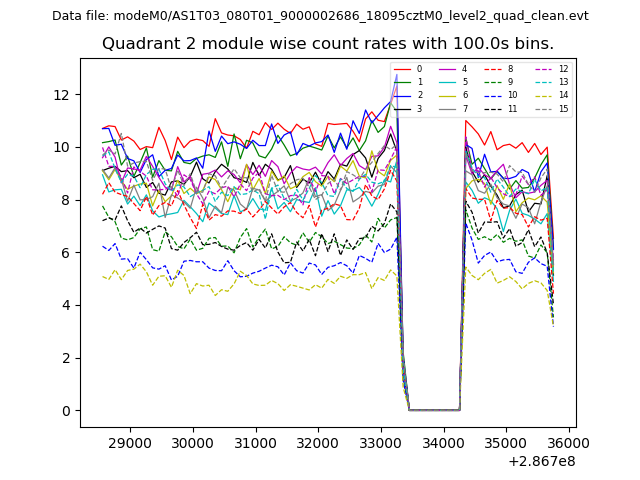
| Module-wise count rates for Quadrant B Data is divided into 100 sec bins |
 |
 |
| Module-wise count rates for Quadrant C Data is divided into 100 sec bins |
 |
 |
| Module-wise count rates for Quadrant D Data is divided into 100 sec bins |
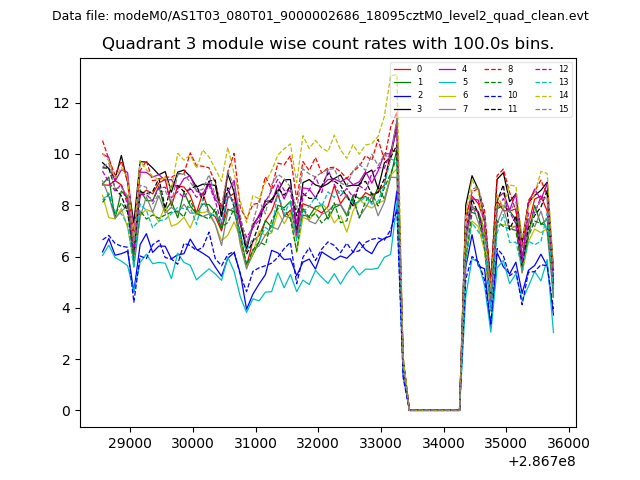 |
 |
| Parameter | Plot |
|---|---|
| CZT HV Monitor | 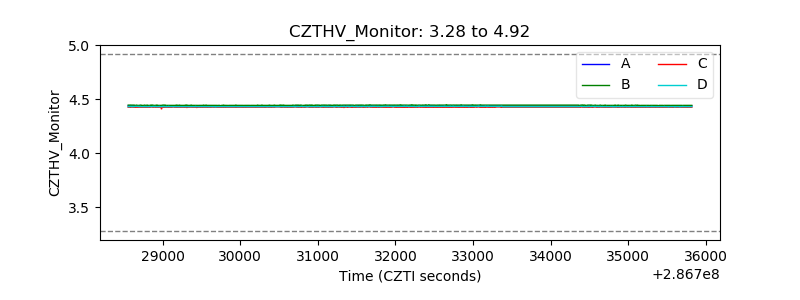 |
| D_VDD | 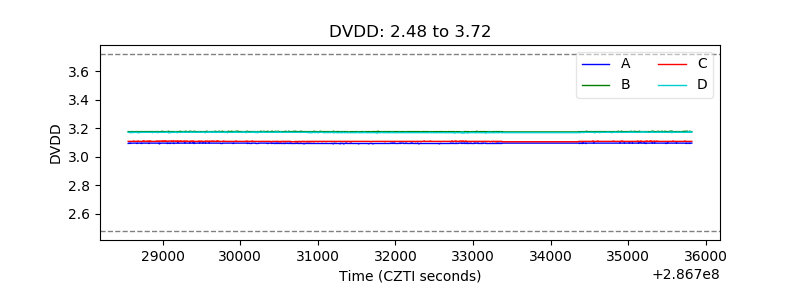 |
| Temperature 1 | 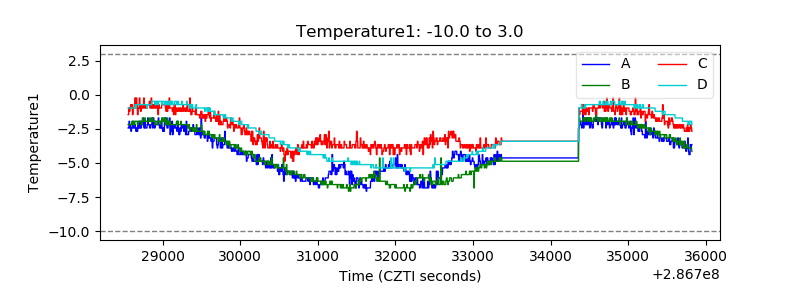 |
| Veto HV Monitor |  |
| Veto LLD | 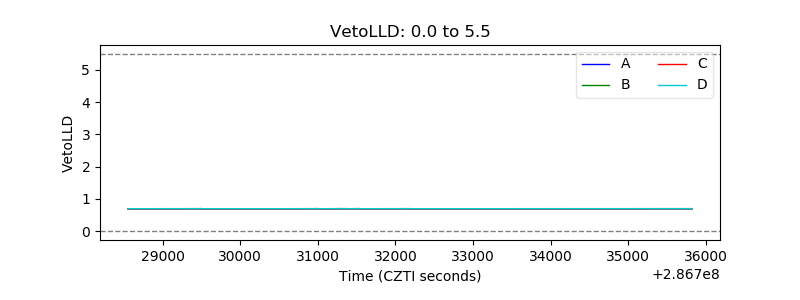 |
| Alpha Counter | 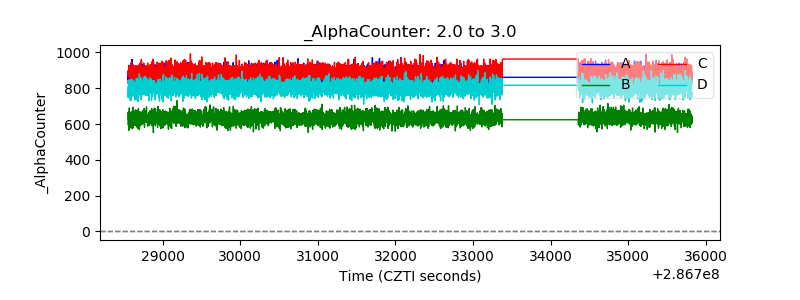 |
| _CPM_Rate | 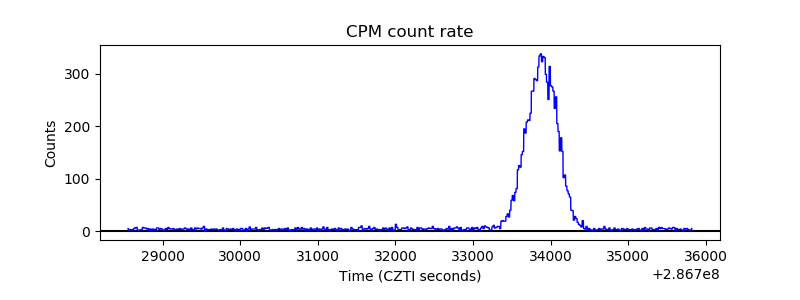 |
| CZT Counter | 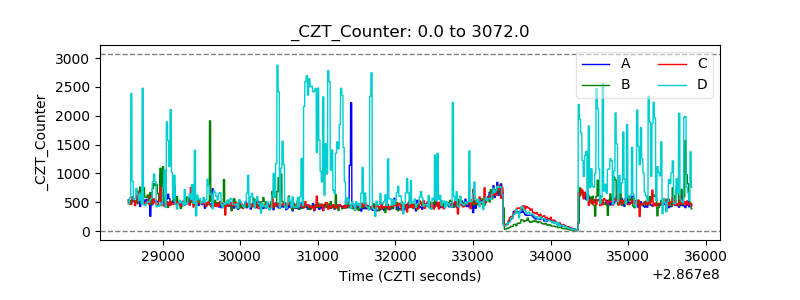 |
| +2.5 Volts monitor |  |
| +5 Volts monitor |  |
| _ROLL_ROT | 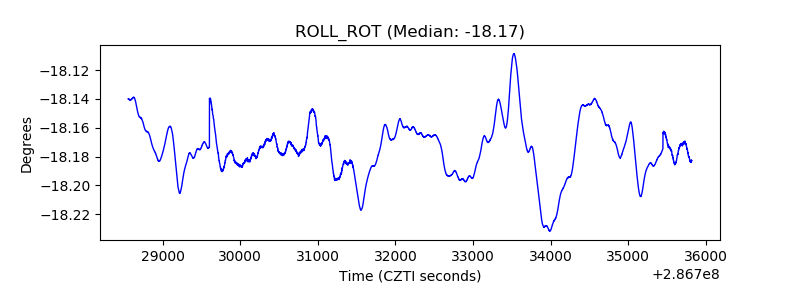 |
| _Roll_DEC | 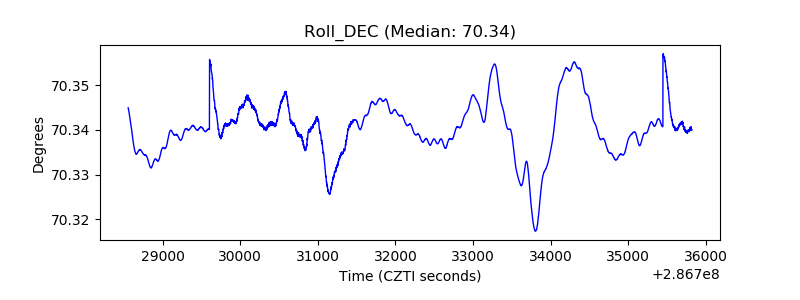 |
| _Roll_RA | 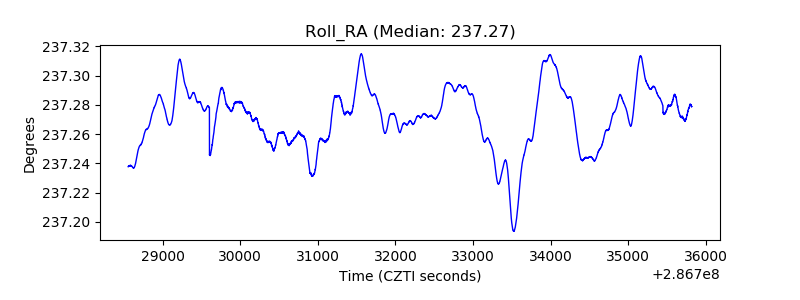 |
| Veto Counter | 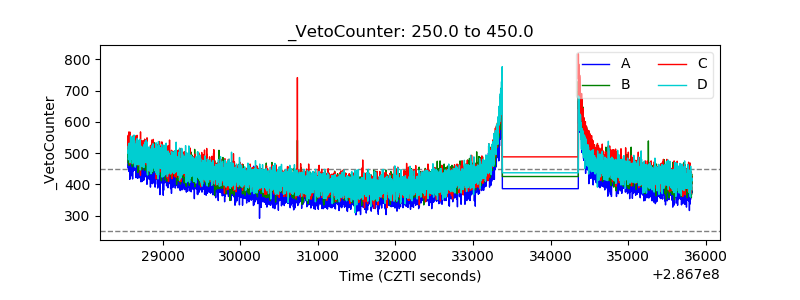 |