| Param | Original file | Final file |
|---|---|---|
| Filename | modeM0/AS1T03_080T01_9000002686_18097cztM0_level2.evt | modeM0/AS1T03_080T01_9000002686_18097cztM0_level2_quad_clean.evt |
| Size (bytes) | 601,441,920 | 135,996,480 |
| Size | 573.6 MB | 129.7 MB |
| Events in quadrant A | 3,434,115 | 932,814 |
| Events in quadrant B | 3,736,917 | 937,267 |
| Events in quadrant C | 3,475,133 | 914,609 |
| Events in quadrant D | 7,066,868 | 819,284 |
| Mode M9 | |||
|---|---|---|---|
| Quadrant | BADHDUFLAG | Total packets | Discarded packets |
| A | 0 | 2 | 0 |
| B | 0 | 2 | 0 |
| C | 0 | 2 | 0 |
| D | 0 | 2 | 0 |
| Mode SS | |||
|---|---|---|---|
| Quadrant | BADHDUFLAG | Total packets | Discarded packets |
| A | 0 | 152 | 0 |
| B | 0 | 152 | 0 |
| C | 0 | 152 | 0 |
| D | 0 | 152 | 0 |
| Mode M0 | |||
|---|---|---|---|
| Quadrant | BADHDUFLAG | Total packets | Discarded packets |
| A | 0 | 15318 | 1 |
| B | 0 | 16119 | 1 |
| C | 0 | 15172 | 1 |
| D | 0 | 25923 | 1 |
| Quadrant | Total seconds | Saturated seconds | Saturation percentage |
|---|---|---|---|
| A | 7392 | 54 | 0.730519% |
| B | 7392 | 152 | 2.056277% |
| C | 7393 | 132 | 1.785473% |
| D | 7393 | 1297 | 17.543622% |
Noise dominated data is calculated using 1-second bins in cleaned event files. If a bin has >2000 counts, and if more than 50% of those come from <1% of pixels, then it is considered to be noise-dominated and hence unusable.
| Quadrant | # 1 sec bins | Bins with >0 counts | Bins with >2000 counts | High rate bins dominated by noise | Noise dominated (total time) | Noise dominated (detector-on time) | Marked lightcurve |
|---|---|---|---|---|---|---|---|
| A | 7582 | 7394 | 1 | 1 | 0.01% | 0.01% | 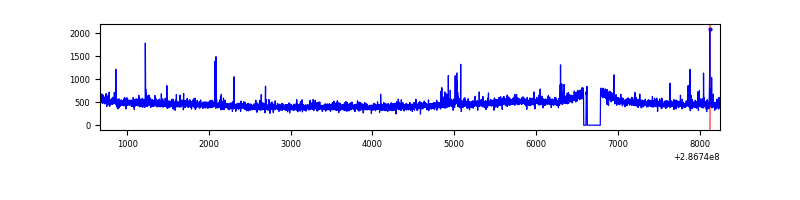 |
| B | 7582 | 7394 | 16 | 16 | 0.21% | 0.22% | 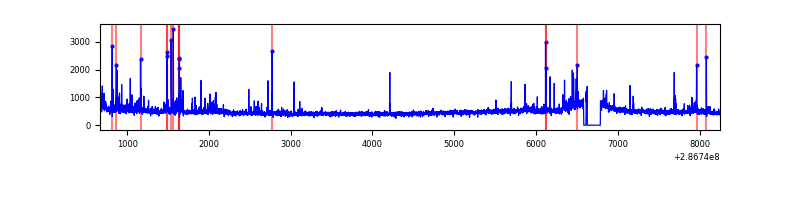 |
| C | 7583 | 7395 | 0 | 0 | 0.00% | 0.00% | 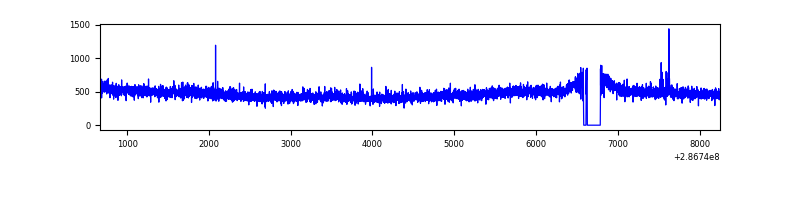 |
| D | 7583 | 7395 | 1008 | 1008 | 13.29% | 13.63% | 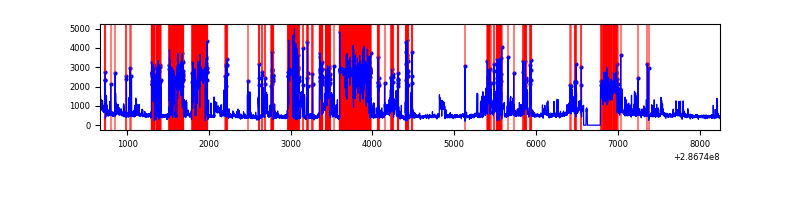 |
Top three noisy pixels from each quadrant. If the there are fewer than three noisy pixels in the level2.evt file, extra rows are filled as -1
| Pixel properties | Quadrant properties | ||||||
|---|---|---|---|---|---|---|---|
| Quadrant | DetID | PixID | Counts | Sigma | Mean | Median | Sigma |
| A | 4 | 2 | 47836 | 266.34 | 874 | 854 | 176.4 |
| A | 15 | 174 | 18200 | 98.33 | 874 | 854 | 176.4 |
| A | 0 | 226 | 7536 | 37.88 | 874 | 854 | 176.4 |
| B | 7 | 220 | 146343 | 882.97 | 869 | 846 | 164.8 |
| B | 3 | 64 | 55321 | 330.59 | 869 | 846 | 164.8 |
| B | 0 | 189 | 41702 | 247.94 | 869 | 846 | 164.8 |
| C | 14 | 238 | 129886 | 651.49 | 844 | 847 | 198.1 |
| C | 3 | 233 | 41552 | 205.51 | 844 | 847 | 198.1 |
| C | 2 | 1 | 7110 | 31.62 | 844 | 847 | 198.1 |
| D | 7 | 238 | 1953319 | 9987.47 | 796 | 770 | 195.5 |
| D | 11 | 176 | 1860096 | 9510.63 | 796 | 770 | 195.5 |
| D | 13 | 232 | 50414 | 253.93 | 796 | 770 | 195.5 |
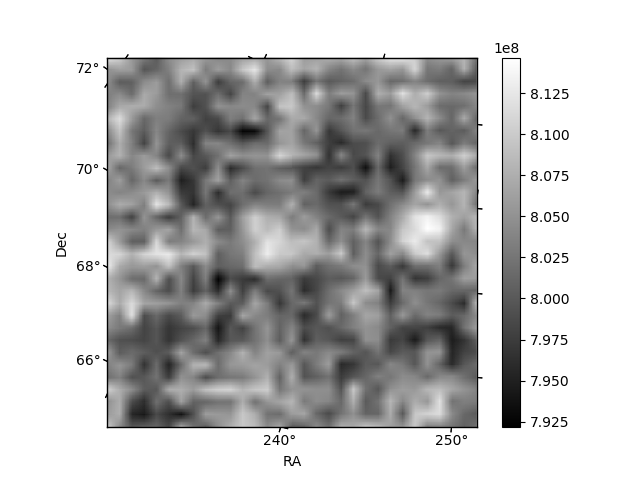
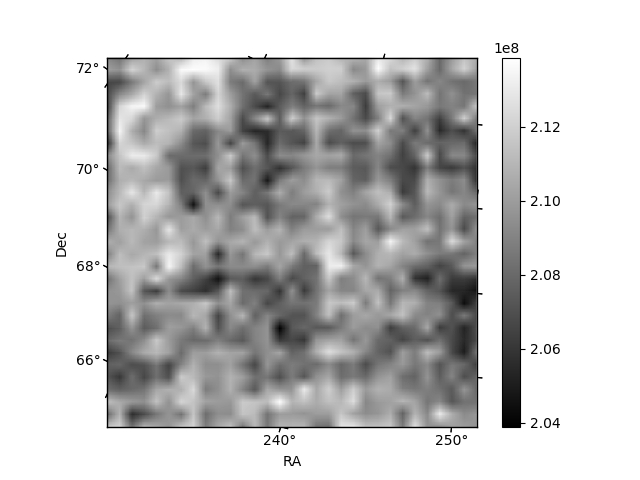
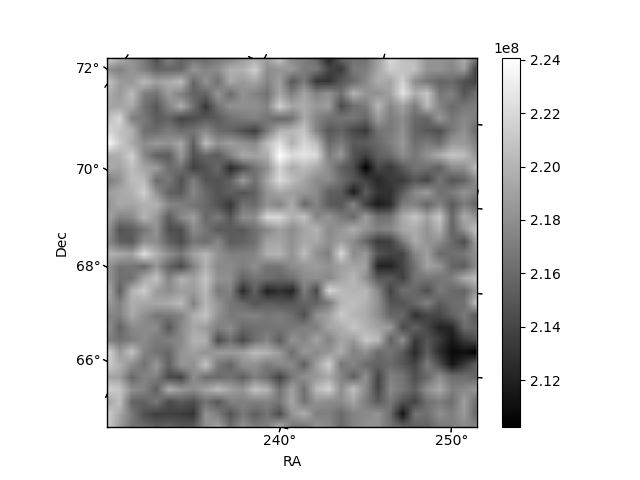
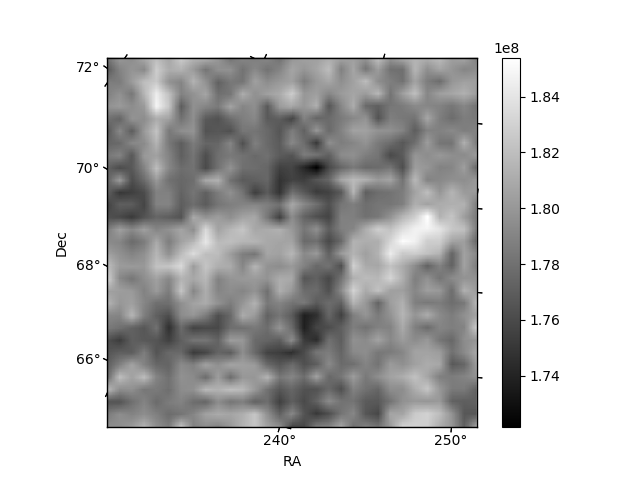
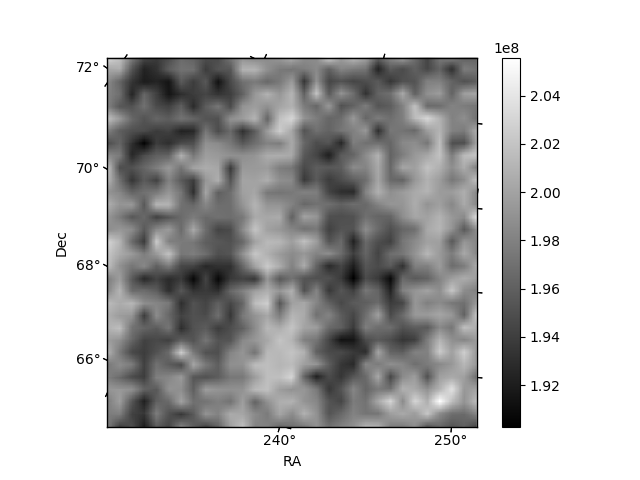
Histogram calculated using DETX and DETY for each event in the final _common_clean file
| Quadrant A | 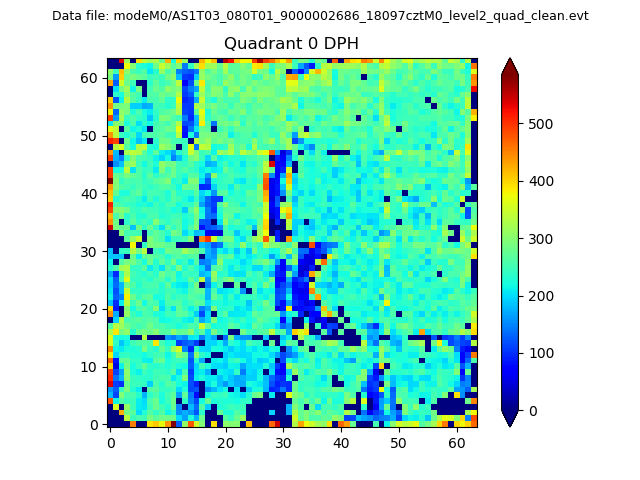 |
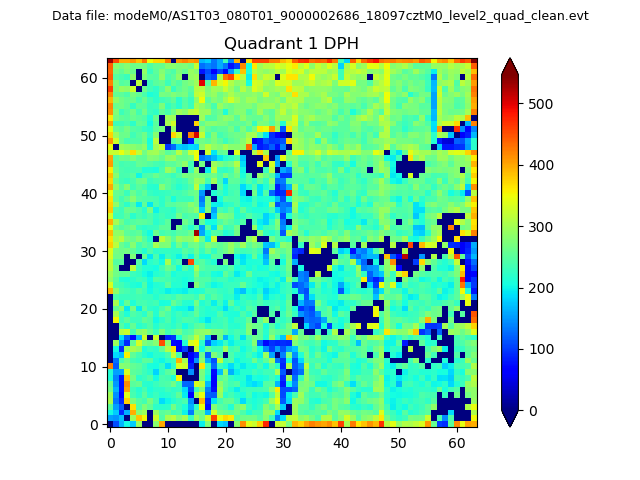 |
Quadrant B |
|---|---|---|---|
| Quadrant D | 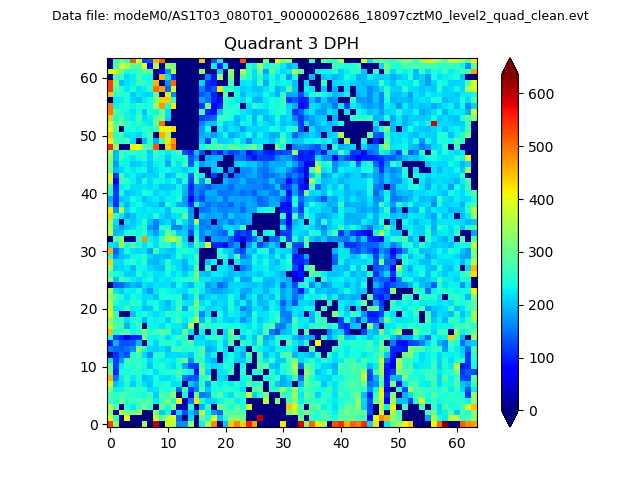 |
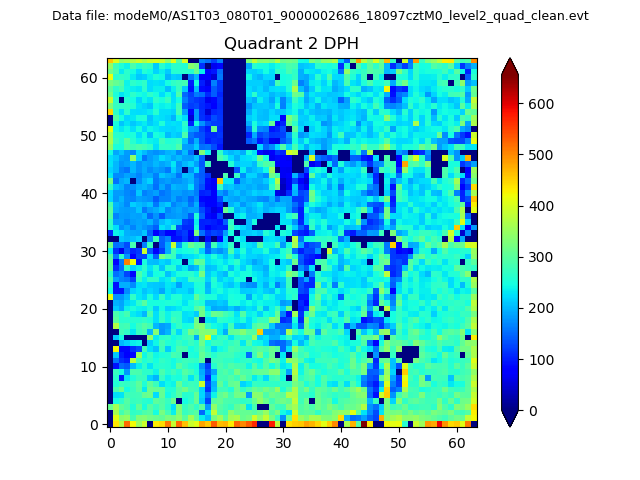 |
Quadrant C |
| Plot type | Count rate plots | Images |
|---|---|---|
| Comparison with Poisson distribution Blue bars denote a histogram of data divided into 1 sec bins. Red curve is a Poisson curve with rate = median count rate of data. |
 |
 |
| Quadrant-wise count rates Data is divided into 100 sec bins |
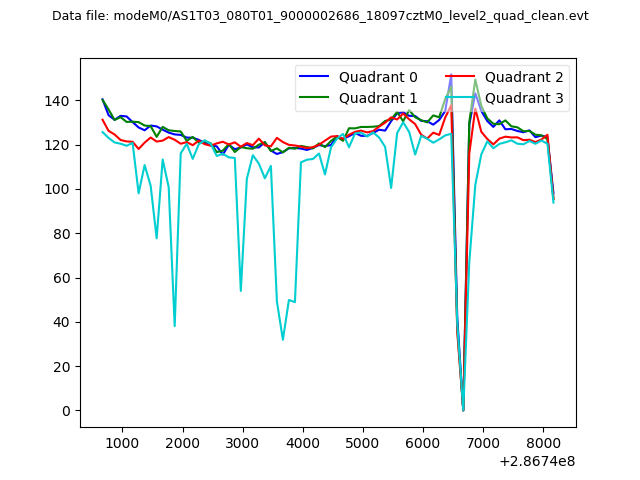 |
|
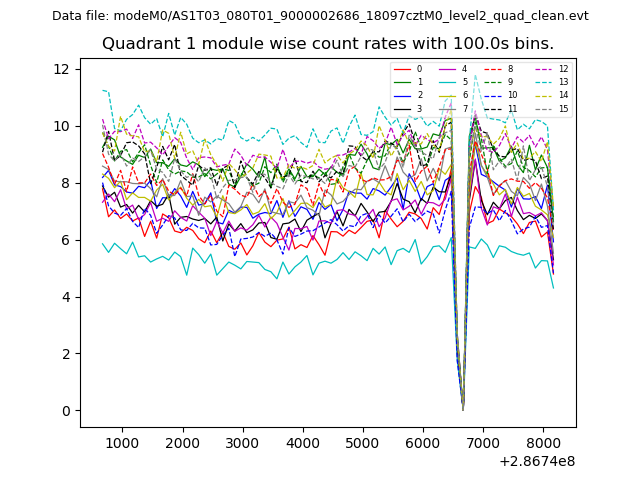
| Module-wise count rates for Quadrant A Data is divided into 100 sec bins |
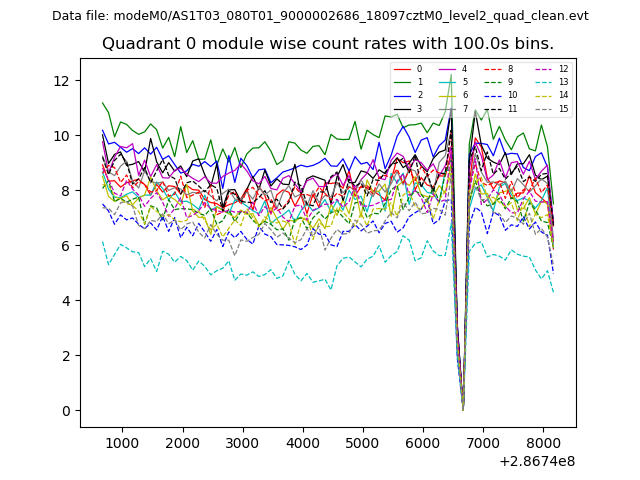 |
 |
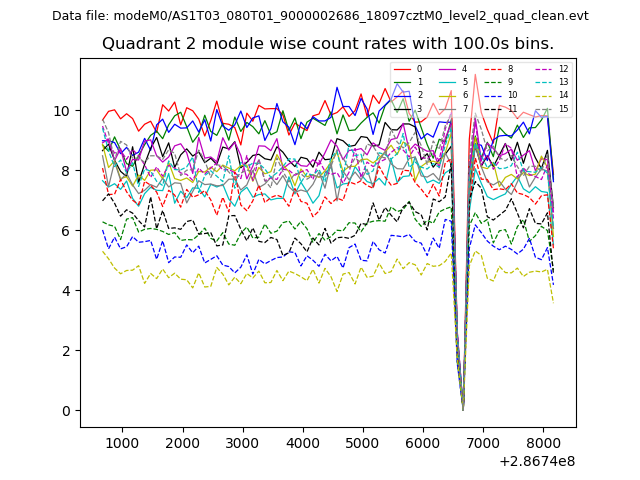
| Module-wise count rates for Quadrant B Data is divided into 100 sec bins |
 |
 |
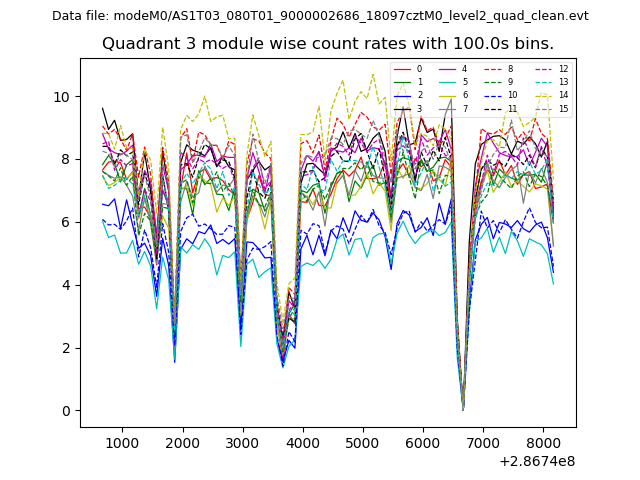
| Module-wise count rates for Quadrant C Data is divided into 100 sec bins |
 |
 |
| Module-wise count rates for Quadrant D Data is divided into 100 sec bins |
 |
 |
| Parameter | Plot |
|---|---|
| CZT HV Monitor | 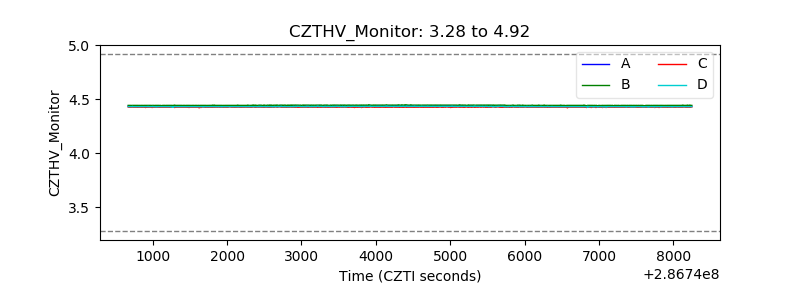 |
| D_VDD | 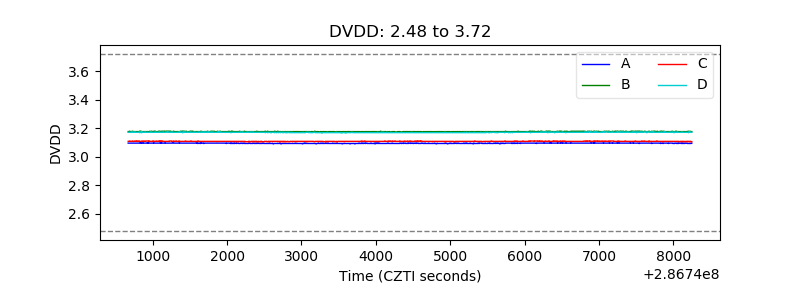 |
| Temperature 1 | 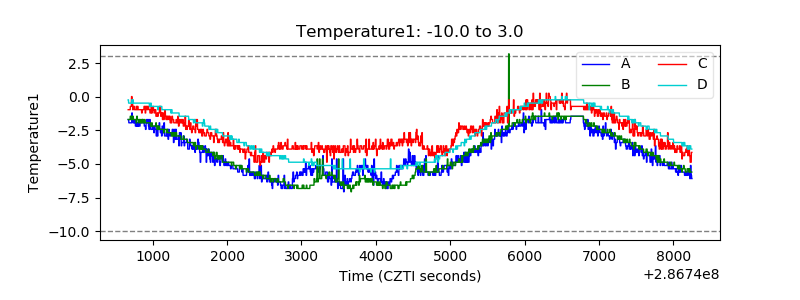 |
| Veto HV Monitor | 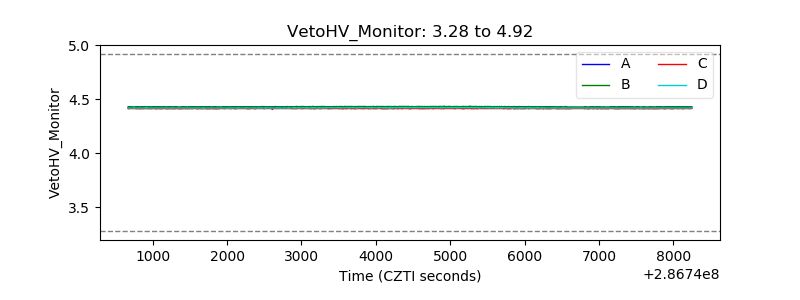 |
| Veto LLD | 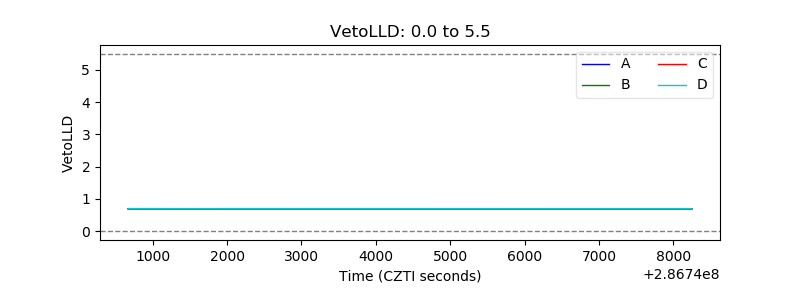 |
| Alpha Counter | 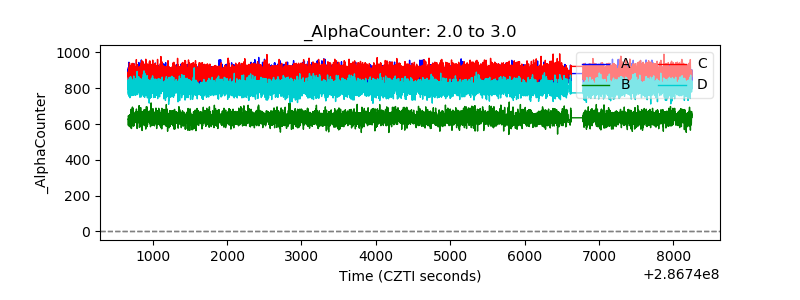 |
| _CPM_Rate | 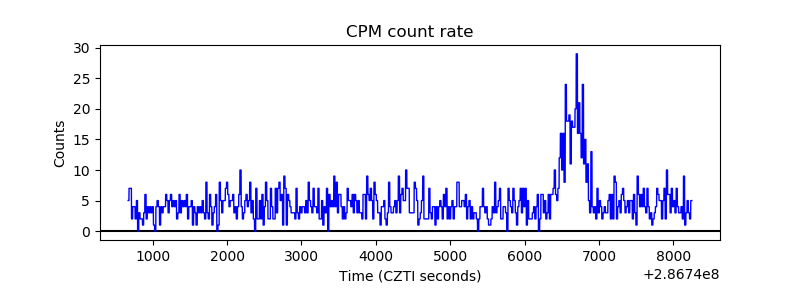 |
| CZT Counter | 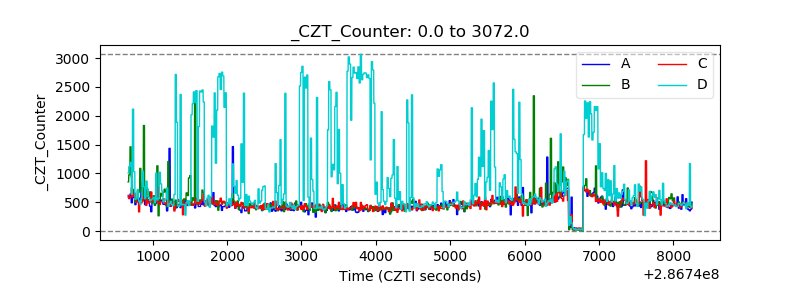 |
| +2.5 Volts monitor |  |
| +5 Volts monitor |  |
| _ROLL_ROT | 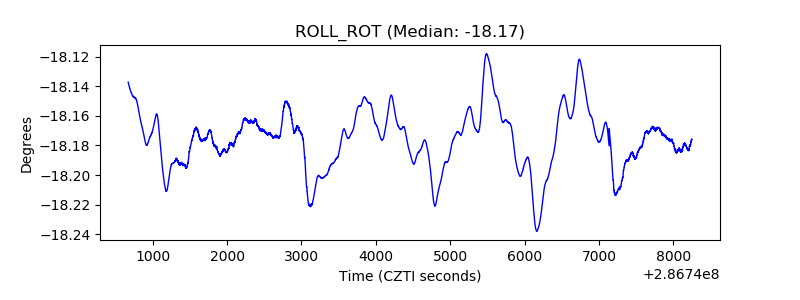 |
| _Roll_DEC | 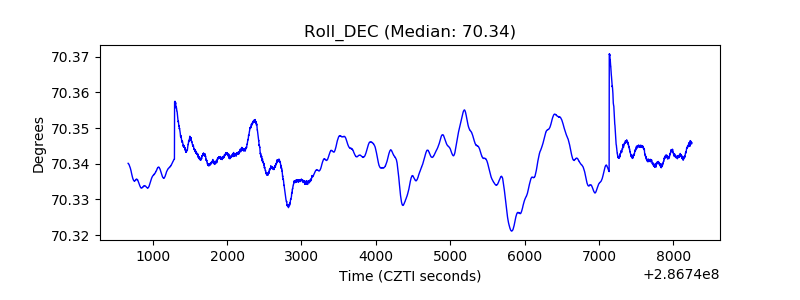 |
| _Roll_RA | 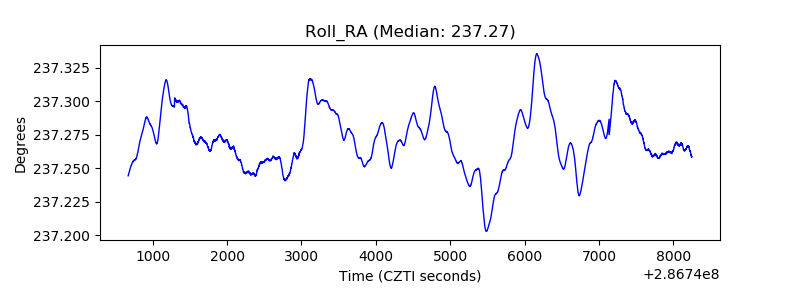 |
| Veto Counter | 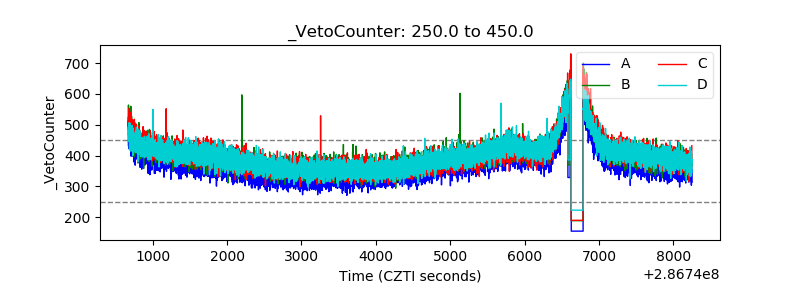 |