| Param | Original file | Final file |
|---|---|---|
| Filename | modeM0/AS1T03_080T01_9000002686_18098cztM0_level2.evt | modeM0/AS1T03_080T01_9000002686_18098cztM0_level2_quad_clean.evt |
| Size (bytes) | 348,534,720 | 80,343,360 |
| Size | 332.4 MB | 76.6 MB |
| Events in quadrant A | 2,050,084 | 545,741 |
| Events in quadrant B | 2,073,905 | 549,414 |
| Events in quadrant C | 2,005,790 | 541,678 |
| Events in quadrant D | 4,121,755 | 482,763 |
| Mode M9 | |||
|---|---|---|---|
| Quadrant | BADHDUFLAG | Total packets | Discarded packets |
| A | 0 | 2 | 0 |
| B | 0 | 2 | 0 |
| C | 0 | 2 | 0 |
| D | 0 | 2 | 0 |
| Mode SS | |||
|---|---|---|---|
| Quadrant | BADHDUFLAG | Total packets | Discarded packets |
| A | 0 | 92 | 0 |
| B | 0 | 92 | 0 |
| C | 0 | 92 | 0 |
| D | 0 | 92 | 0 |
| Mode M0 | |||
|---|---|---|---|
| Quadrant | BADHDUFLAG | Total packets | Discarded packets |
| A | 0 | 9455 | 1 |
| B | 0 | 9433 | 1 |
| C | 0 | 9216 | 1 |
| D | 0 | 15388 | 1 |
| Quadrant | Total seconds | Saturated seconds | Saturation percentage |
|---|---|---|---|
| A | 4456 | 65 | 1.458707% |
| B | 4457 | 104 | 2.333408% |
| C | 4457 | 110 | 2.468028% |
| D | 4457 | 816 | 18.308279% |
Noise dominated data is calculated using 1-second bins in cleaned event files. If a bin has >2000 counts, and if more than 50% of those come from <1% of pixels, then it is considered to be noise-dominated and hence unusable.
| Quadrant | # 1 sec bins | Bins with >0 counts | Bins with >2000 counts | High rate bins dominated by noise | Noise dominated (total time) | Noise dominated (detector-on time) | Marked lightcurve |
|---|---|---|---|---|---|---|---|
| A | 4646 | 4458 | 17 | 17 | 0.37% | 0.38% | 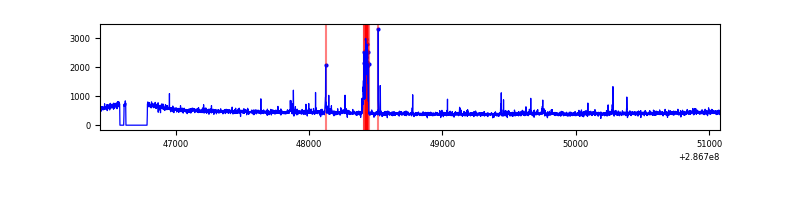 |
| B | 4647 | 4459 | 3 | 3 | 0.06% | 0.07% | 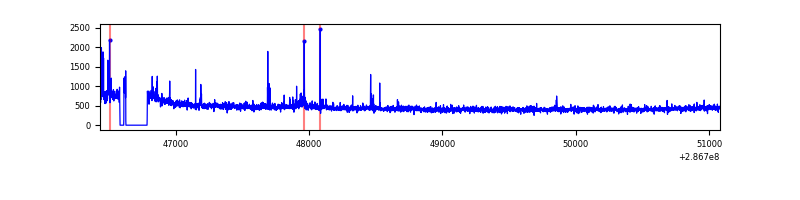 |
| C | 4647 | 4459 | 0 | 0 | 0.00% | 0.00% | 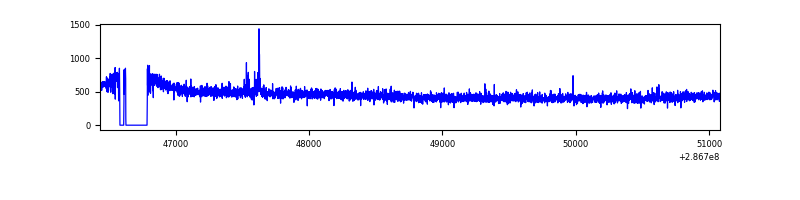 |
| D | 4647 | 4459 | 630 | 630 | 13.56% | 14.13% | 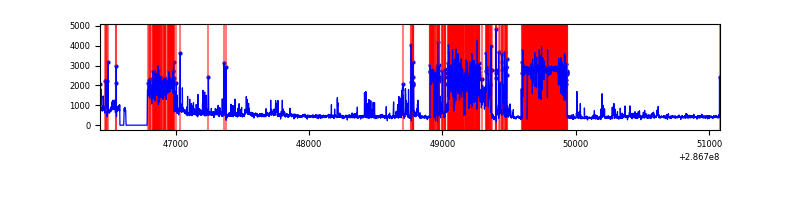 |
Top three noisy pixels from each quadrant. If the there are fewer than three noisy pixels in the level2.evt file, extra rows are filled as -1
| Pixel properties | Quadrant properties | ||||||
|---|---|---|---|---|---|---|---|
| Quadrant | DetID | PixID | Counts | Sigma | Mean | Median | Sigma |
| A | 15 | 174 | 72621 | 699.68 | 503 | 491 | 103.1 |
| A | 4 | 2 | 35576 | 340.33 | 503 | 491 | 103.1 |
| A | 3 | 15 | 4686 | 40.69 | 503 | 491 | 103.1 |
| B | 7 | 220 | 32452 | 331.52 | 505 | 491 | 96.4 |
| B | 4 | 216 | 16551 | 166.58 | 505 | 491 | 96.4 |
| B | 0 | 197 | 14379 | 144.05 | 505 | 491 | 96.4 |
| C | 14 | 238 | 75705 | 647.43 | 491 | 492 | 116.2 |
| C | 2 | 1 | 6601 | 52.59 | 491 | 492 | 116.2 |
| C | 9 | 160 | 4394 | 33.59 | 491 | 492 | 116.2 |
| D | 7 | 238 | 1543709 | 13573.35 | 457 | 443 | 113.7 |
| D | 11 | 176 | 741538 | 6518.08 | 457 | 443 | 113.7 |
| D | 14 | 34 | 32429 | 281.32 | 457 | 443 | 113.7 |
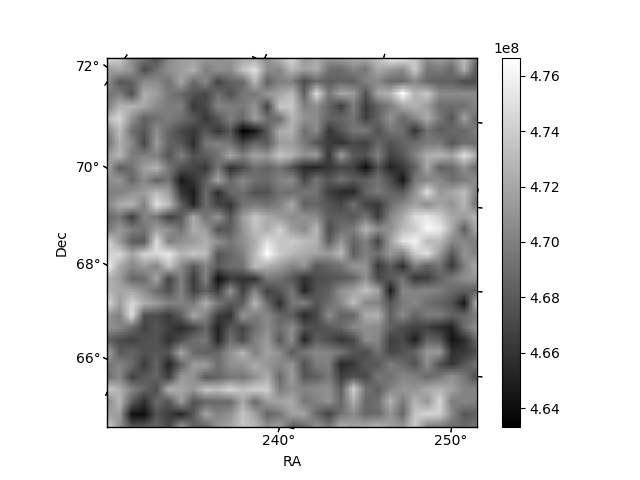
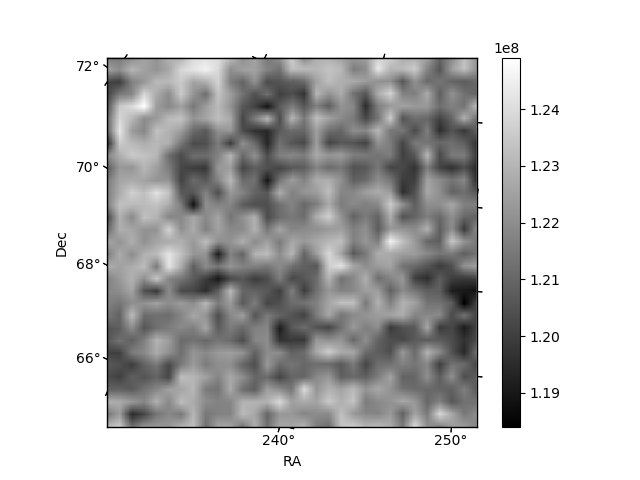
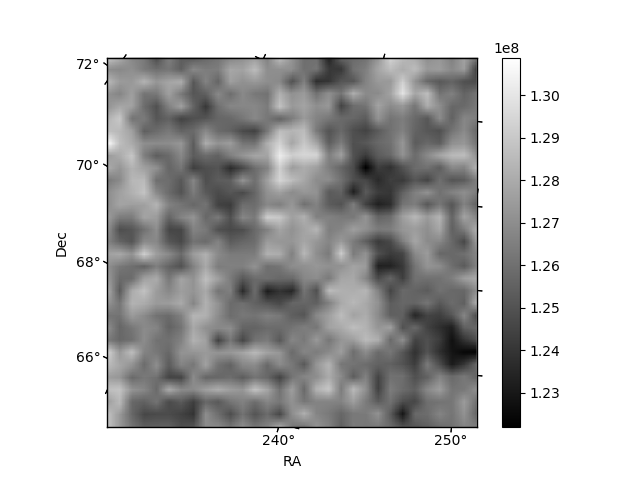
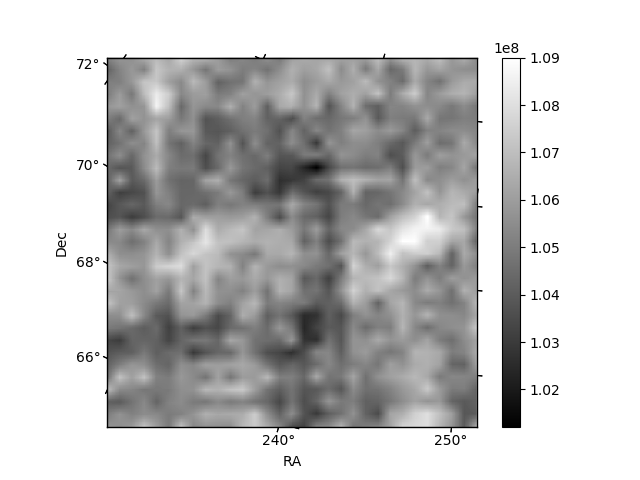
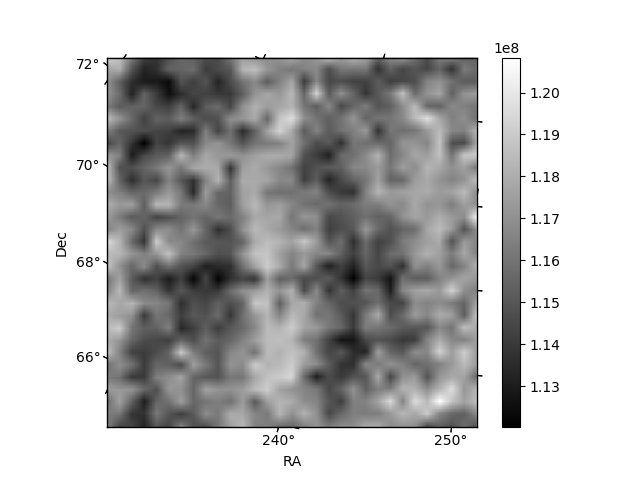
Histogram calculated using DETX and DETY for each event in the final _common_clean file
| Quadrant A | 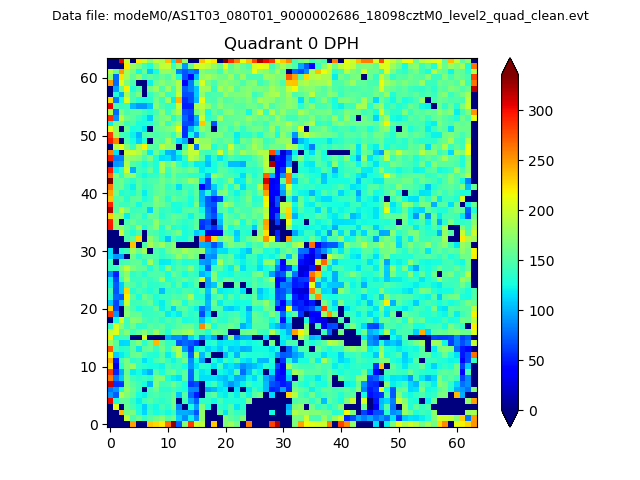 |
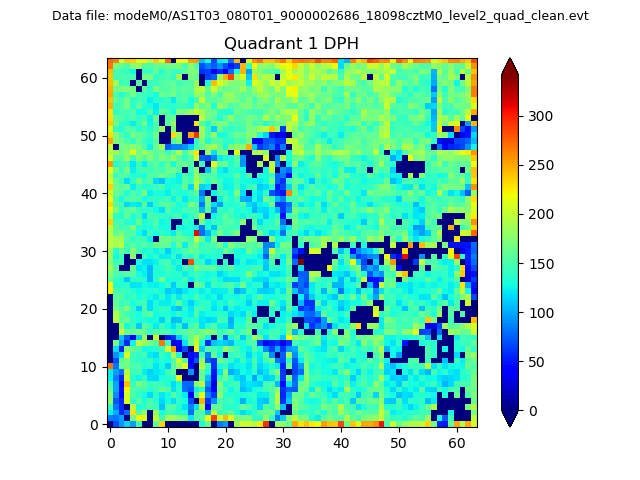 |
Quadrant B |
|---|---|---|---|
| Quadrant D | 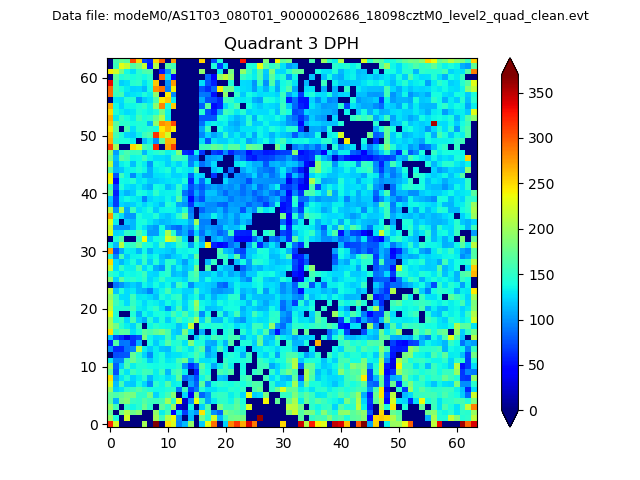 |
 |
Quadrant C |
| Plot type | Count rate plots | Images |
|---|---|---|
| Comparison with Poisson distribution Blue bars denote a histogram of data divided into 1 sec bins. Red curve is a Poisson curve with rate = median count rate of data. |
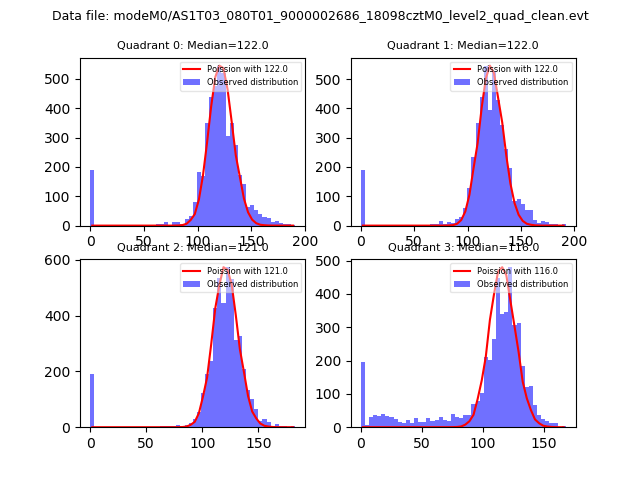 |
 |
| Quadrant-wise count rates Data is divided into 100 sec bins |
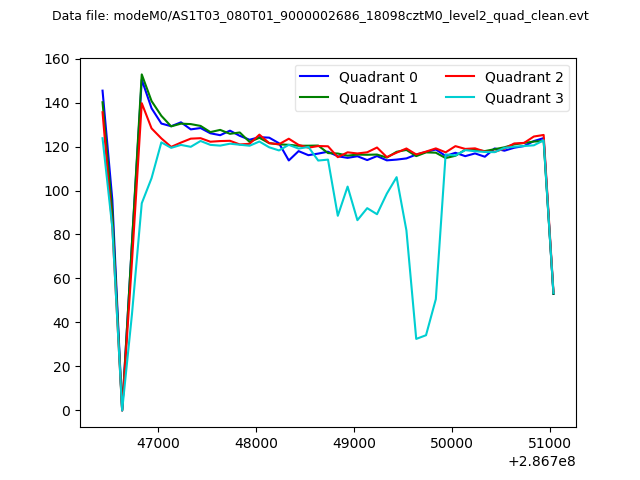 |
|
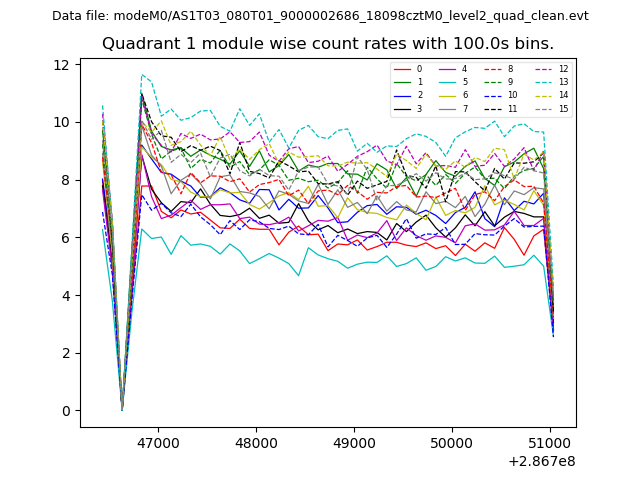
| Module-wise count rates for Quadrant A Data is divided into 100 sec bins |
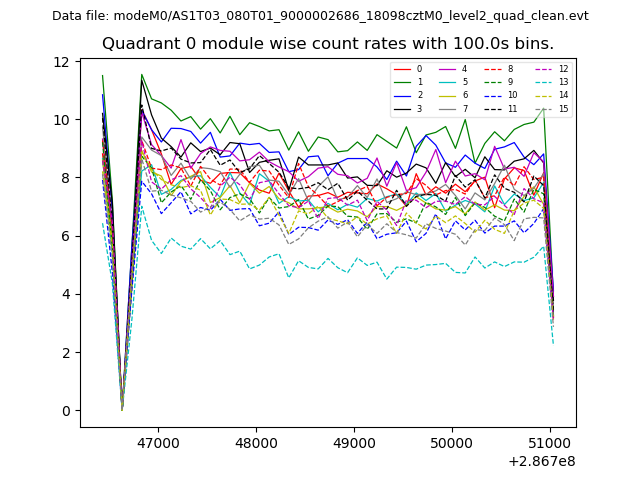 |
 |
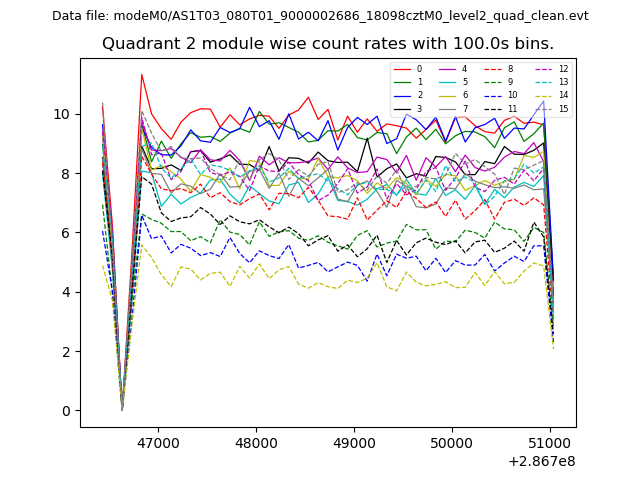
| Module-wise count rates for Quadrant B Data is divided into 100 sec bins |
 |
 |
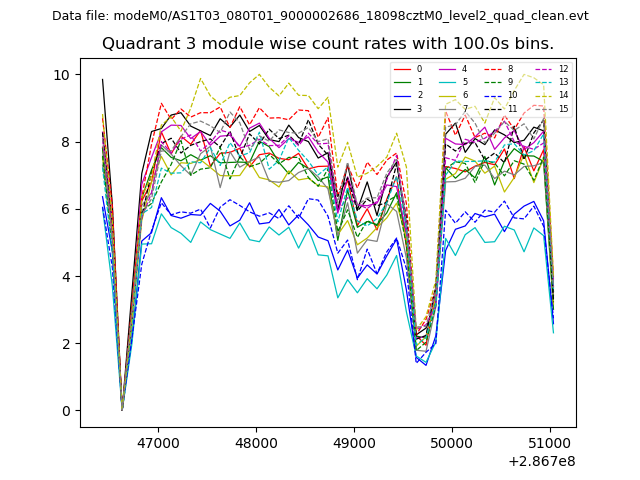
| Module-wise count rates for Quadrant C Data is divided into 100 sec bins |
 |
 |
| Module-wise count rates for Quadrant D Data is divided into 100 sec bins |
 |
 |
| Parameter | Plot |
|---|---|
| CZT HV Monitor | 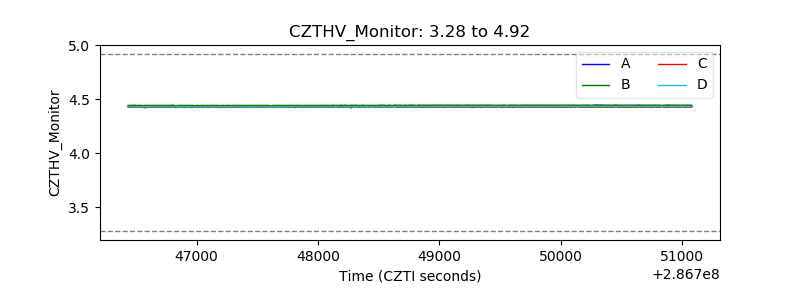 |
| D_VDD | 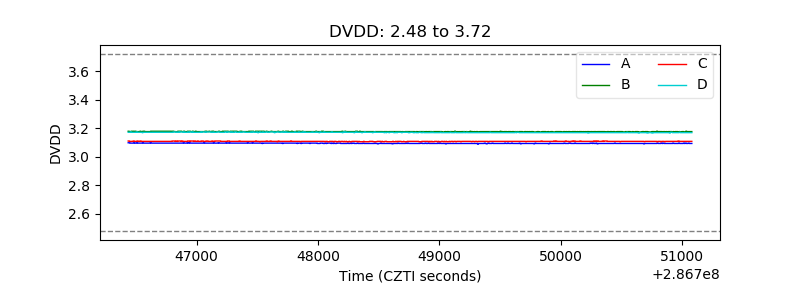 |
| Temperature 1 | 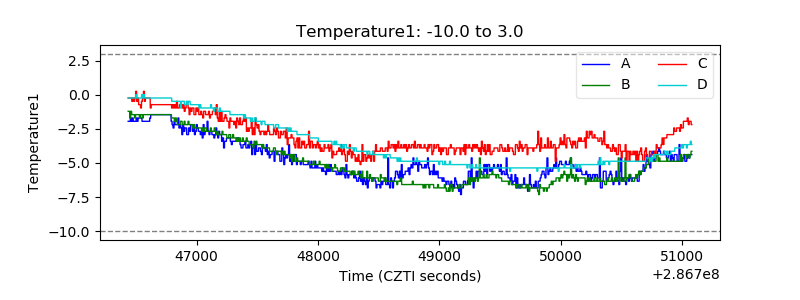 |
| Veto HV Monitor | 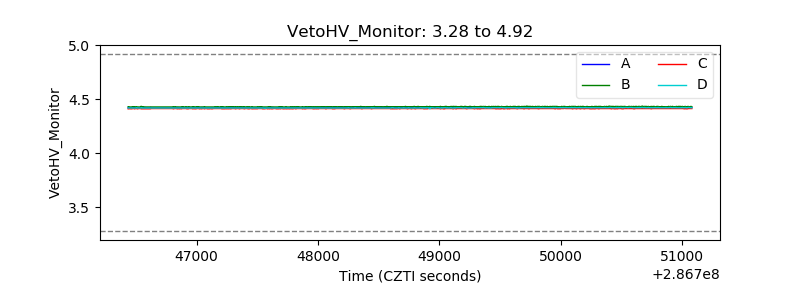 |
| Veto LLD | 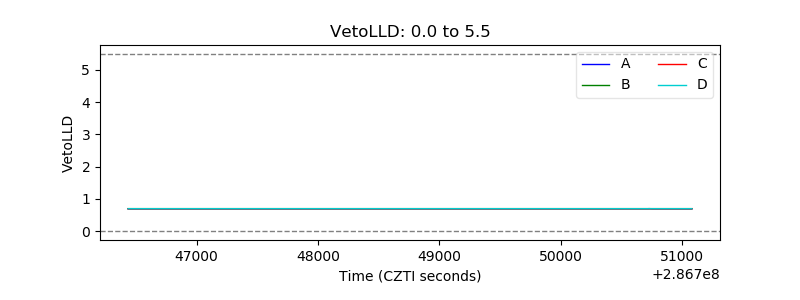 |
| Alpha Counter | 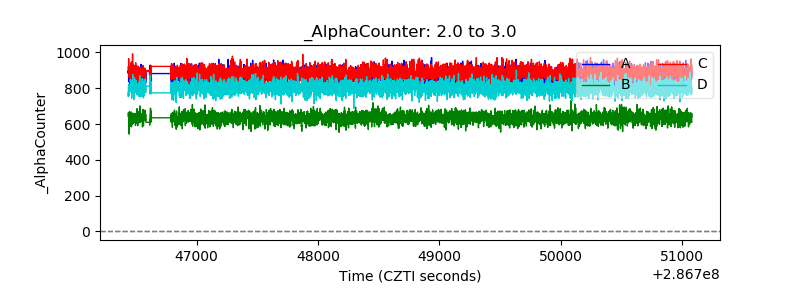 |
| _CPM_Rate | 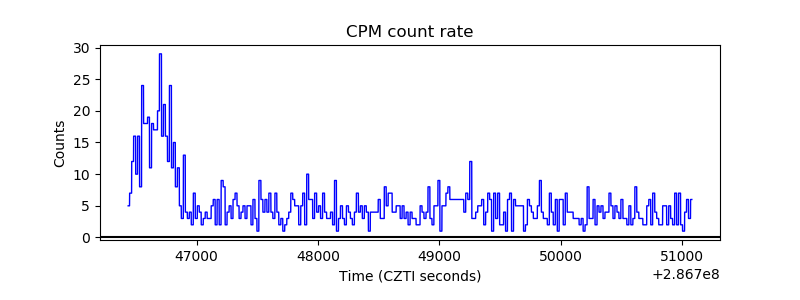 |
| CZT Counter |  |
| +2.5 Volts monitor |  |
| +5 Volts monitor |  |
| _ROLL_ROT | 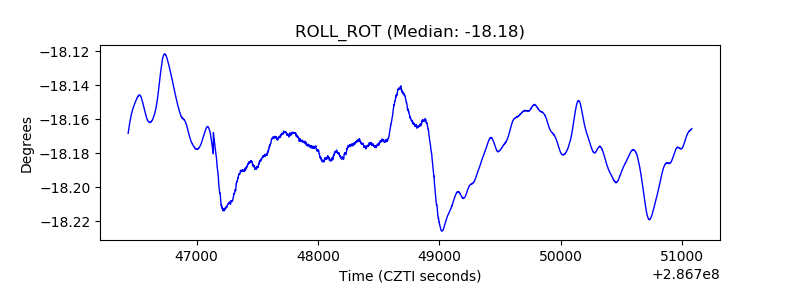 |
| _Roll_DEC |  |
| _Roll_RA | 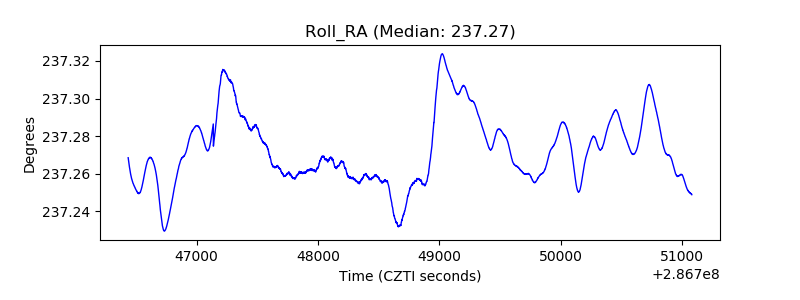 |
| Veto Counter | 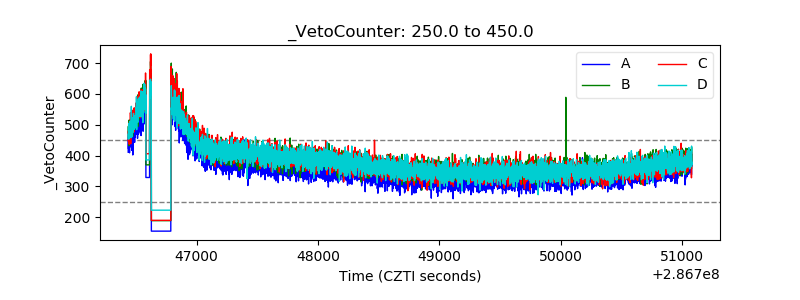 |