| Param | Original file | Final file |
|---|---|---|
| Filename | modeM0/AS1A05_097T01_9000002690cztM0_level2.fits | modeM0/AS1A05_097T01_9000002690cztM0_level2_quad_clean.evt |
| Size (bytes) | 194,353,920 | 190,998,720 |
| Size | 185.4 MB | 182.2 MB |
| Events in quadrant A | 1,204,084 | 1,129,371 |
| Events in quadrant B | 1,150,066 | 1,154,349 |
| Events in quadrant C | 1,166,240 | 1,126,369 |
| Events in quadrant D | 1,019,340 | 1,028,041 |
| Mode M0 | |||
|---|---|---|---|
| Quadrant | BADHDUFLAG | Total packets | Discarded packets |
| A | 0 | 41838 | 0 |
| B | 0 | 42336 | 0 |
| C | 0 | 41127 | 0 |
| D | 0 | 55878 | 0 |
| Mode SS | |||
|---|---|---|---|
| Quadrant | BADHDUFLAG | Total packets | Discarded packets |
| A | 0 | 400 | 0 |
| B | 0 | 400 | 0 |
| C | 0 | 400 | 0 |
| D | 0 | 400 | 0 |
| Mode M9 | |||
|---|---|---|---|
| Quadrant | BADHDUFLAG | Total packets | Discarded packets |
| A | 0 | 29 | 0 |
| B | 0 | 29 | 0 |
| C | 0 | 29 | 0 |
| D | 0 | 29 | 0 |
| Quadrant | Total seconds | Saturated seconds | Saturation percentage |
|---|---|---|---|
| A | 19536 | 388 | 1.986077% |
| B | 19536 | 451 | 2.308559% |
| C | 19536 | 479 | 2.451884% |
| D | 19536 | 948 | 4.852580% |
Noise dominated data is calculated using 1-second bins in cleaned event files. If a bin has >2000 counts, and if more than 50% of those come from <1% of pixels, then it is considered to be noise-dominated and hence unusable.
| Quadrant | # 1 sec bins | Bins with >0 counts | Bins with >2000 counts | High rate bins dominated by noise | Noise dominated (total time) | Noise dominated (detector-on time) | Marked lightcurve |
|---|---|---|---|---|---|---|---|
| A | 22516 | 19536 | 0 | 0 | 0.00% | 0.00% |  |
| B | 22516 | 19535 | 0 | 0 | 0.00% | 0.00% |  |
| C | 22516 | 19535 | 0 | 0 | 0.00% | 0.00% |  |
| D | 22516 | 19535 | 0 | 0 | 0.00% | 0.00% |  |
Top three noisy pixels from each quadrant. If the there are fewer than three noisy pixels in the level2.evt file, extra rows are filled as -1
| Pixel properties | Quadrant properties | ||||||
|---|---|---|---|---|---|---|---|
| Quadrant | DetID | PixID | Counts | Sigma | Mean | Median | Sigma |
| A | 0 | 29 | 1165 | 11.17 | 313 | 294 | 78.0 |
| A | 0 | 30 | 946 | 8.36 | 313 | 294 | 78.0 |
| A | 7 | 110 | 943 | 8.32 | 313 | 294 | 78.0 |
| B | 2 | 9 | 981 | 11.18 | 303 | 289 | 61.9 |
| B | 2 | 8 | 819 | 8.56 | 303 | 289 | 61.9 |
| B | 5 | 255 | 754 | 7.51 | 303 | 289 | 61.9 |
| C | 2 | 191 | 816 | 6.63 | 308 | 287 | 79.8 |
| C | 12 | 241 | 800 | 6.43 | 308 | 287 | 79.8 |
| C | 9 | 233 | 787 | 6.27 | 308 | 287 | 79.8 |
| D | 3 | 14 | 758 | 6.31 | 290 | 264 | 78.3 |
| D | 10 | 190 | 753 | 6.25 | 290 | 264 | 78.3 |
| D | 6 | 231 | 730 | 5.95 | 290 | 264 | 78.3 |
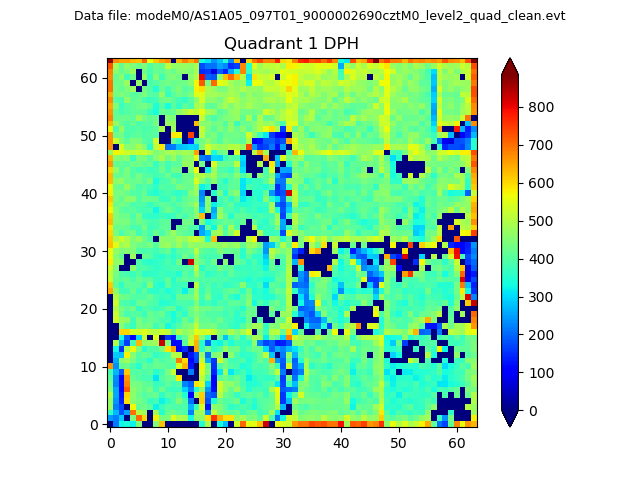
Histogram calculated using DETX and DETY for each event in the final _common_clean file
| Quadrant A |  |
 |
Quadrant B |
|---|---|---|---|
| Quadrant D | 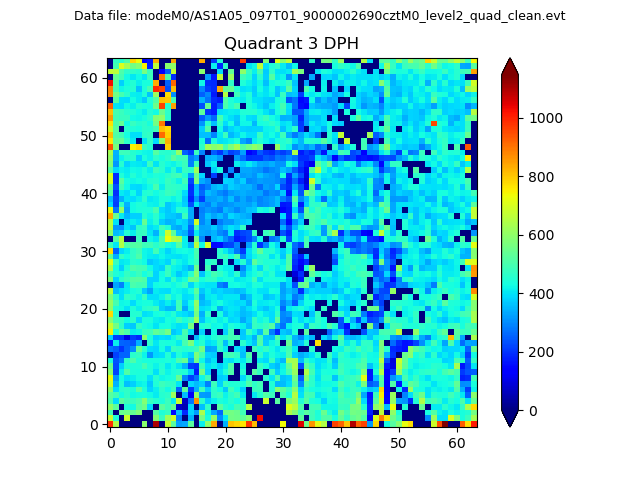 |
 |
Quadrant C |
| Plot type | Count rate plots | Images |
|---|---|---|
| Comparison with Poisson distribution Blue bars denote a histogram of data divided into 1 sec bins. Red curve is a Poisson curve with rate = median count rate of data. |
 |
 |
| Quadrant-wise count rates Data is divided into 100 sec bins |
 |
|
| Module-wise count rates for Quadrant A Data is divided into 100 sec bins |
 |
 |
| Module-wise count rates for Quadrant B Data is divided into 100 sec bins |
 |
 |
| Module-wise count rates for Quadrant C Data is divided into 100 sec bins |
 |
 |
| Module-wise count rates for Quadrant D Data is divided into 100 sec bins |
 |
 |
| Parameter | Plot |
|---|---|
| CZT HV Monitor |  |
| D_VDD |  |
| Temperature 1 | 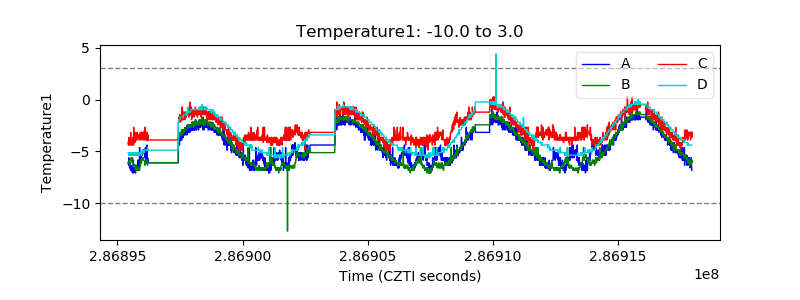 |
| Veto HV Monitor |  |
| Veto LLD |  |
| Alpha Counter |  |
| _CPM_Rate |  |
| CZT Counter |  |
| +2.5 Volts monitor |  |
| +5 Volts monitor |  |
| _ROLL_ROT |  |
| _Roll_DEC |  |
| _Roll_RA |  |
| Veto Counter |  |