| Param | Original file | Final file |
|---|---|---|
| Filename | modeM0/AS1A05_097T01_9000002690_18123cztM0_level2.evt | modeM0/AS1A05_097T01_9000002690_18123cztM0_level2_quad_clean.evt |
| Size (bytes) | 203,037,120 | 22,199,040 |
| Size | 193.6 MB | 21.2 MB |
| Events in quadrant A | 1,426,159 | 123,326 |
| Events in quadrant B | 1,408,532 | 127,894 |
| Events in quadrant C | 1,371,955 | 123,496 |
| Events in quadrant D | 1,775,983 | 122,715 |
| Mode M0 | |||
|---|---|---|---|
| Quadrant | BADHDUFLAG | Total packets | Discarded packets |
| A | 0 | 5678 | 1 |
| B | 0 | 5602 | 1 |
| C | 0 | 5453 | 1 |
| D | 0 | 6897 | 1 |
| Mode SS | |||
|---|---|---|---|
| Quadrant | BADHDUFLAG | Total packets | Discarded packets |
| A | 0 | 50 | 0 |
| B | 0 | 50 | 0 |
| C | 0 | 50 | 0 |
| D | 0 | 50 | 0 |
| Mode M9 | |||
|---|---|---|---|
| Quadrant | BADHDUFLAG | Total packets | Discarded packets |
| A | 0 | 12 | 0 |
| B | 0 | 12 | 0 |
| C | 0 | 12 | 0 |
| D | 0 | 12 | 0 |
| Quadrant | Total seconds | Saturated seconds | Saturation percentage |
|---|---|---|---|
| A | 2419 | 146 | 6.035552% |
| B | 2419 | 154 | 6.366267% |
| C | 2419 | 159 | 6.572964% |
| D | 2419 | 178 | 7.358413% |
Noise dominated data is calculated using 1-second bins in cleaned event files. If a bin has >2000 counts, and if more than 50% of those come from <1% of pixels, then it is considered to be noise-dominated and hence unusable.
| Quadrant | # 1 sec bins | Bins with >0 counts | Bins with >2000 counts | High rate bins dominated by noise | Noise dominated (total time) | Noise dominated (detector-on time) | Marked lightcurve |
|---|---|---|---|---|---|---|---|
| A | 3609 | 2420 | 3 | 3 | 0.08% | 0.12% | 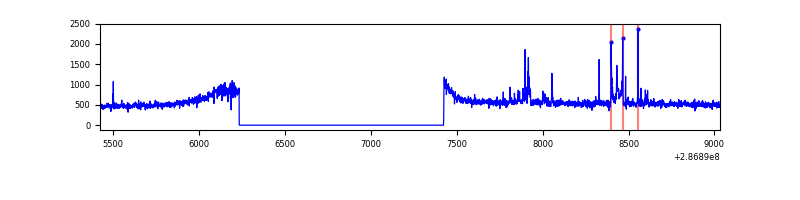 |
| B | 3609 | 2419 | 3 | 3 | 0.08% | 0.12% | 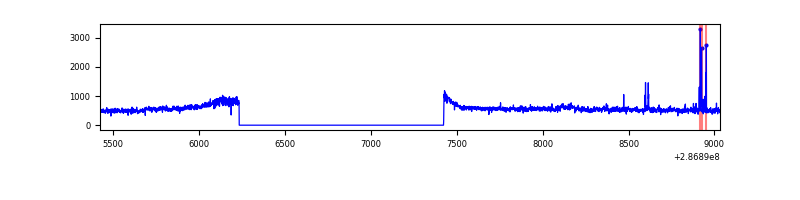 |
| C | 3609 | 2419 | 0 | 0 | 0.00% | 0.00% | 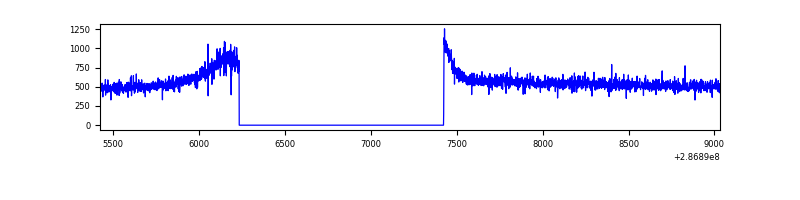 |
| D | 3609 | 2419 | 47 | 47 | 1.30% | 1.94% | 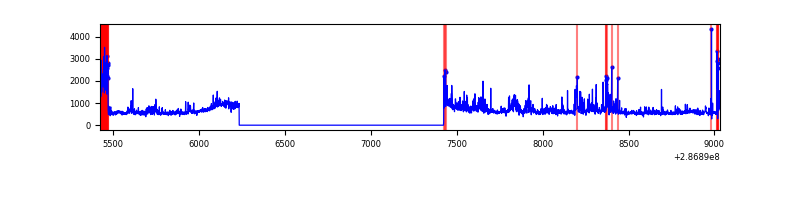 |
Top three noisy pixels from each quadrant. If the there are fewer than three noisy pixels in the level2.evt file, extra rows are filled as -1
| Pixel properties | Quadrant properties | ||||||
|---|---|---|---|---|---|---|---|
| Quadrant | DetID | PixID | Counts | Sigma | Mean | Median | Sigma |
| A | 4 | 2 | 43462 | 594.33 | 352 | 344 | 72.5 |
| A | 15 | 174 | 28387 | 386.54 | 352 | 344 | 72.5 |
| A | 0 | 226 | 3116 | 38.21 | 352 | 344 | 72.5 |
| B | 7 | 220 | 25729 | 365.75 | 348 | 339 | 69.4 |
| B | 0 | 189 | 13730 | 192.9 | 348 | 339 | 69.4 |
| B | 0 | 219 | 8972 | 124.36 | 348 | 339 | 69.4 |
| C | 14 | 238 | 51695 | 650.1 | 335 | 337 | 79.0 |
| C | 3 | 233 | 5825 | 69.47 | 335 | 337 | 79.0 |
| C | 9 | 160 | 3262 | 37.03 | 335 | 337 | 79.0 |
| D | 7 | 238 | 276214 | 3220.18 | 345 | 335 | 85.7 |
| D | 1 | 52 | 64806 | 752.53 | 345 | 335 | 85.7 |
| D | 11 | 176 | 55647 | 645.63 | 345 | 335 | 85.7 |
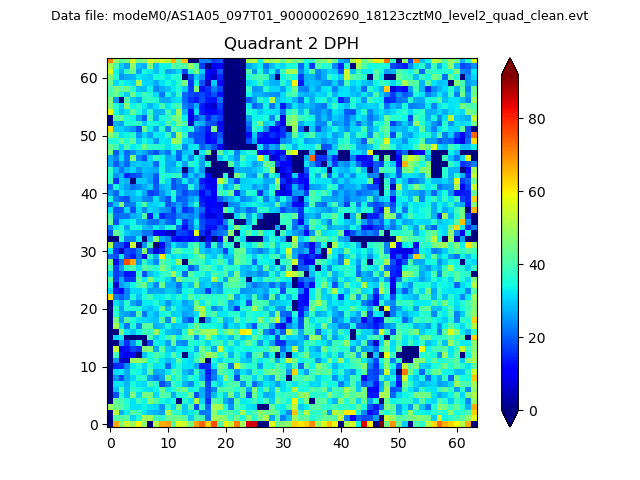
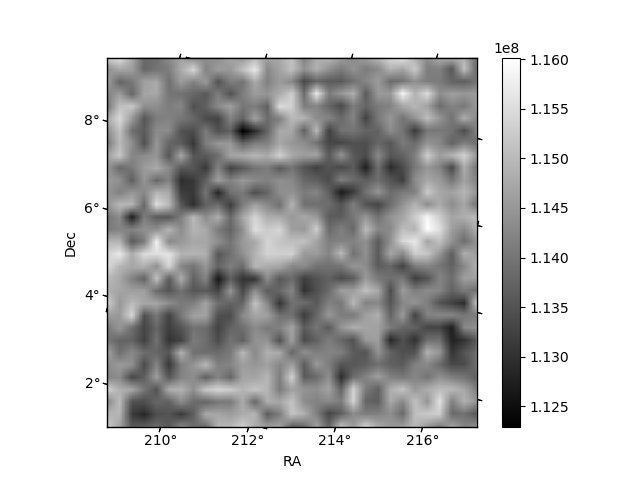
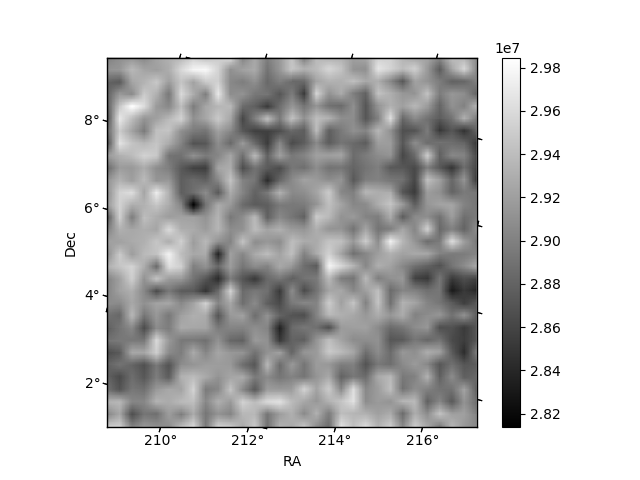
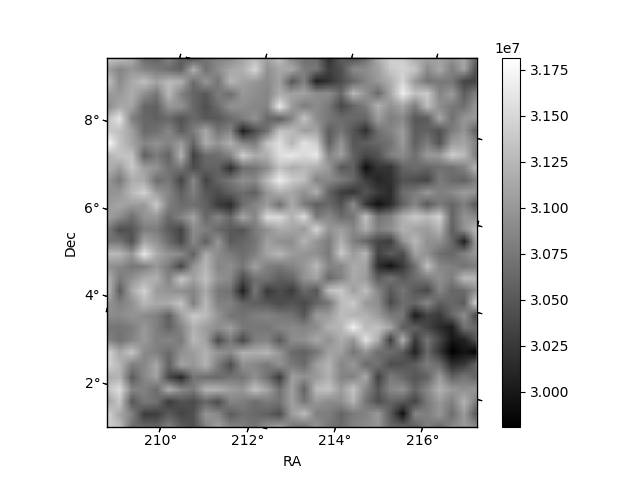
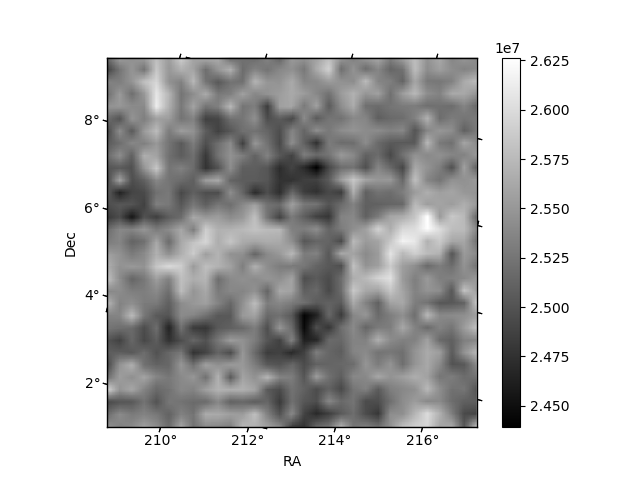
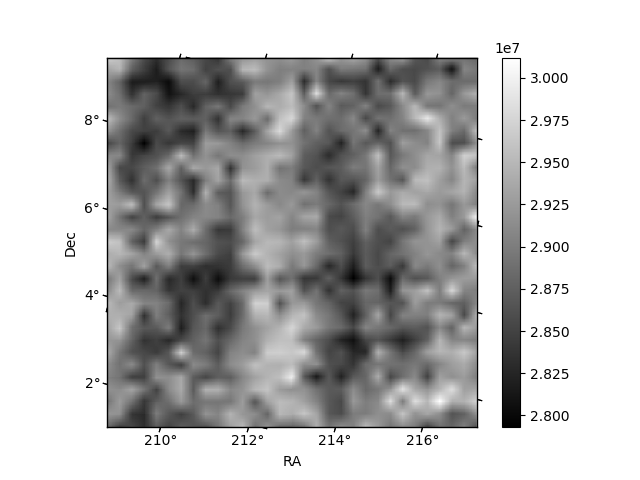
Histogram calculated using DETX and DETY for each event in the final _common_clean file
| Quadrant A | 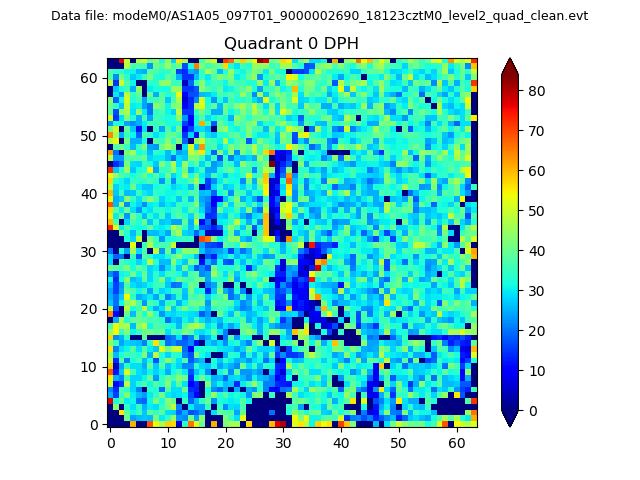 |
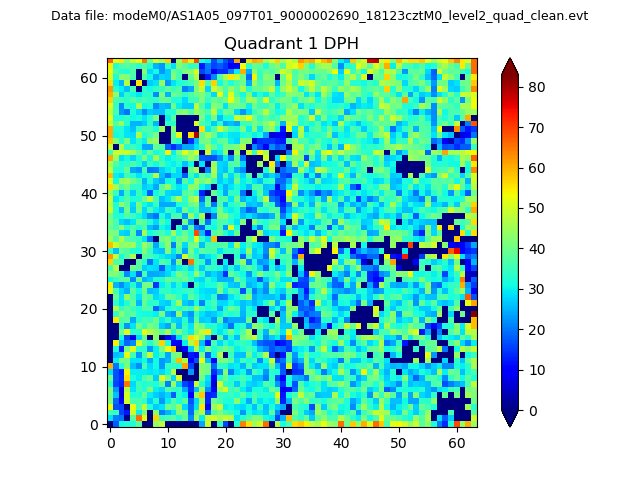 |
Quadrant B |
|---|---|---|---|
| Quadrant D | 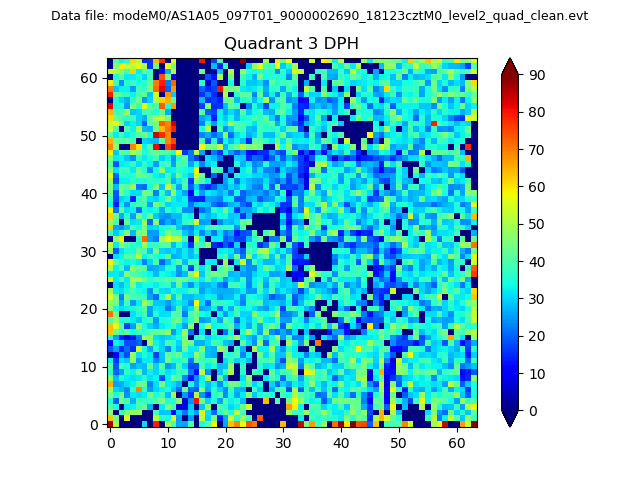 |
 |
Quadrant C |
| Plot type | Count rate plots | Images |
|---|---|---|
| Comparison with Poisson distribution Blue bars denote a histogram of data divided into 1 sec bins. Red curve is a Poisson curve with rate = median count rate of data. |
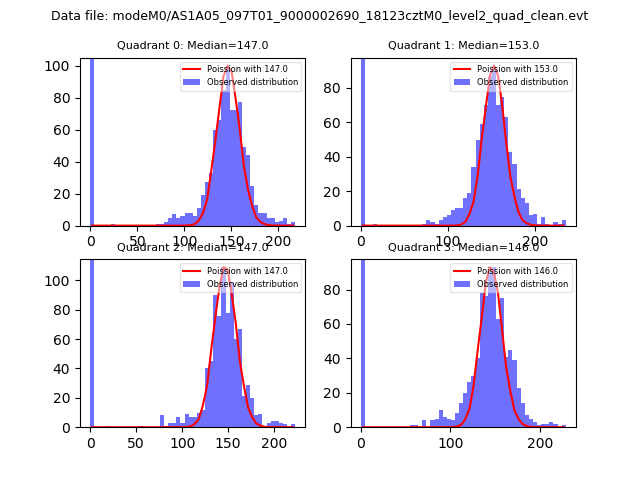 |
 |
| Quadrant-wise count rates Data is divided into 100 sec bins |
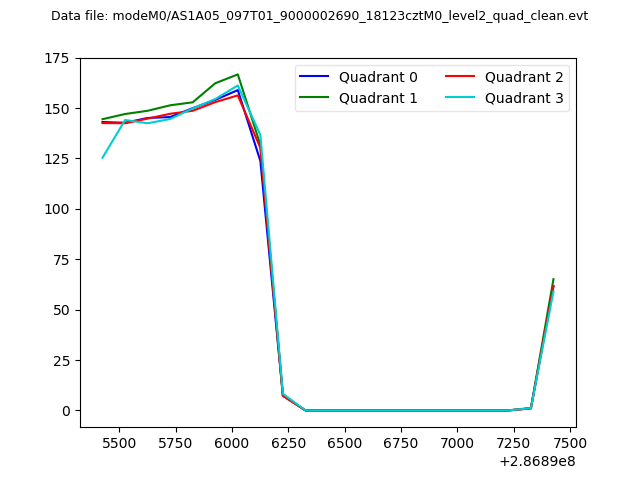 |
|
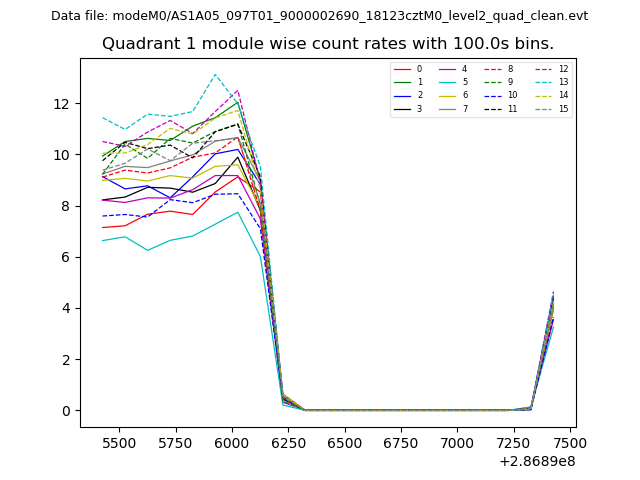
| Module-wise count rates for Quadrant A Data is divided into 100 sec bins |
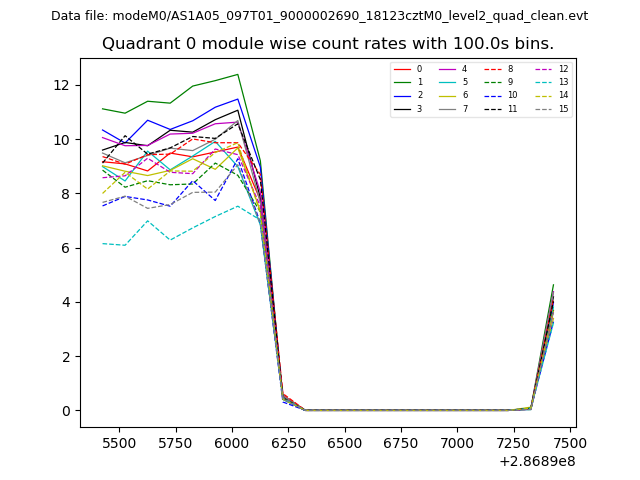 |
 |
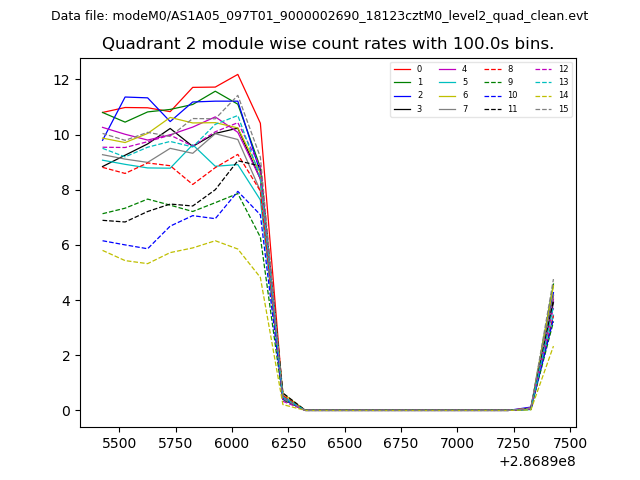
| Module-wise count rates for Quadrant B Data is divided into 100 sec bins |
 |
 |
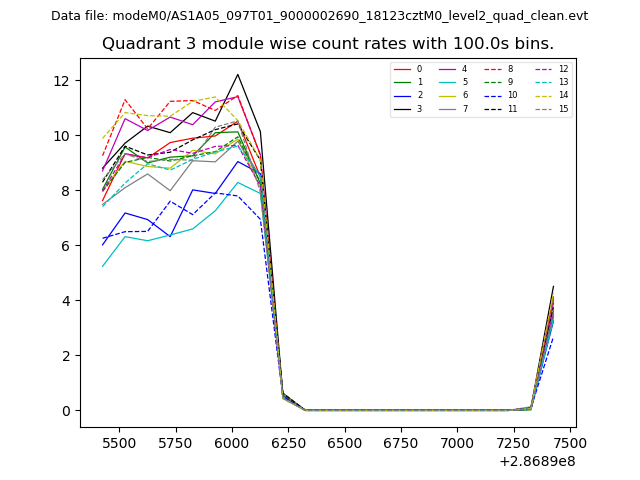
| Module-wise count rates for Quadrant C Data is divided into 100 sec bins |
 |
 |
| Module-wise count rates for Quadrant D Data is divided into 100 sec bins |
 |
 |
| Parameter | Plot |
|---|---|
| CZT HV Monitor | 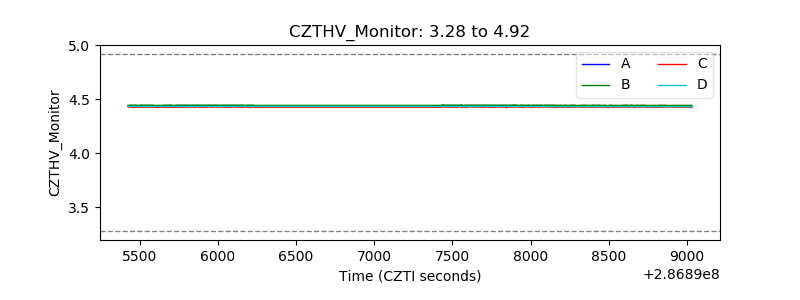 |
| D_VDD | 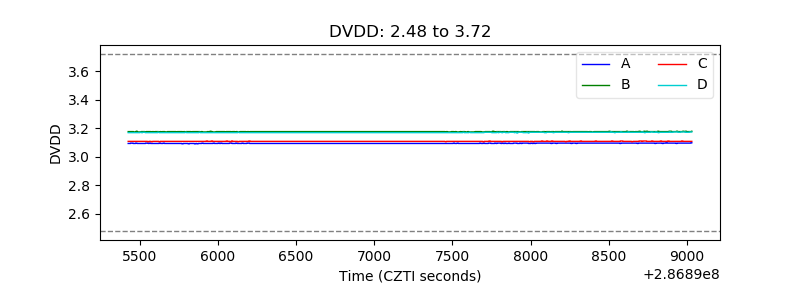 |
| Temperature 1 | 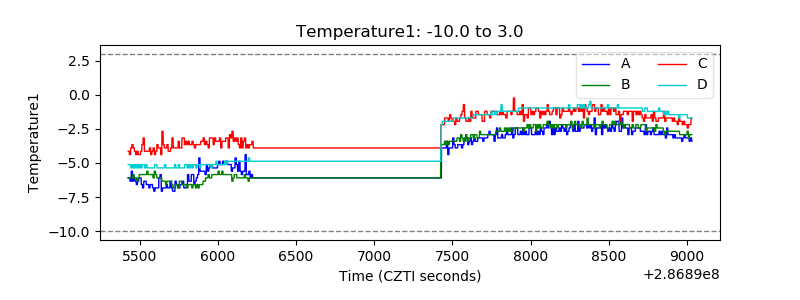 |
| Veto HV Monitor | 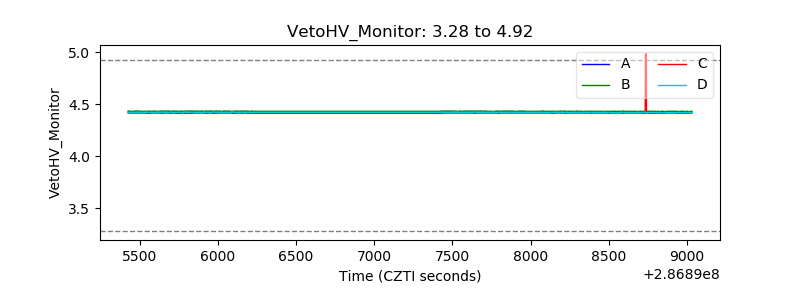 |
| Veto LLD | 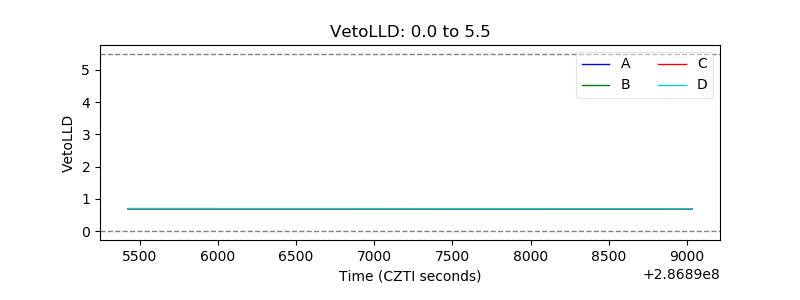 |
| Alpha Counter | 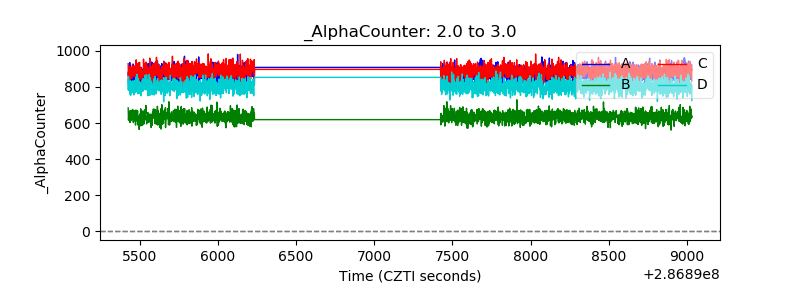 |
| _CPM_Rate | 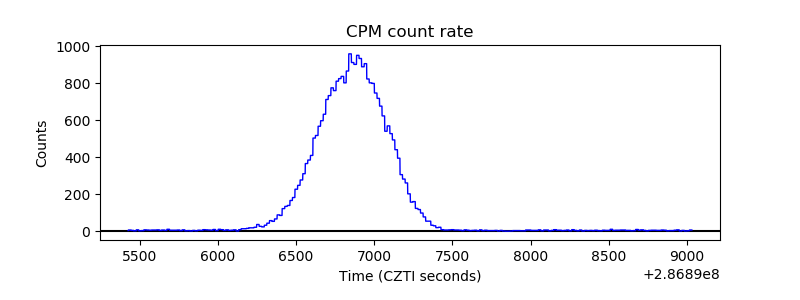 |
| CZT Counter | 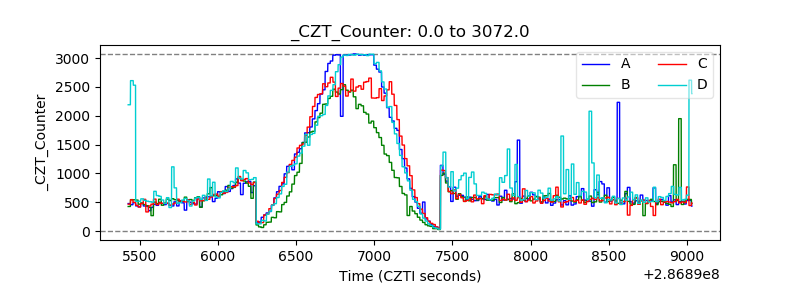 |
| +2.5 Volts monitor | 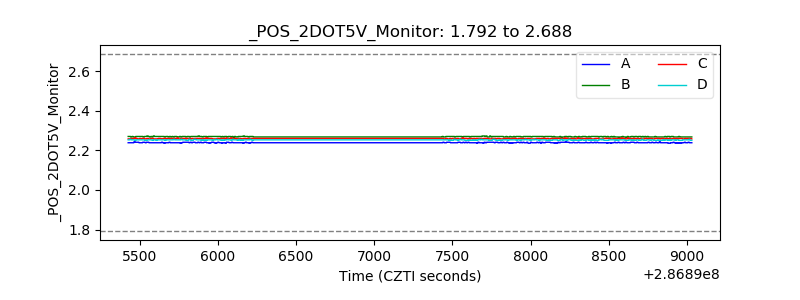 |
| +5 Volts monitor |  |
| _ROLL_ROT | 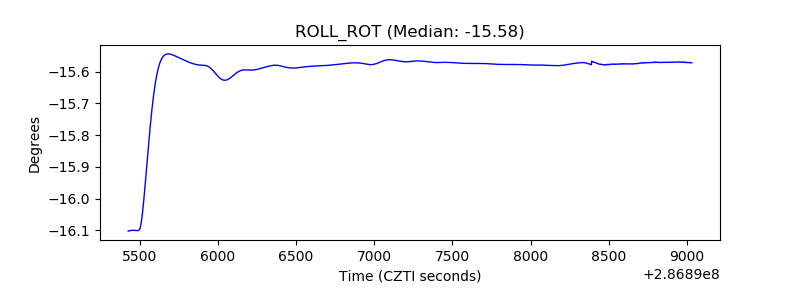 |
| _Roll_DEC | 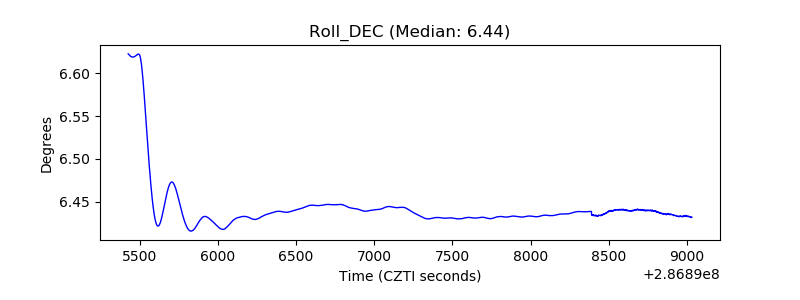 |
| _Roll_RA | 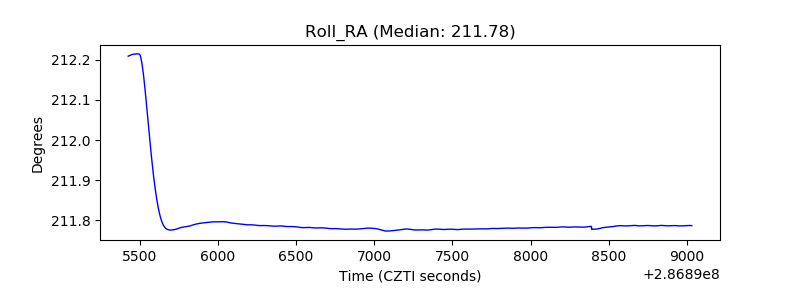 |
| Veto Counter | 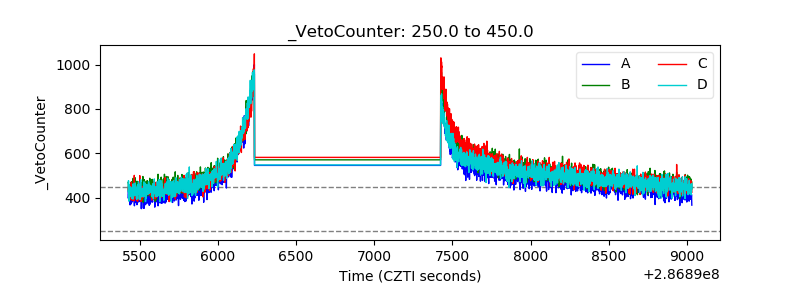 |