| Param | Original file | Final file |
|---|---|---|
| Filename | modeM0/AS1A05_097T01_9000002690_18124cztM0_level2.evt | modeM0/AS1A05_097T01_9000002690_18124cztM0_level2_quad_clean.evt |
| Size (bytes) | 519,166,080 | 70,439,040 |
| Size | 495.1 MB | 67.2 MB |
| Events in quadrant A | 3,567,570 | 411,877 |
| Events in quadrant B | 3,576,942 | 423,173 |
| Events in quadrant C | 3,504,736 | 412,534 |
| Events in quadrant D | 4,613,278 | 412,056 |
| Mode M0 | |||
|---|---|---|---|
| Quadrant | BADHDUFLAG | Total packets | Discarded packets |
| A | 0 | 14697 | 2 |
| B | 0 | 14637 | 6 |
| C | 0 | 14333 | 2 |
| D | 0 | 18287 | 2 |
| Mode SS | |||
|---|---|---|---|
| Quadrant | BADHDUFLAG | Total packets | Discarded packets |
| A | 0 | 140 | 0 |
| B | 0 | 140 | 0 |
| C | 0 | 140 | 0 |
| D | 0 | 140 | 0 |
| Mode M9 | |||
|---|---|---|---|
| Quadrant | BADHDUFLAG | Total packets | Discarded packets |
| A | 0 | 9 | 0 |
| B | 0 | 9 | 0 |
| C | 0 | 9 | 0 |
| D | 0 | 9 | 0 |
| Quadrant | Total seconds | Saturated seconds | Saturation percentage |
|---|---|---|---|
| A | 6781 | 100 | 1.474709% |
| B | 6781 | 107 | 1.577938% |
| C | 6781 | 116 | 1.710662% |
| D | 6781 | 177 | 2.610234% |
Noise dominated data is calculated using 1-second bins in cleaned event files. If a bin has >2000 counts, and if more than 50% of those come from <1% of pixels, then it is considered to be noise-dominated and hence unusable.
| Quadrant | # 1 sec bins | Bins with >0 counts | Bins with >2000 counts | High rate bins dominated by noise | Noise dominated (total time) | Noise dominated (detector-on time) | Marked lightcurve |
|---|---|---|---|---|---|---|---|
| A | 7771 | 6782 | 4 | 4 | 0.05% | 0.06% | 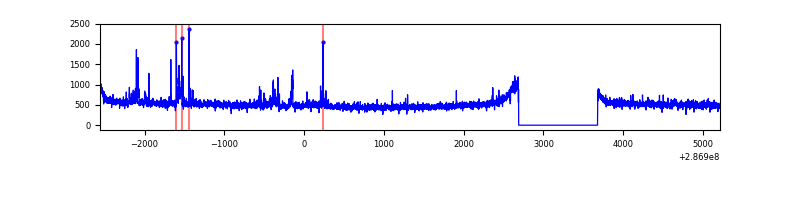 |
| B | 7771 | 6782 | 3 | 3 | 0.04% | 0.04% | 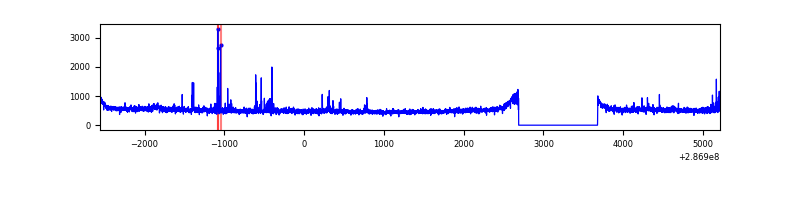 |
| C | 7771 | 6782 | 0 | 0 | 0.00% | 0.00% | 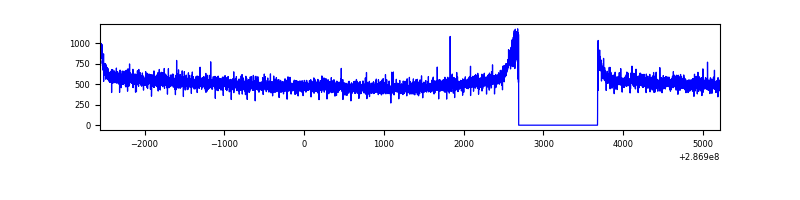 |
| D | 7771 | 6782 | 69 | 69 | 0.89% | 1.02% | 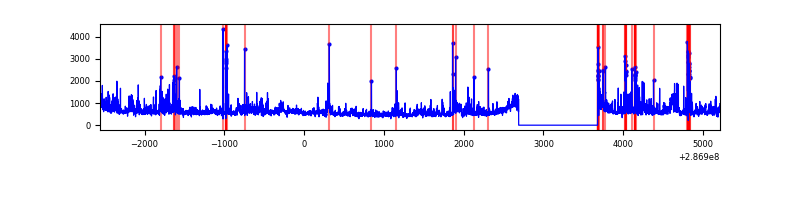 |
Top three noisy pixels from each quadrant. If the there are fewer than three noisy pixels in the level2.evt file, extra rows are filled as -1
| Pixel properties | Quadrant properties | ||||||
|---|---|---|---|---|---|---|---|
| Quadrant | DetID | PixID | Counts | Sigma | Mean | Median | Sigma |
| A | 4 | 2 | 94288 | 519.34 | 892 | 874 | 179.9 |
| A | 15 | 174 | 45597 | 248.64 | 892 | 874 | 179.9 |
| A | 0 | 226 | 7748 | 38.22 | 892 | 874 | 179.9 |
| B | 0 | 197 | 35457 | 202.12 | 887 | 864 | 171.1 |
| B | 7 | 220 | 30391 | 172.52 | 887 | 864 | 171.1 |
| B | 0 | 189 | 21294 | 119.37 | 887 | 864 | 171.1 |
| C | 14 | 238 | 133736 | 670.16 | 855 | 865 | 198.3 |
| C | 3 | 233 | 22142 | 107.31 | 855 | 865 | 198.3 |
| C | 5 | 218 | 7819 | 35.07 | 855 | 865 | 198.3 |
| D | 7 | 238 | 835024 | 3939.08 | 870 | 849 | 211.8 |
| D | 11 | 176 | 199726 | 939.12 | 870 | 849 | 211.8 |
| D | 1 | 52 | 125110 | 586.78 | 870 | 849 | 211.8 |
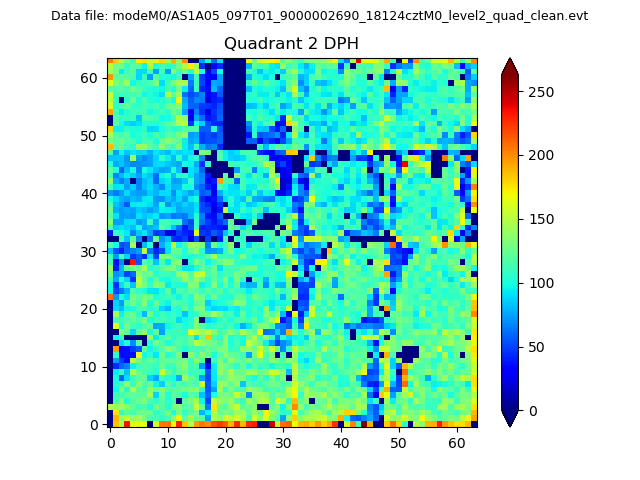
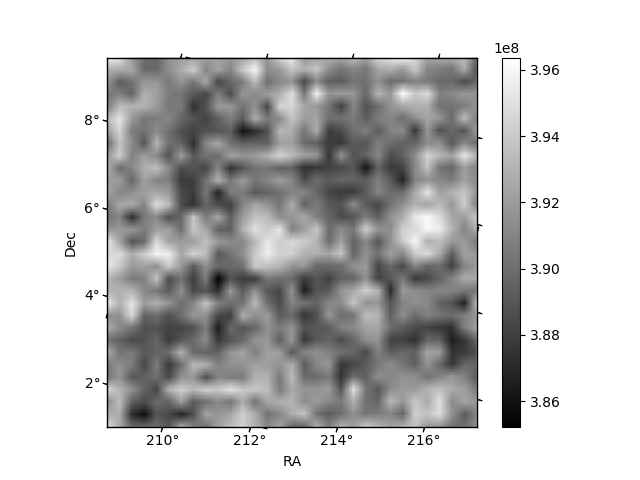
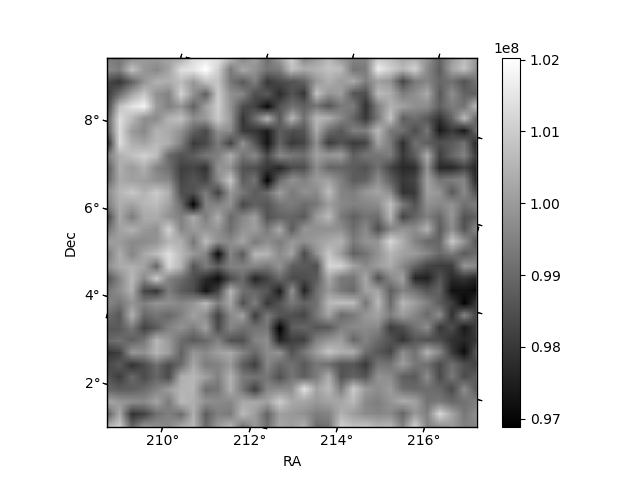
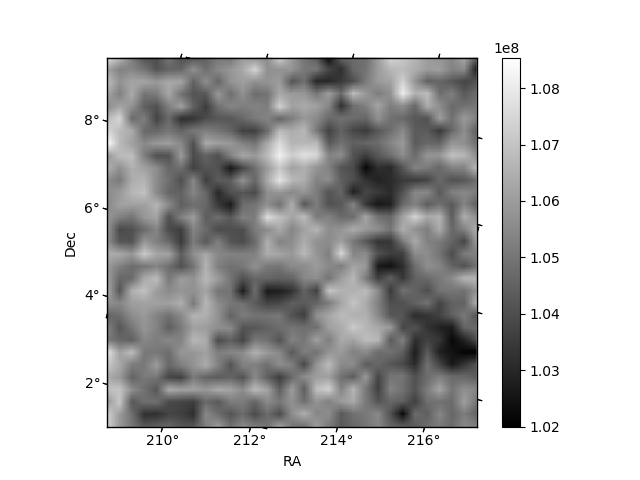
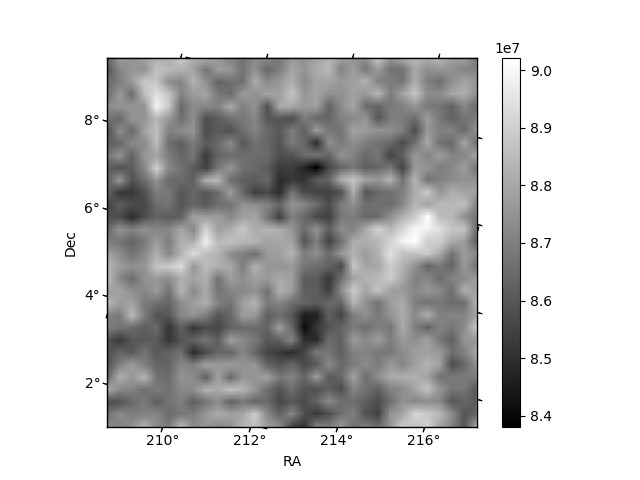
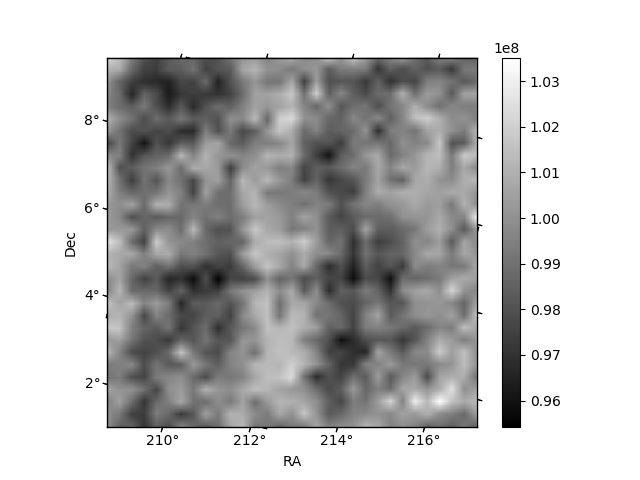
Histogram calculated using DETX and DETY for each event in the final _common_clean file
| Quadrant A | 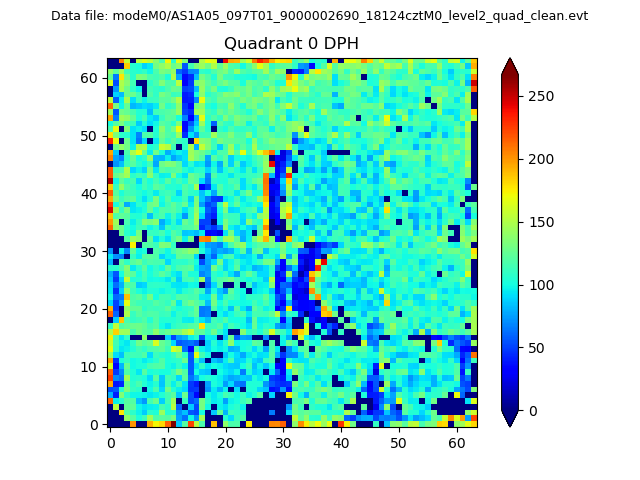 |
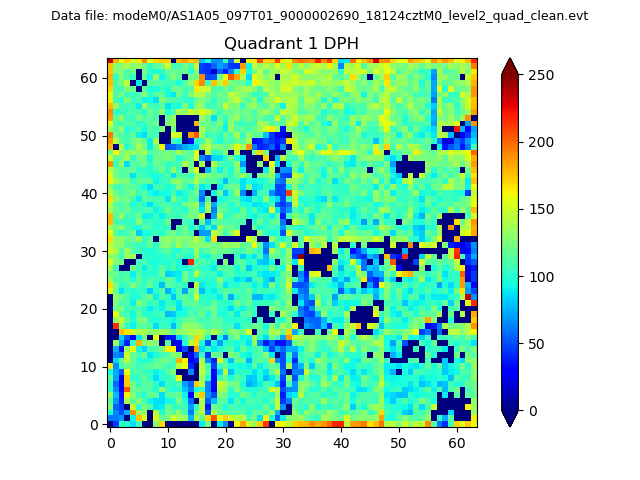 |
Quadrant B |
|---|---|---|---|
| Quadrant D | 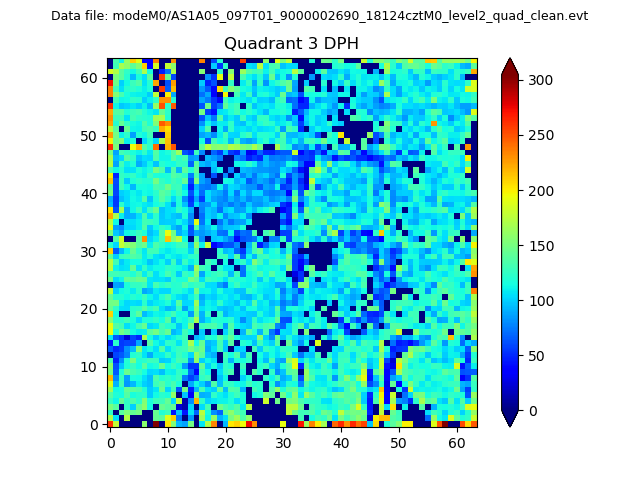 |
 |
Quadrant C |
| Plot type | Count rate plots | Images |
|---|---|---|
| Comparison with Poisson distribution Blue bars denote a histogram of data divided into 1 sec bins. Red curve is a Poisson curve with rate = median count rate of data. |
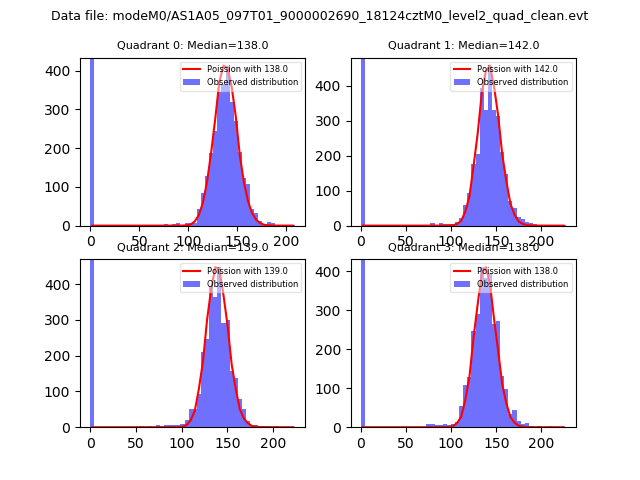 |
 |
| Quadrant-wise count rates Data is divided into 100 sec bins |
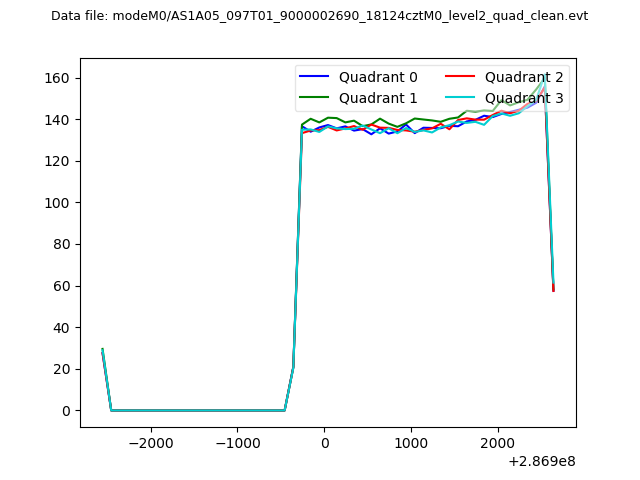 |
|
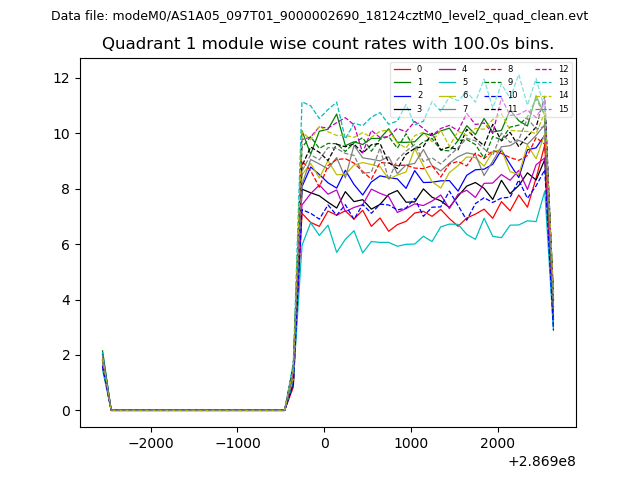
| Module-wise count rates for Quadrant A Data is divided into 100 sec bins |
 |
 |
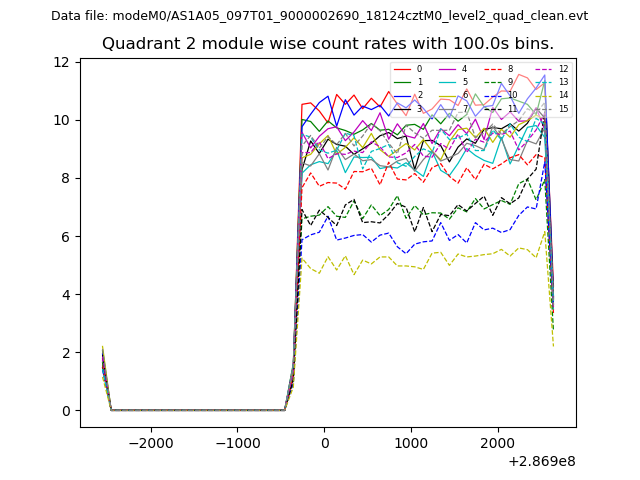
| Module-wise count rates for Quadrant B Data is divided into 100 sec bins |
 |
 |
| Module-wise count rates for Quadrant C Data is divided into 100 sec bins |
 |
 |
| Module-wise count rates for Quadrant D Data is divided into 100 sec bins |
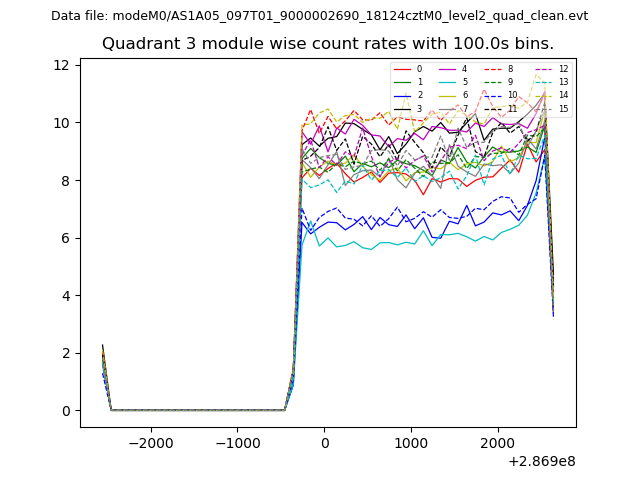 |
 |
| Parameter | Plot |
|---|---|
| CZT HV Monitor | 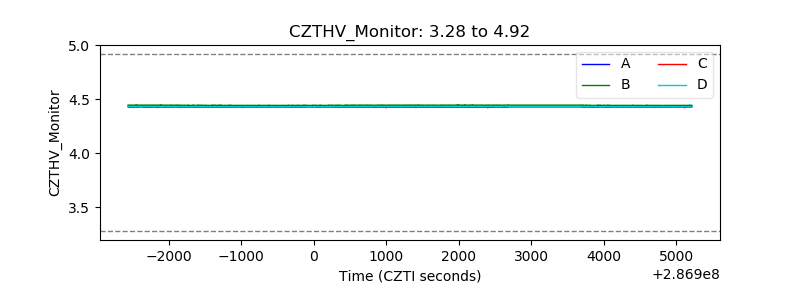 |
| D_VDD | 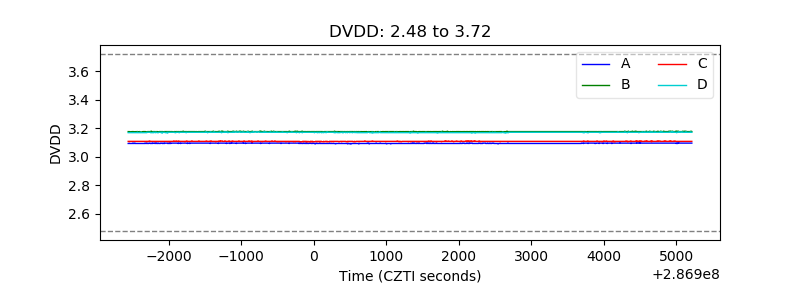 |
| Temperature 1 | 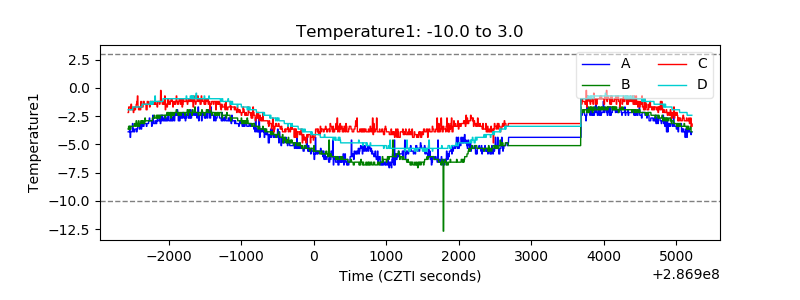 |
| Veto HV Monitor | 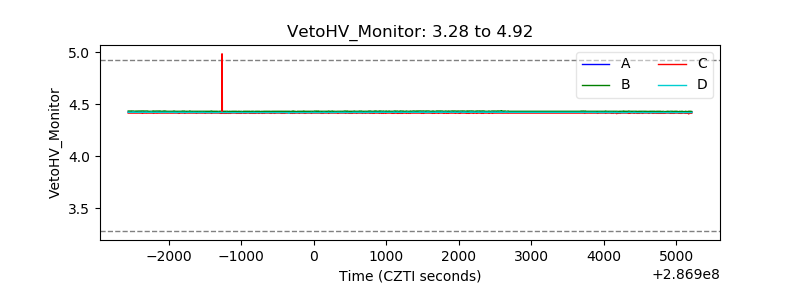 |
| Veto LLD | 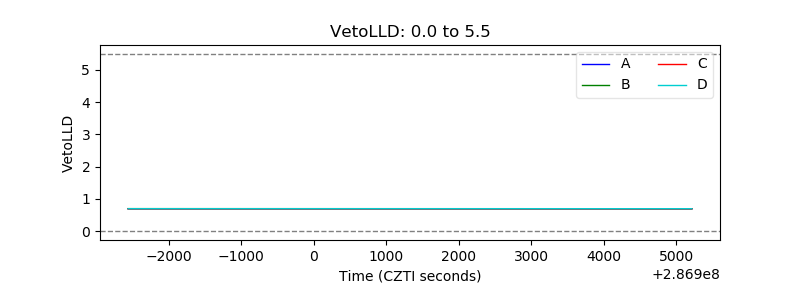 |
| Alpha Counter | 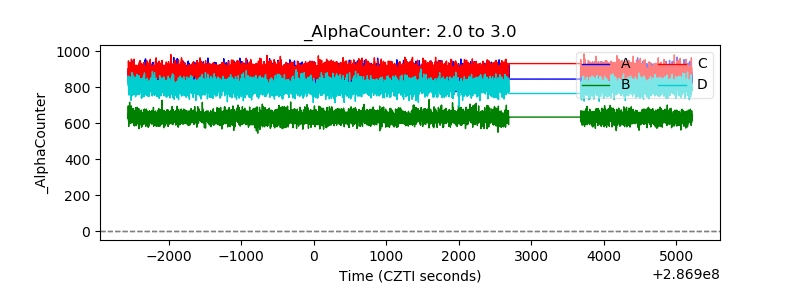 |
| _CPM_Rate | 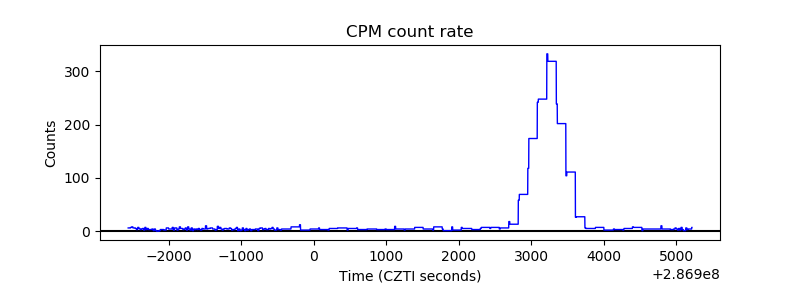 |
| CZT Counter | 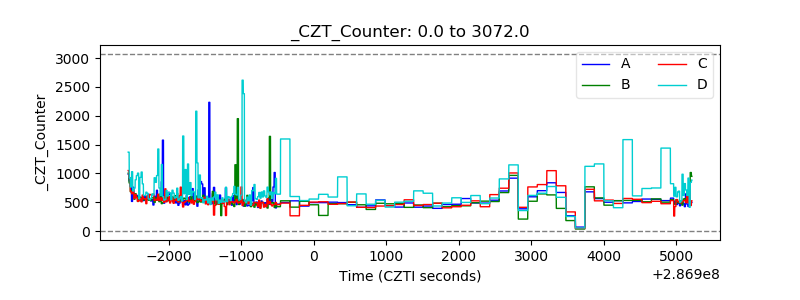 |
| +2.5 Volts monitor |  |
| +5 Volts monitor | 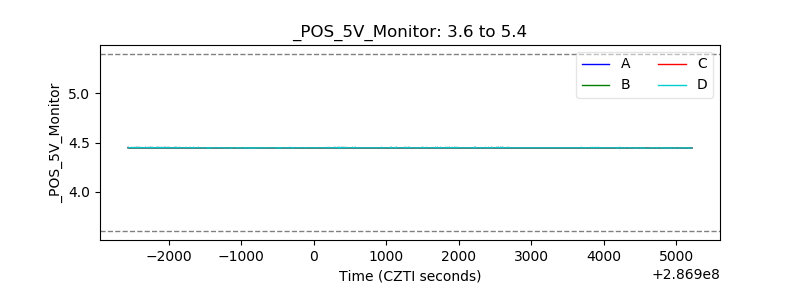 |
| _ROLL_ROT | 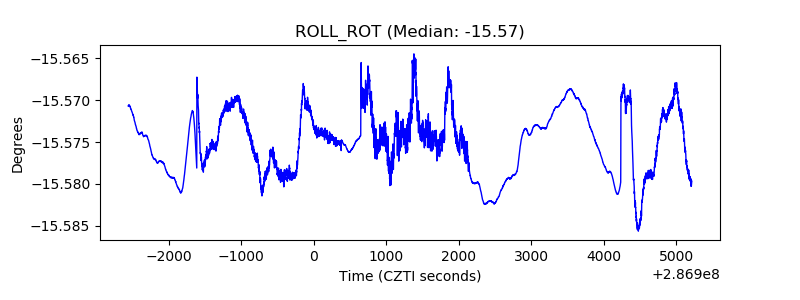 |
| _Roll_DEC | 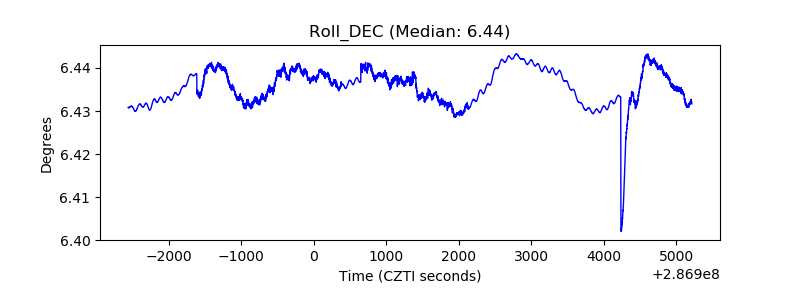 |
| _Roll_RA | 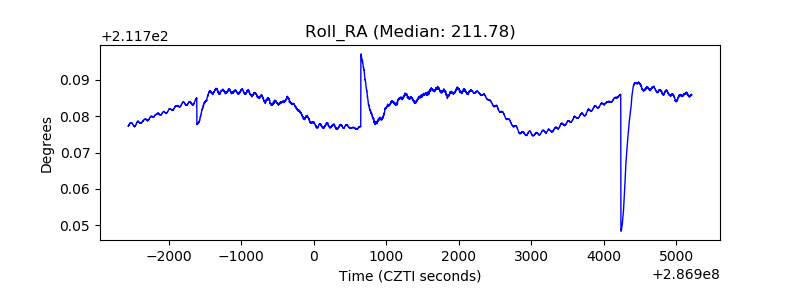 |
| Veto Counter | 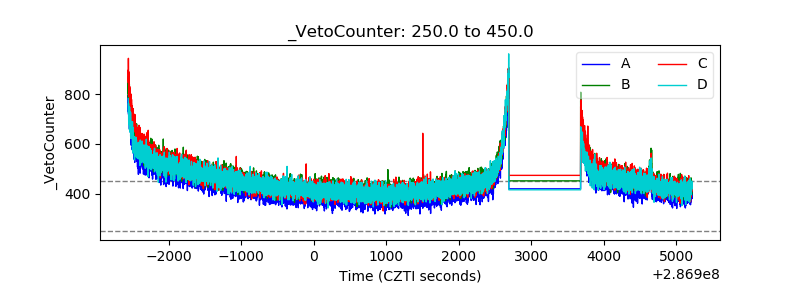 |