| Param | Original file | Final file |
|---|---|---|
| Filename | modeM0/AS1A05_097T01_9000002690_18126cztM0_level2.evt | modeM0/AS1A05_097T01_9000002690_18126cztM0_level2_quad_clean.evt |
| Size (bytes) | 647,815,680 | 92,347,200 |
| Size | 617.8 MB | 88.1 MB |
| Events in quadrant A | 4,050,762 | 555,797 |
| Events in quadrant B | 4,228,684 | 572,270 |
| Events in quadrant C | 4,066,766 | 565,142 |
| Events in quadrant D | 6,725,047 | 540,951 |
| Mode M0 | |||
|---|---|---|---|
| Quadrant | BADHDUFLAG | Total packets | Discarded packets |
| A | 0 | 17179 | 2 |
| B | 0 | 17661 | 2 |
| C | 0 | 17043 | 2 |
| D | 0 | 25702 | 2 |
| Mode SS | |||
|---|---|---|---|
| Quadrant | BADHDUFLAG | Total packets | Discarded packets |
| A | 0 | 166 | 0 |
| B | 0 | 166 | 0 |
| C | 0 | 166 | 0 |
| D | 0 | 166 | 0 |
| Mode M9 | |||
|---|---|---|---|
| Quadrant | BADHDUFLAG | Total packets | Discarded packets |
| A | 0 | 8 | 0 |
| B | 0 | 8 | 0 |
| C | 0 | 8 | 0 |
| D | 0 | 8 | 0 |
| Quadrant | Total seconds | Saturated seconds | Saturation percentage |
|---|---|---|---|
| A | 8088 | 148 | 1.829871% |
| B | 8089 | 179 | 2.212882% |
| C | 8089 | 213 | 2.633206% |
| D | 8089 | 590 | 7.293856% |
Noise dominated data is calculated using 1-second bins in cleaned event files. If a bin has >2000 counts, and if more than 50% of those come from <1% of pixels, then it is considered to be noise-dominated and hence unusable.
| Quadrant | # 1 sec bins | Bins with >0 counts | Bins with >2000 counts | High rate bins dominated by noise | Noise dominated (total time) | Noise dominated (detector-on time) | Marked lightcurve |
|---|---|---|---|---|---|---|---|
| A | 8888 | 8091 | 4 | 4 | 0.05% | 0.05% | 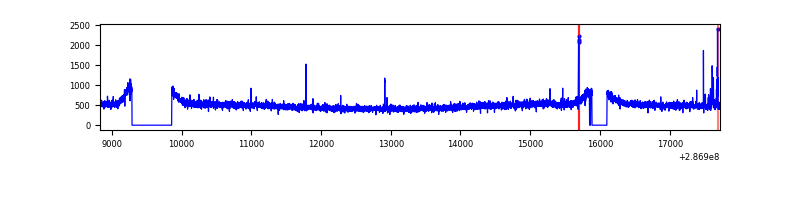 |
| B | 8889 | 8092 | 7 | 7 | 0.08% | 0.09% | 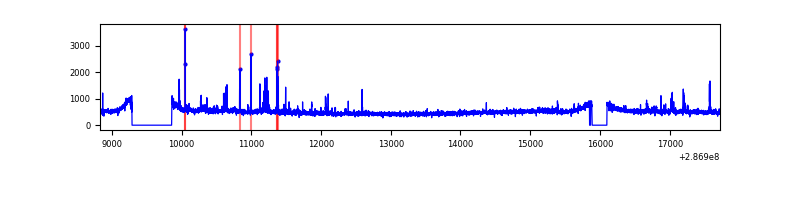 |
| C | 8889 | 8092 | 0 | 0 | 0.00% | 0.00% | 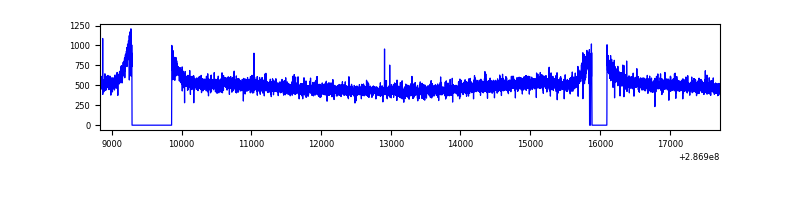 |
| D | 8889 | 8092 | 314 | 314 | 3.53% | 3.88% | 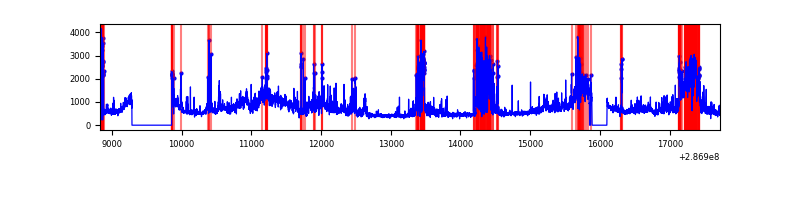 |
Top three noisy pixels from each quadrant. If the there are fewer than three noisy pixels in the level2.evt file, extra rows are filled as -1
| Pixel properties | Quadrant properties | ||||||
|---|---|---|---|---|---|---|---|
| Quadrant | DetID | PixID | Counts | Sigma | Mean | Median | Sigma |
| A | 15 | 174 | 71815 | 336.09 | 1034 | 1012 | 210.7 |
| A | 0 | 226 | 9221 | 38.97 | 1034 | 1012 | 210.7 |
| A | 3 | 137 | 7755 | 32.01 | 1034 | 1012 | 210.7 |
| B | 0 | 197 | 66400 | 329.33 | 1031 | 1005 | 198.6 |
| B | 3 | 64 | 31175 | 151.94 | 1031 | 1005 | 198.6 |
| B | 5 | 172 | 27195 | 131.89 | 1031 | 1005 | 198.6 |
| C | 14 | 238 | 154365 | 654.66 | 993 | 998 | 234.3 |
| C | 3 | 233 | 18732 | 75.7 | 993 | 998 | 234.3 |
| C | 5 | 218 | 7669 | 28.47 | 993 | 998 | 234.3 |
| D | 7 | 238 | 1992158 | 8220.68 | 996 | 966 | 242.2 |
| D | 10 | 70 | 500857 | 2063.81 | 996 | 966 | 242.2 |
| D | 7 | 38 | 177862 | 730.32 | 996 | 966 | 242.2 |
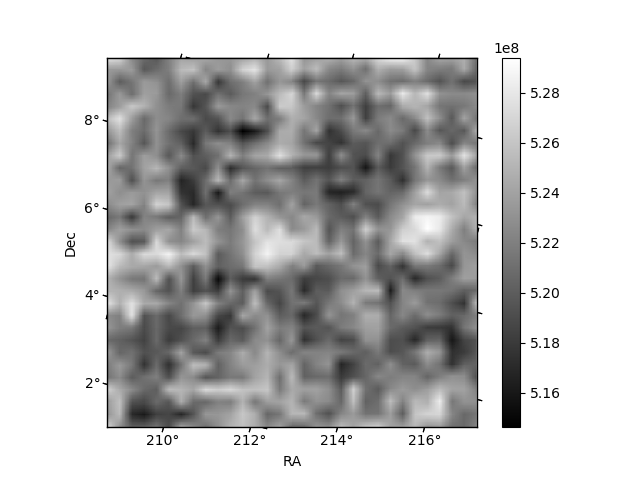
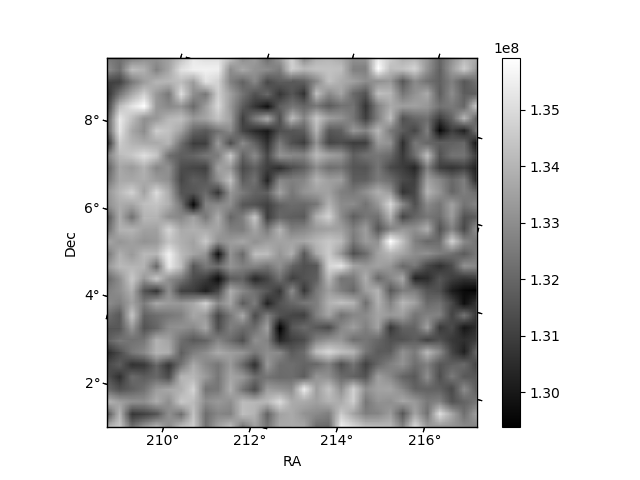
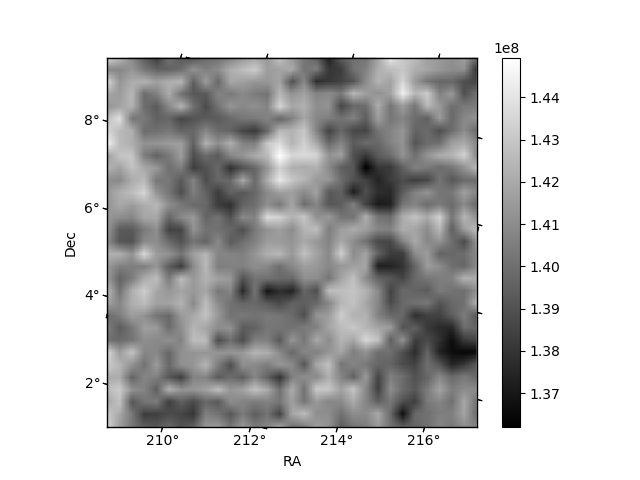
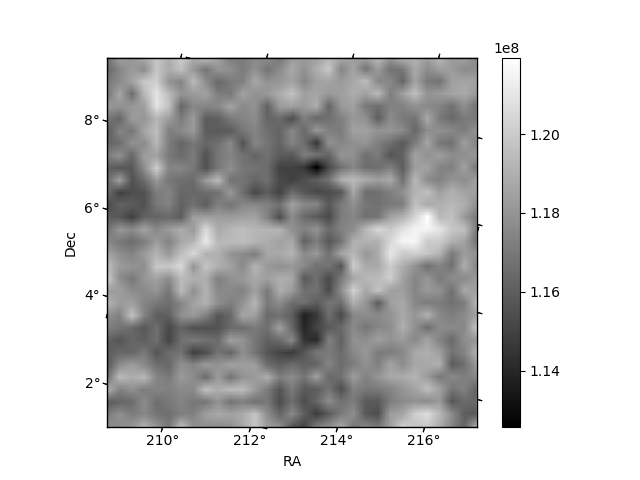
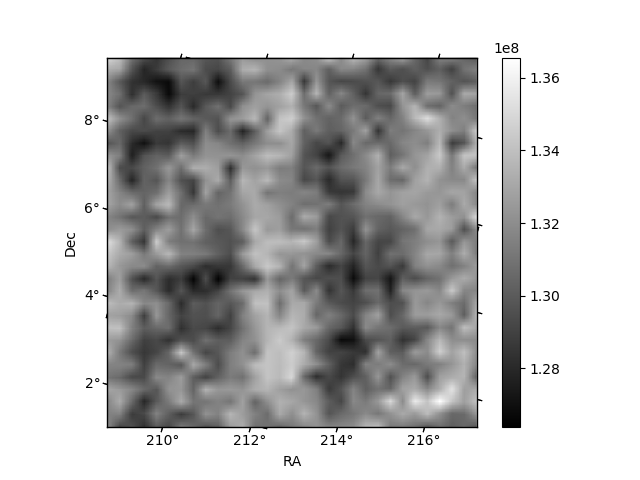
Histogram calculated using DETX and DETY for each event in the final _common_clean file
| Quadrant A | 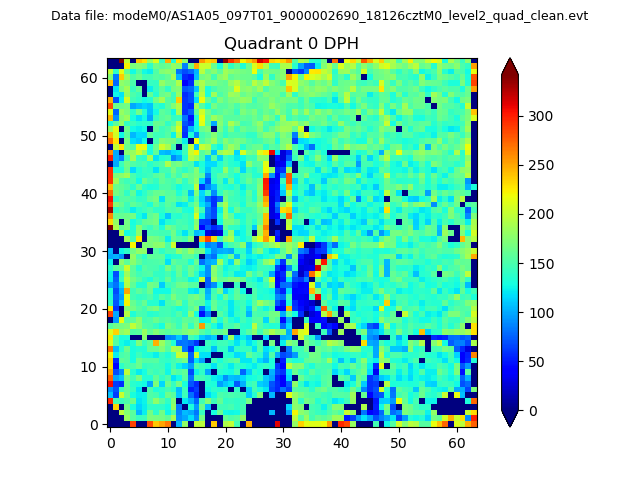 |
 |
Quadrant B |
|---|---|---|---|
| Quadrant D | 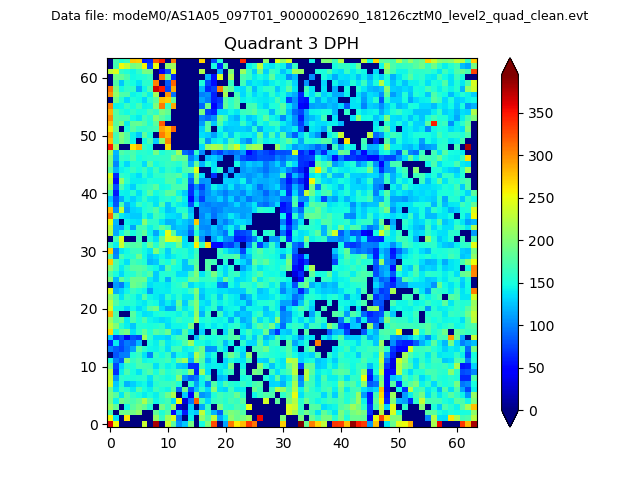 |
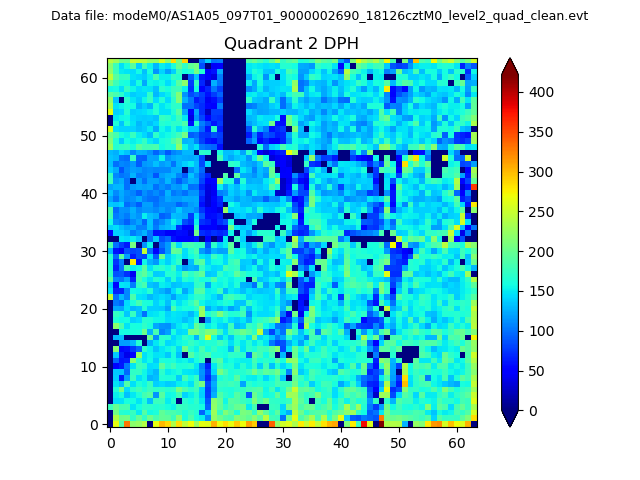 |
Quadrant C |
| Plot type | Count rate plots | Images |
|---|---|---|
| Comparison with Poisson distribution Blue bars denote a histogram of data divided into 1 sec bins. Red curve is a Poisson curve with rate = median count rate of data. |
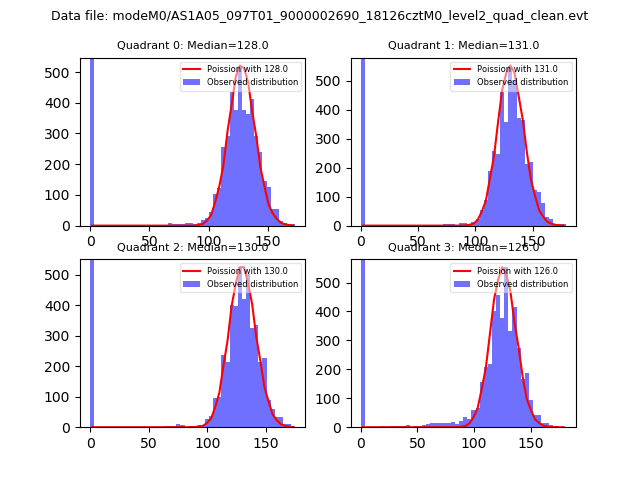 |
 |
| Quadrant-wise count rates Data is divided into 100 sec bins |
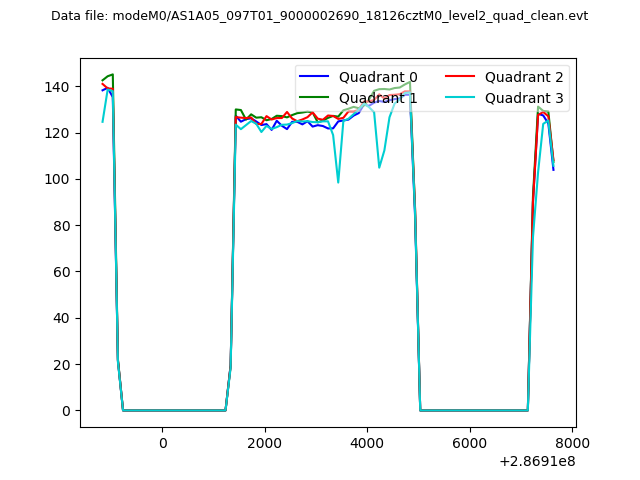 |
|
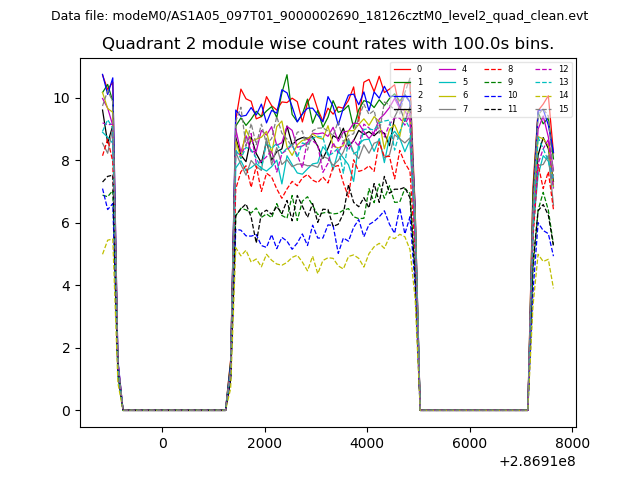
| Module-wise count rates for Quadrant A Data is divided into 100 sec bins |
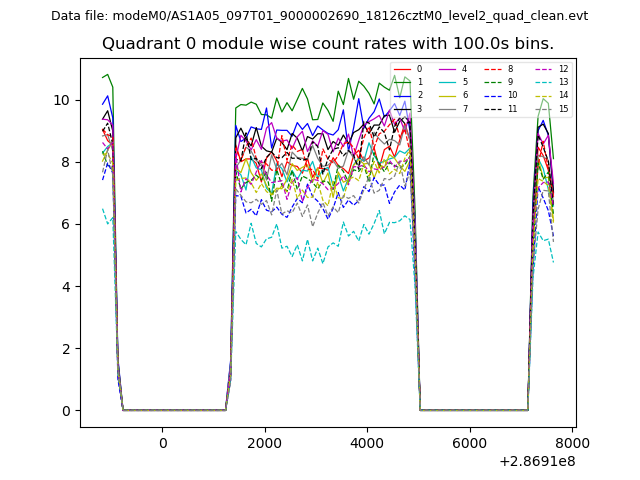 |
 |
| Module-wise count rates for Quadrant B Data is divided into 100 sec bins |
 |
 |
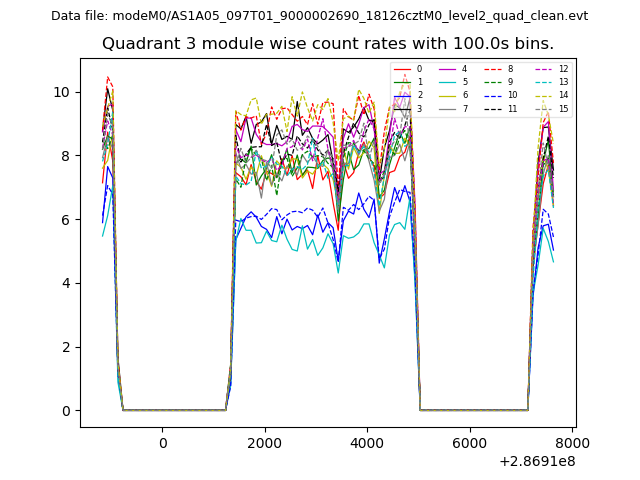
| Module-wise count rates for Quadrant C Data is divided into 100 sec bins |
 |
 |
| Module-wise count rates for Quadrant D Data is divided into 100 sec bins |
 |
 |
| Parameter | Plot |
|---|---|
| CZT HV Monitor | 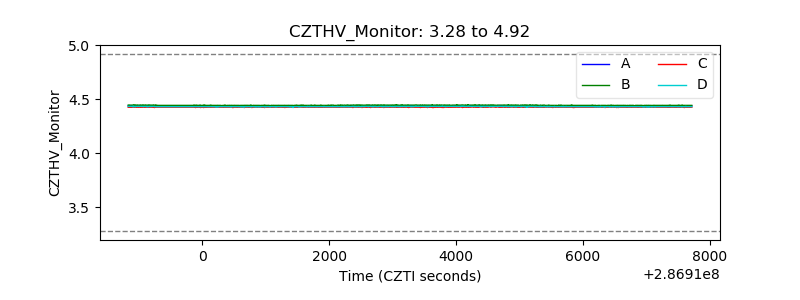 |
| D_VDD | 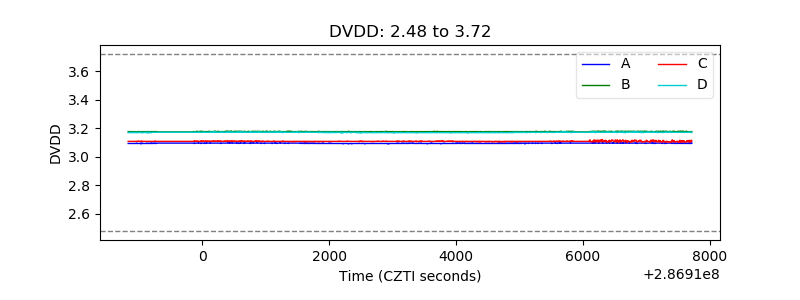 |
| Temperature 1 | 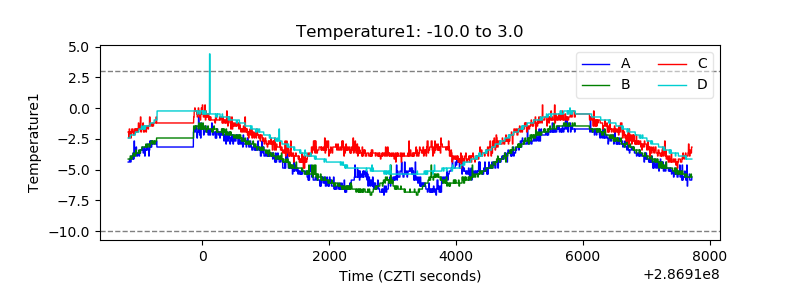 |
| Veto HV Monitor | 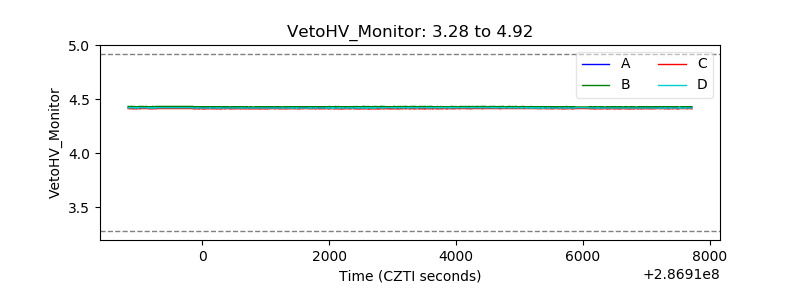 |
| Veto LLD |  |
| Alpha Counter | 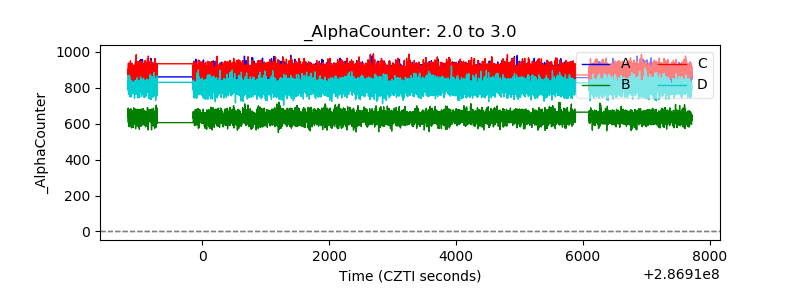 |
| _CPM_Rate | 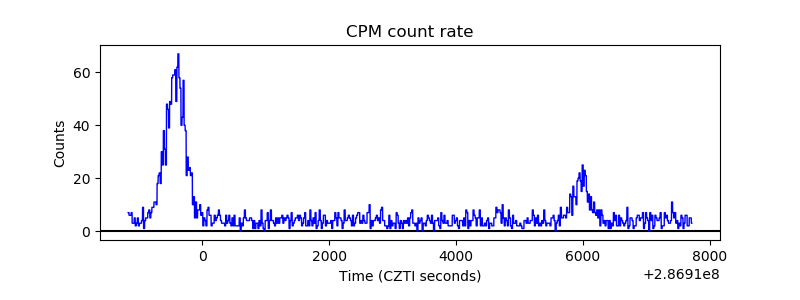 |
| CZT Counter |  |
| +2.5 Volts monitor |  |
| +5 Volts monitor | 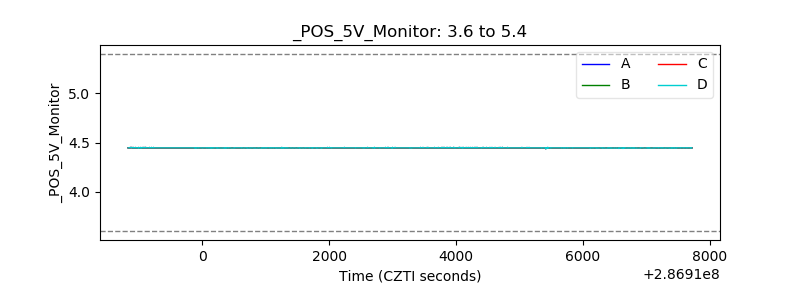 |
| _ROLL_ROT | 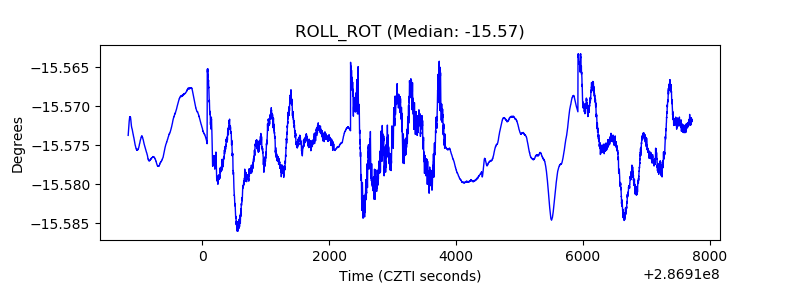 |
| _Roll_DEC | 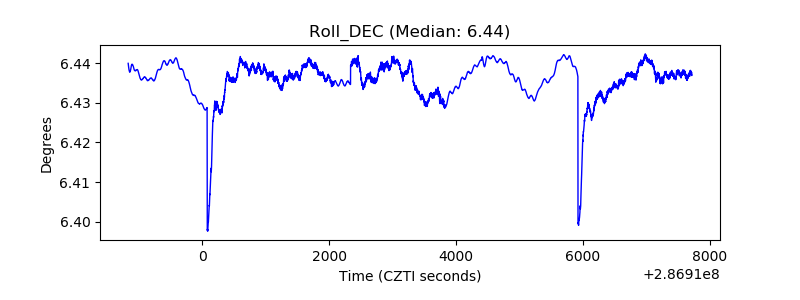 |
| _Roll_RA | 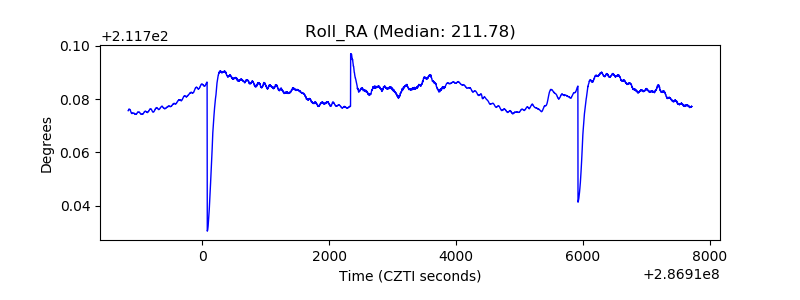 |
| Veto Counter | 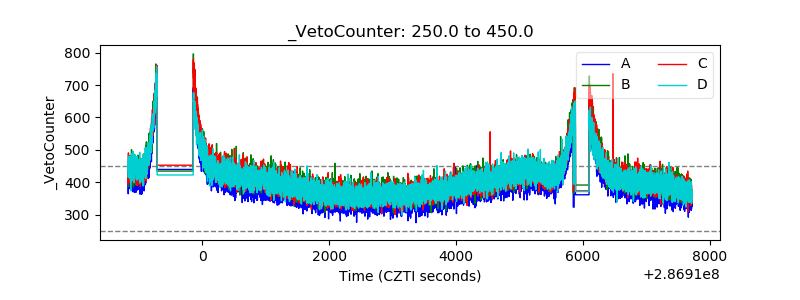 |