| Param | Original file | Final file |
|---|---|---|
| Filename | modeM0/AS1A05_097T01_9000002690_18127cztM0_level2.evt | modeM0/AS1A05_097T01_9000002690_18127cztM0_level2_quad_clean.evt |
| Size (bytes) | 130,510,080 | 15,045,120 |
| Size | 124.5 MB | 14.3 MB |
| Events in quadrant A | 807,755 | 84,518 |
| Events in quadrant B | 827,120 | 87,326 |
| Events in quadrant C | 784,333 | 85,143 |
| Events in quadrant D | 1,422,613 | 80,474 |
| Mode M0 | |||
|---|---|---|---|
| Quadrant | BADHDUFLAG | Total packets | Discarded packets |
| A | 0 | 3324 | 0 |
| B | 0 | 3369 | 0 |
| C | 0 | 3222 | 0 |
| D | 0 | 5364 | 0 |
| Mode SS | |||
|---|---|---|---|
| Quadrant | BADHDUFLAG | Total packets | Discarded packets |
| A | 0 | 32 | 0 |
| B | 0 | 32 | 0 |
| C | 0 | 32 | 0 |
| D | 0 | 32 | 0 |
| Quadrant | Total seconds | Saturated seconds | Saturation percentage |
|---|---|---|---|
| A | 1589 | 6 | 0.377596% |
| B | 1590 | 4 | 0.251572% |
| C | 1590 | 9 | 0.566038% |
| D | 1590 | 126 | 7.924528% |
Noise dominated data is calculated using 1-second bins in cleaned event files. If a bin has >2000 counts, and if more than 50% of those come from <1% of pixels, then it is considered to be noise-dominated and hence unusable.
| Quadrant | # 1 sec bins | Bins with >0 counts | Bins with >2000 counts | High rate bins dominated by noise | Noise dominated (total time) | Noise dominated (detector-on time) | Marked lightcurve |
|---|---|---|---|---|---|---|---|
| A | 1589 | 1589 | 1 | 1 | 0.06% | 0.06% | 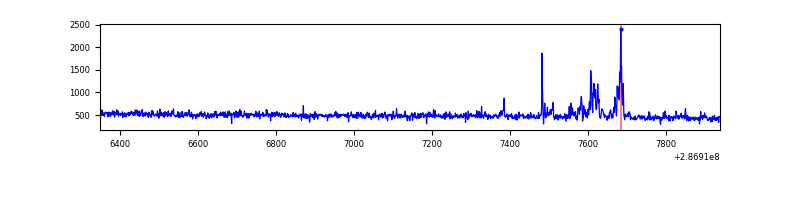 |
| B | 1590 | 1590 | 0 | 0 | 0.00% | 0.00% | 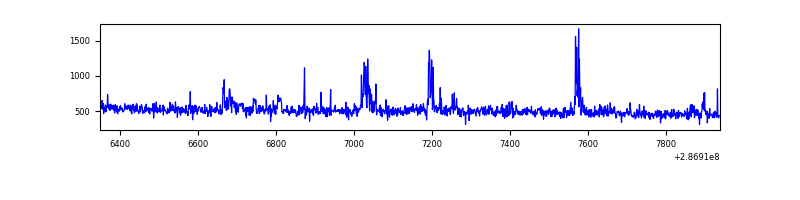 |
| C | 1590 | 1590 | 0 | 0 | 0.00% | 0.00% | 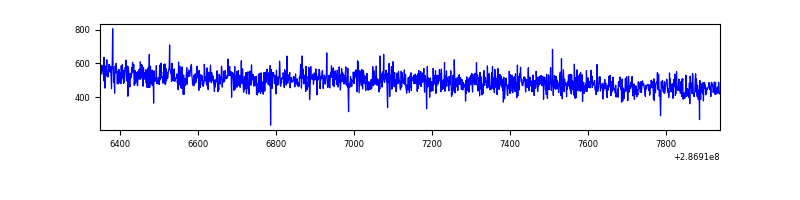 |
| D | 1590 | 1590 | 111 | 111 | 6.98% | 6.98% | 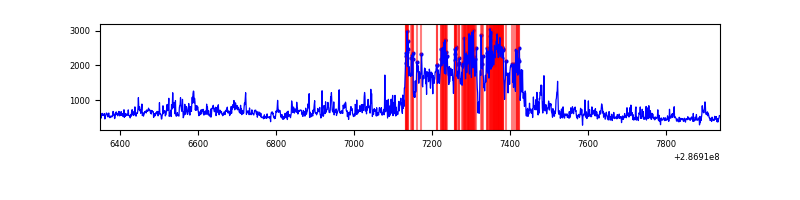 |
Top three noisy pixels from each quadrant. If the there are fewer than three noisy pixels in the level2.evt file, extra rows are filled as -1
| Pixel properties | Quadrant properties | ||||||
|---|---|---|---|---|---|---|---|
| Quadrant | DetID | PixID | Counts | Sigma | Mean | Median | Sigma |
| A | 15 | 174 | 45866 | 1075.11 | 198 | 193 | 42.5 |
| A | 0 | 226 | 1767 | 37.05 | 198 | 193 | 42.5 |
| A | 3 | 137 | 1481 | 30.32 | 198 | 193 | 42.5 |
| B | 0 | 197 | 24890 | 614.28 | 198 | 193 | 40.2 |
| B | 5 | 172 | 10010 | 244.17 | 198 | 193 | 40.2 |
| B | 7 | 220 | 8152 | 197.96 | 198 | 193 | 40.2 |
| C | 14 | 238 | 29401 | 622.42 | 191 | 192 | 46.9 |
| C | 8 | 128 | 2959 | 58.96 | 191 | 192 | 46.9 |
| C | 5 | 218 | 2632 | 51.99 | 191 | 192 | 46.9 |
| D | 7 | 238 | 600957 | 12309.55 | 191 | 185 | 48.8 |
| D | 7 | 38 | 42663 | 870.36 | 191 | 185 | 48.8 |
| D | 13 | 168 | 16832 | 341.09 | 191 | 185 | 48.8 |
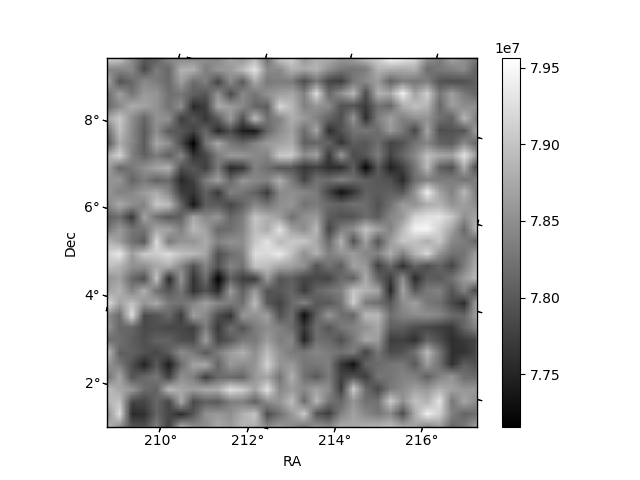
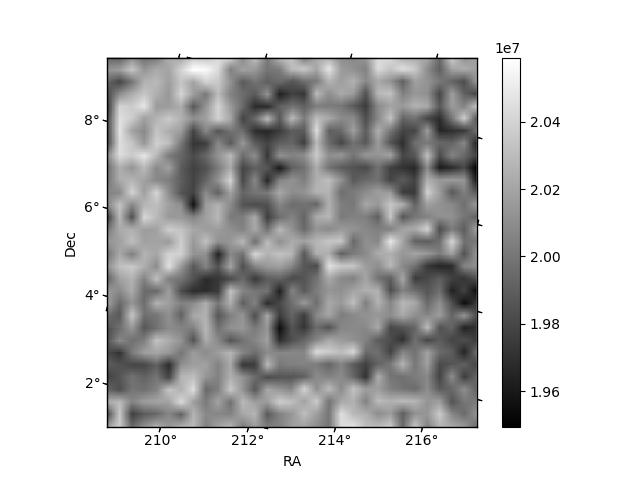
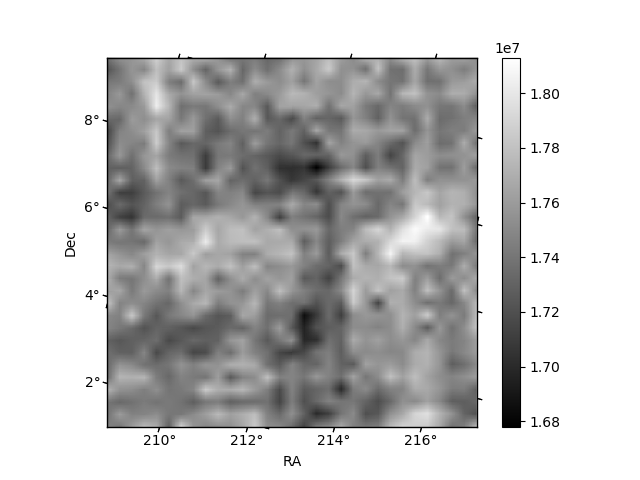
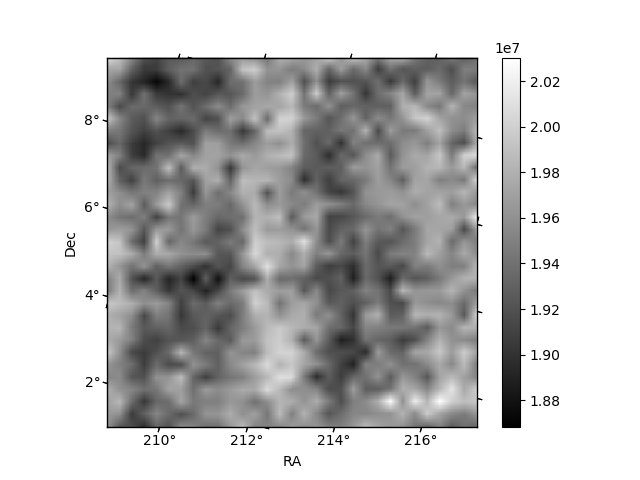
Histogram calculated using DETX and DETY for each event in the final _common_clean file
| Quadrant A | 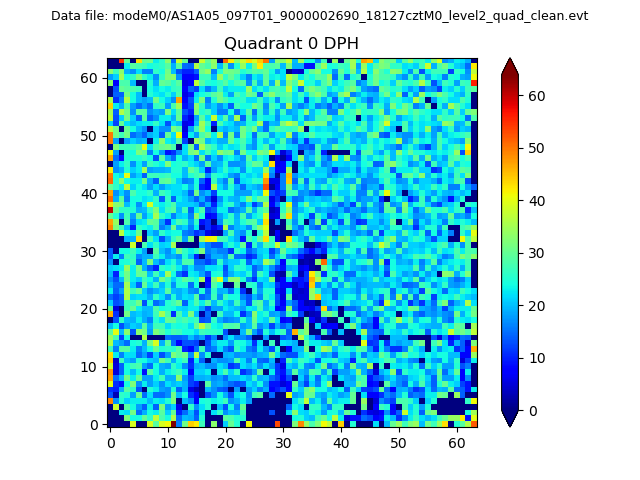 |
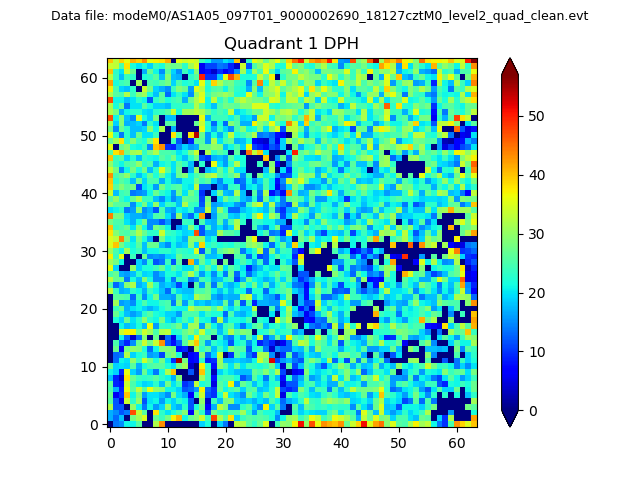 |
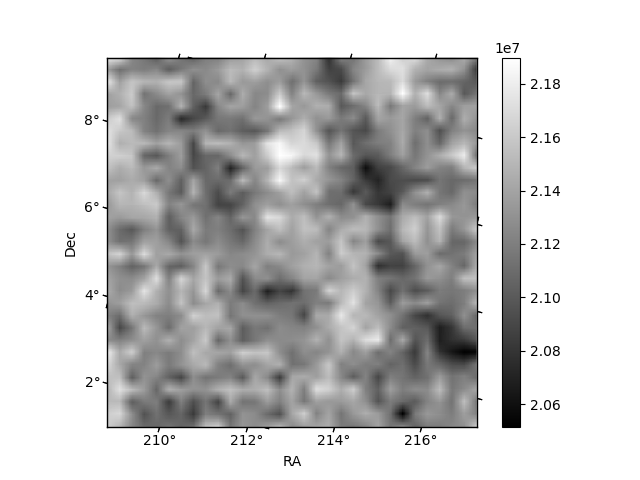
Quadrant B |
|---|---|---|---|
| Quadrant D | 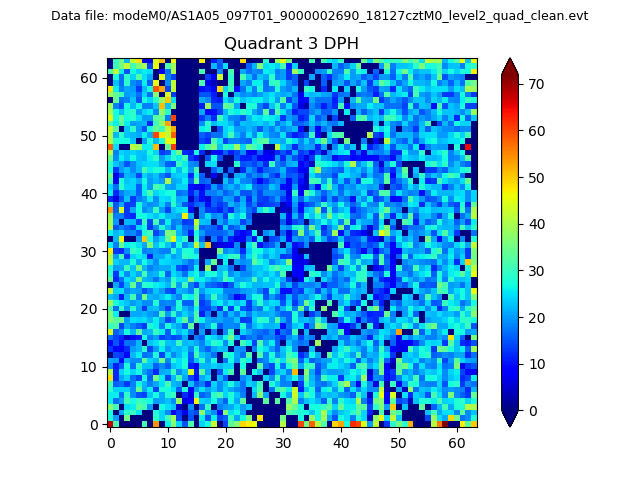 |
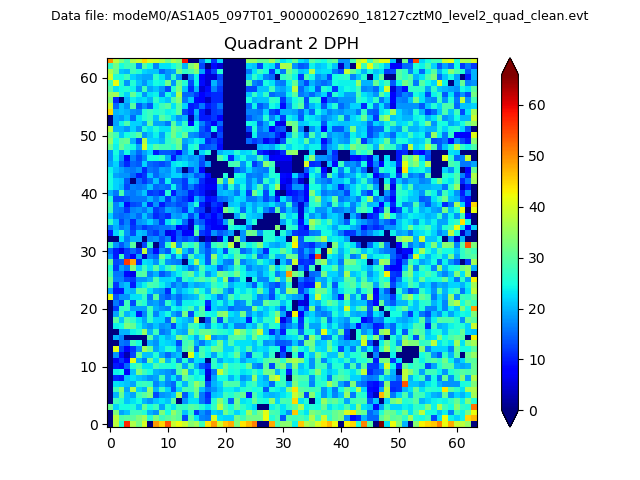 |
Quadrant C |
| Plot type | Count rate plots | Images |
|---|---|---|
| Comparison with Poisson distribution Blue bars denote a histogram of data divided into 1 sec bins. Red curve is a Poisson curve with rate = median count rate of data. |
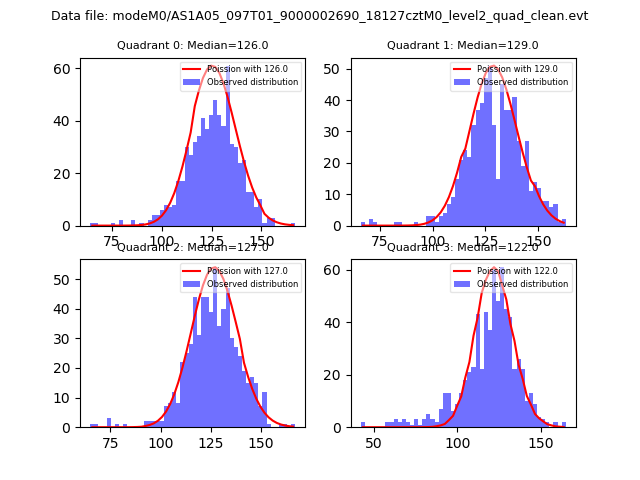 |
 |
| Quadrant-wise count rates Data is divided into 100 sec bins |
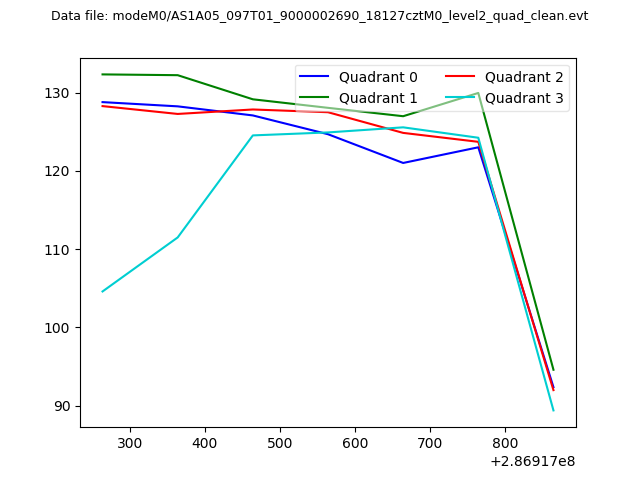 |
|
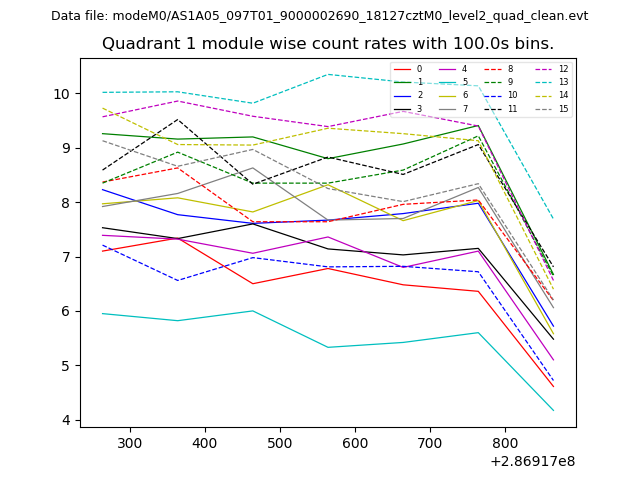
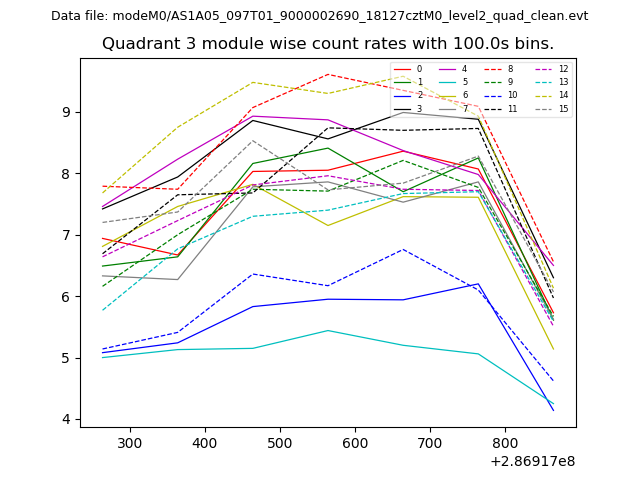
| Module-wise count rates for Quadrant A Data is divided into 100 sec bins |
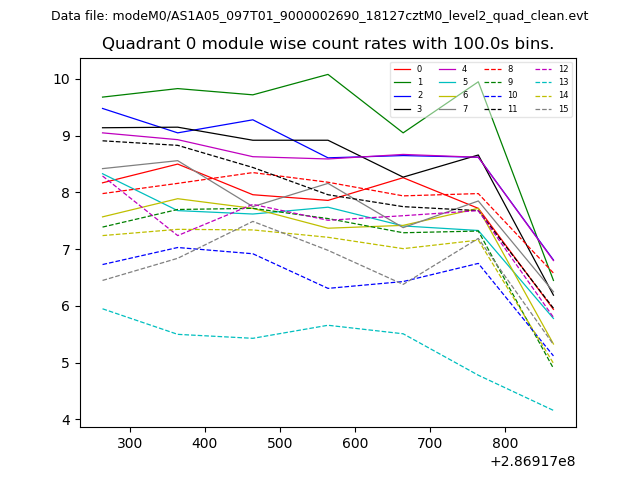 |
 |
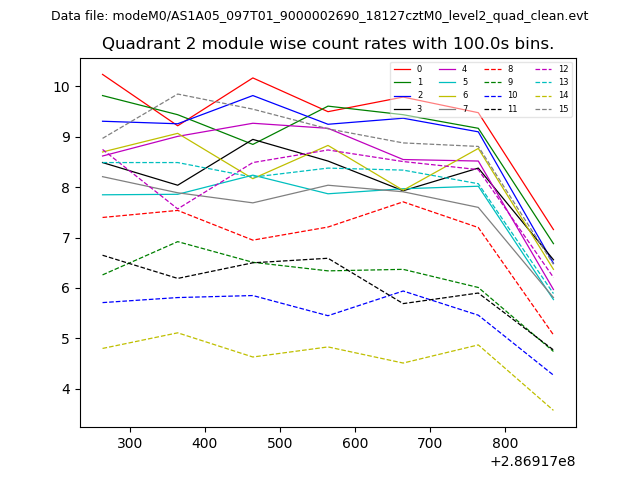
| Module-wise count rates for Quadrant B Data is divided into 100 sec bins |
 |
 |
| Module-wise count rates for Quadrant C Data is divided into 100 sec bins |
 |
 |
| Module-wise count rates for Quadrant D Data is divided into 100 sec bins |
 |
 |
| Parameter | Plot |
|---|---|
| CZT HV Monitor | 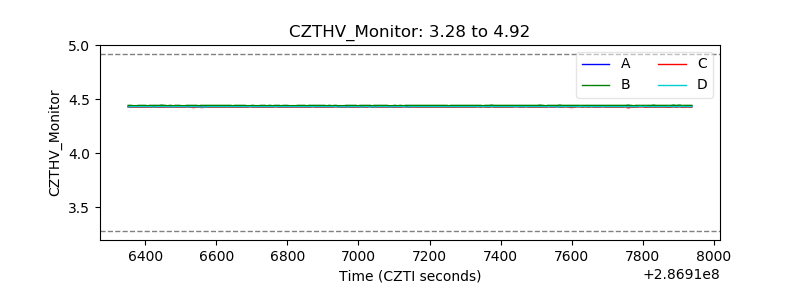 |
| D_VDD | 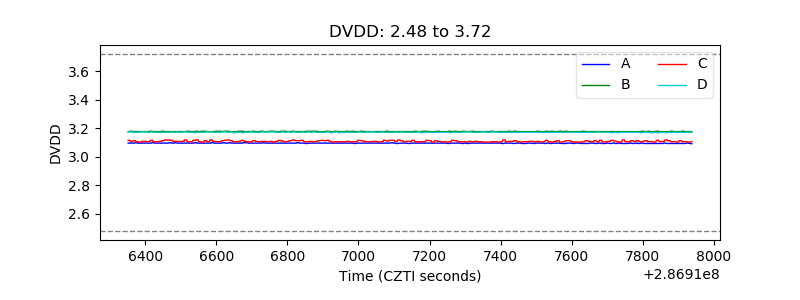 |
| Temperature 1 | 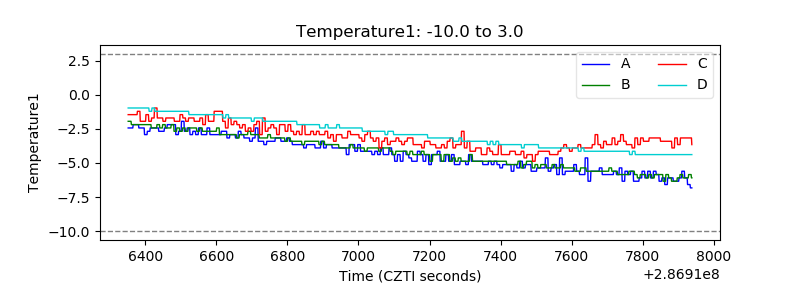 |
| Veto HV Monitor | 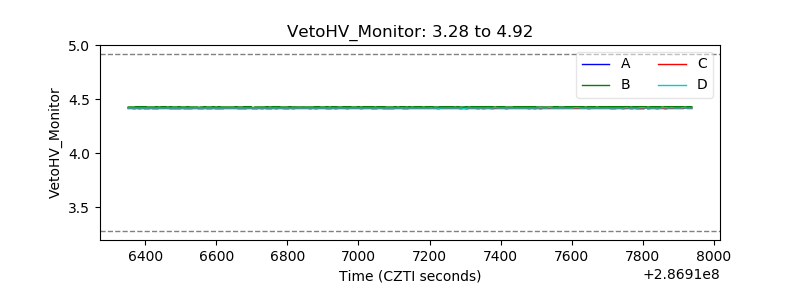 |
| Veto LLD | 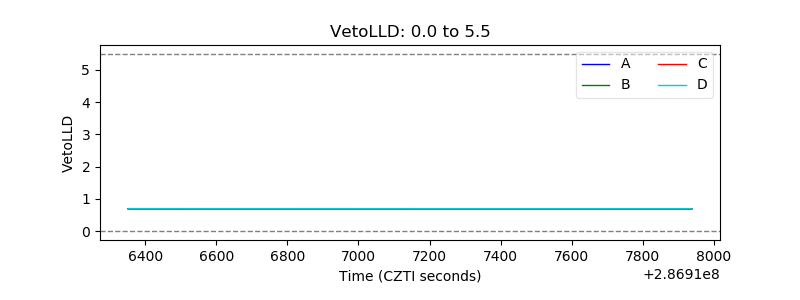 |
| Alpha Counter | 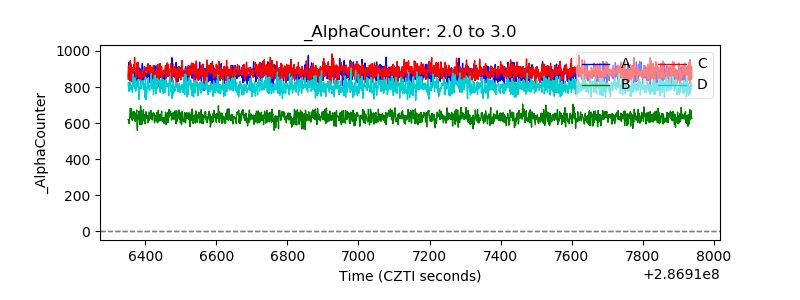 |
| _CPM_Rate | 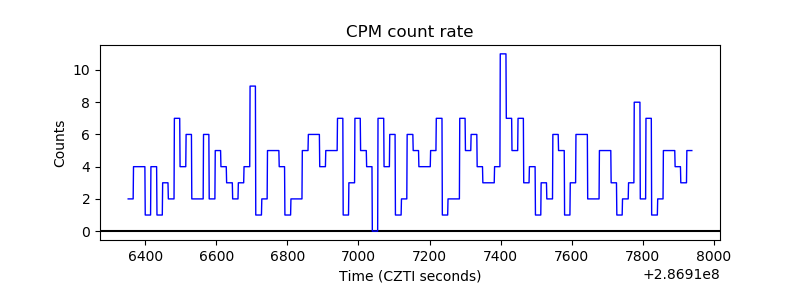 |
| CZT Counter | 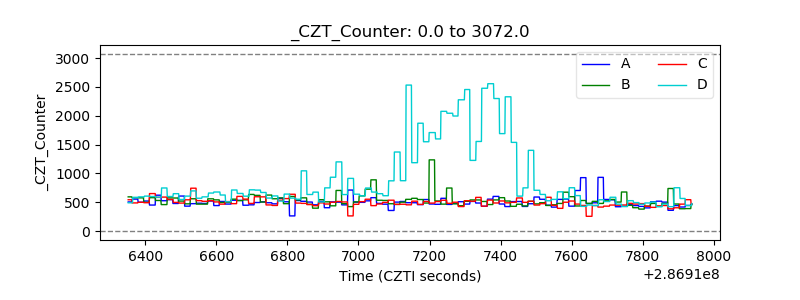 |
| +2.5 Volts monitor |  |
| +5 Volts monitor |  |
| _ROLL_ROT | 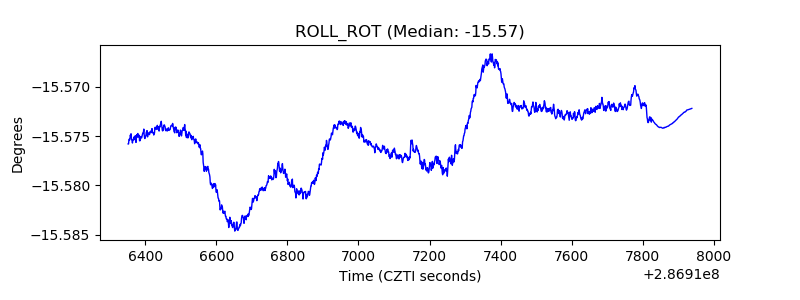 |
| _Roll_DEC | 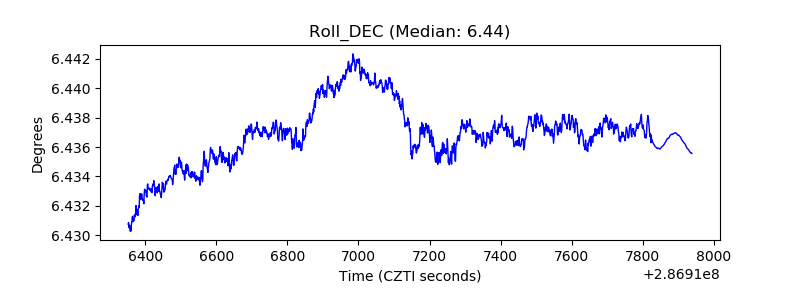 |
| _Roll_RA | 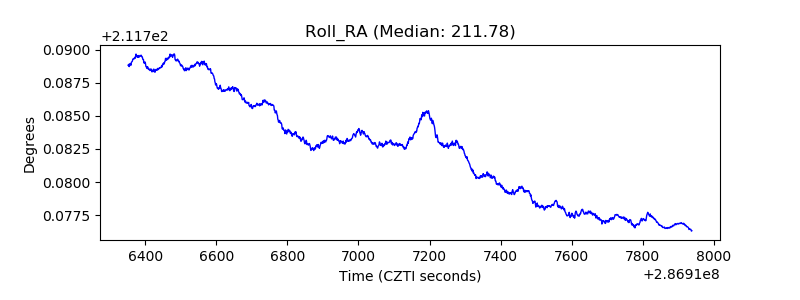 |
| Veto Counter | 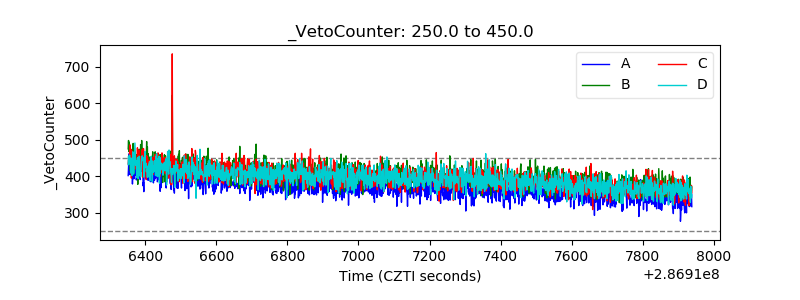 |