| Param | Original file | Final file |
|---|---|---|
| Filename | modeM0/AS1A05_186T01_9000002692cztM0_level2.fits | modeM0/AS1A05_186T01_9000002692cztM0_level2_quad_clean.evt |
| Size (bytes) | 494,562,240 | 400,769,280 |
| Size | 471.7 MB | 382.2 MB |
| Events in quadrant A | 3,125,546 | 2,341,493 |
| Events in quadrant B | 2,975,906 | 2,342,306 |
| Events in quadrant C | 2,959,744 | 2,182,681 |
| Events in quadrant D | 2,508,340 | 1,860,841 |
| Mode SS | |||
|---|---|---|---|
| Quadrant | BADHDUFLAG | Total packets | Discarded packets |
| A | 0 | 1014 | 0 |
| B | 0 | 1014 | 0 |
| C | 0 | 1014 | 0 |
| D | 0 | 1014 | 0 |
| Mode M0 | |||
|---|---|---|---|
| Quadrant | BADHDUFLAG | Total packets | Discarded packets |
| A | 0 | 103961 | 0 |
| B | 0 | 106622 | 0 |
| C | 0 | 103537 | 0 |
| D | 0 | 141896 | 0 |
| Mode M9 | |||
|---|---|---|---|
| Quadrant | BADHDUFLAG | Total packets | Discarded packets |
| A | 0 | 79 | 0 |
| B | 0 | 79 | 0 |
| C | 0 | 79 | 0 |
| D | 0 | 79 | 0 |
| Quadrant | Total seconds | Saturated seconds | Saturation percentage |
|---|---|---|---|
| A | 49652 | 386 | 0.777411% |
| B | 49652 | 531 | 1.069443% |
| C | 49652 | 550 | 1.107710% |
| D | 49652 | 3058 | 6.158866% |
Noise dominated data is calculated using 1-second bins in cleaned event files. If a bin has >2000 counts, and if more than 50% of those come from <1% of pixels, then it is considered to be noise-dominated and hence unusable.
| Quadrant | # 1 sec bins | Bins with >0 counts | Bins with >2000 counts | High rate bins dominated by noise | Noise dominated (total time) | Noise dominated (detector-on time) | Marked lightcurve |
|---|---|---|---|---|---|---|---|
| A | 57712 | 49652 | 0 | 0 | 0.00% | 0.00% |  |
| B | 57712 | 49652 | 0 | 0 | 0.00% | 0.00% |  |
| C | 57712 | 49650 | 0 | 0 | 0.00% | 0.00% | 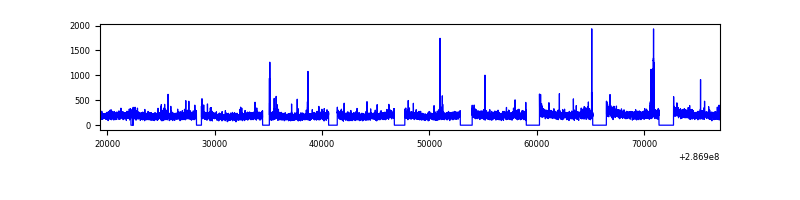 |
| D | 57712 | 49422 | 0 | 0 | 0.00% | 0.00% | 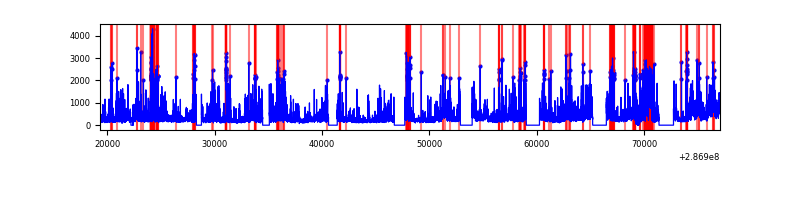 |
Top three noisy pixels from each quadrant. If the there are fewer than three noisy pixels in the level2.evt file, extra rows are filled as -1
| Pixel properties | Quadrant properties | ||||||
|---|---|---|---|---|---|---|---|
| Quadrant | DetID | PixID | Counts | Sigma | Mean | Median | Sigma |
| A | 0 | 29 | 3035 | 11.44 | 812 | 764 | 198.5 |
| A | 7 | 110 | 2506 | 8.78 | 812 | 764 | 198.5 |
| A | 0 | 30 | 2427 | 8.38 | 812 | 764 | 198.5 |
| B | 2 | 9 | 2394 | 10.41 | 788 | 753 | 157.7 |
| B | 2 | 8 | 1991 | 7.85 | 788 | 753 | 157.7 |
| B | 5 | 128 | 1952 | 7.6 | 788 | 753 | 157.7 |
| C | 12 | 241 | 2020 | 6.43 | 783 | 731 | 200.4 |
| C | 9 | 233 | 1985 | 6.26 | 783 | 731 | 200.4 |
| C | 3 | 126 | 1979 | 6.23 | 783 | 731 | 200.4 |
| D | 10 | 190 | 1859 | 6.43 | 714 | 651 | 187.8 |
| D | 3 | 14 | 1809 | 6.17 | 714 | 651 | 187.8 |
| D | 6 | 67 | 1785 | 6.04 | 714 | 651 | 187.8 |
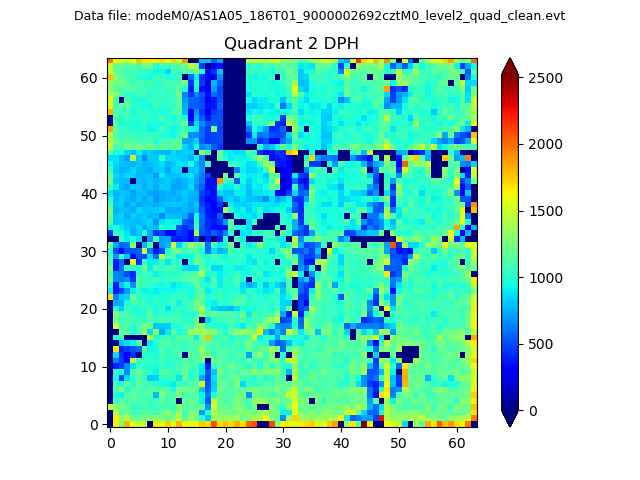
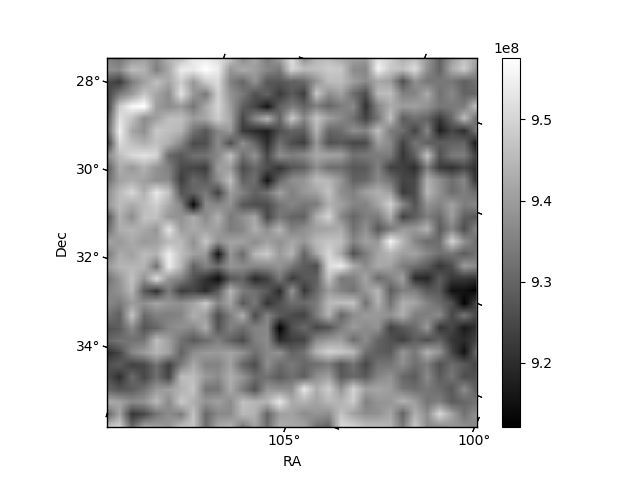
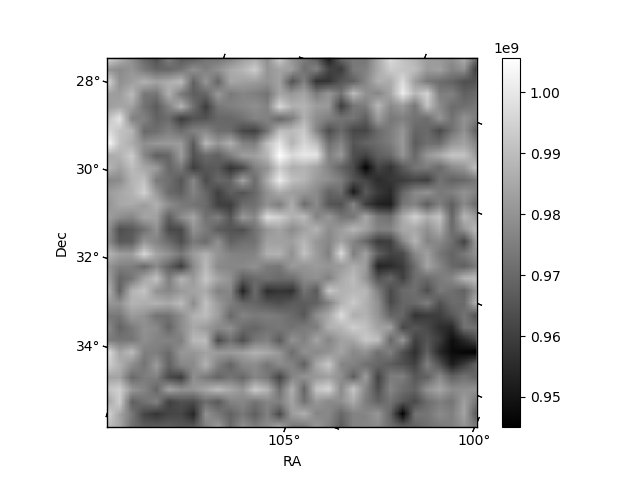
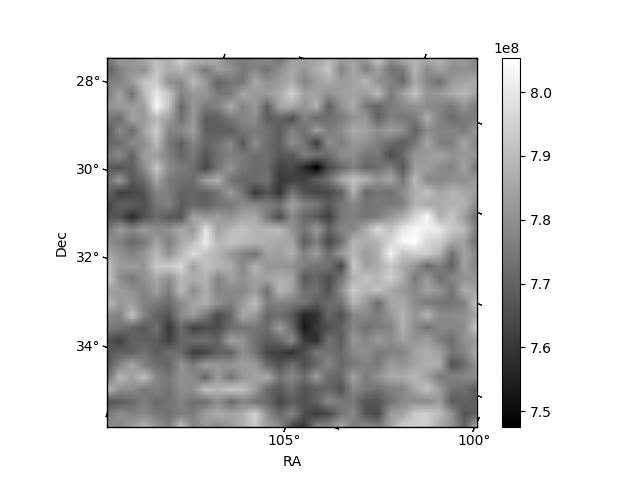
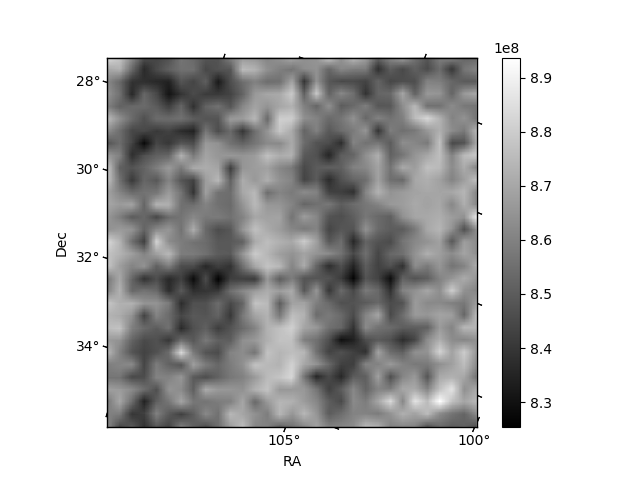
Histogram calculated using DETX and DETY for each event in the final _common_clean file
| Quadrant A | 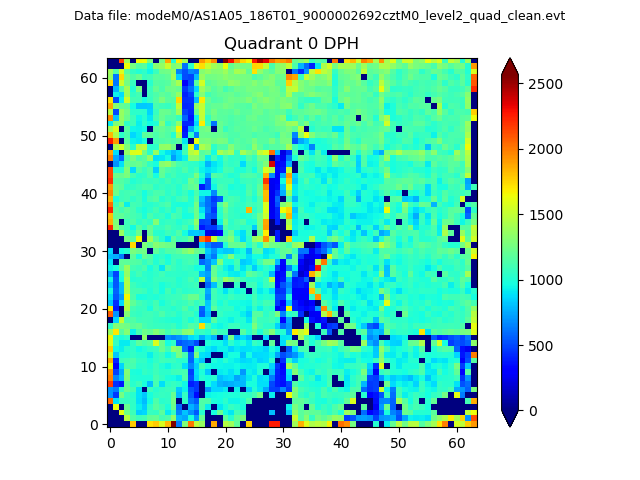 |
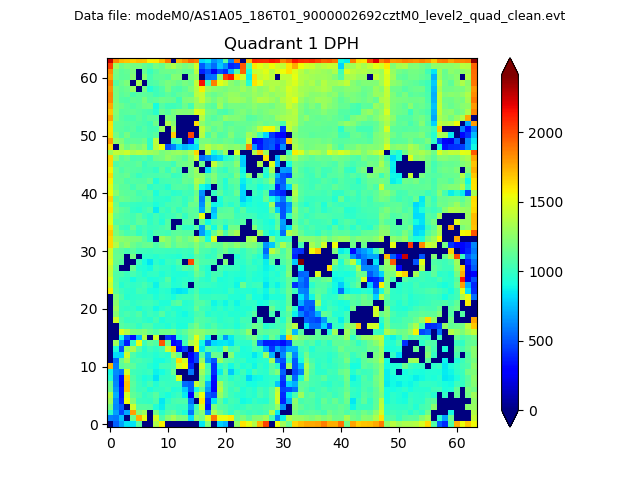 |
Quadrant B |
|---|---|---|---|
| Quadrant D | 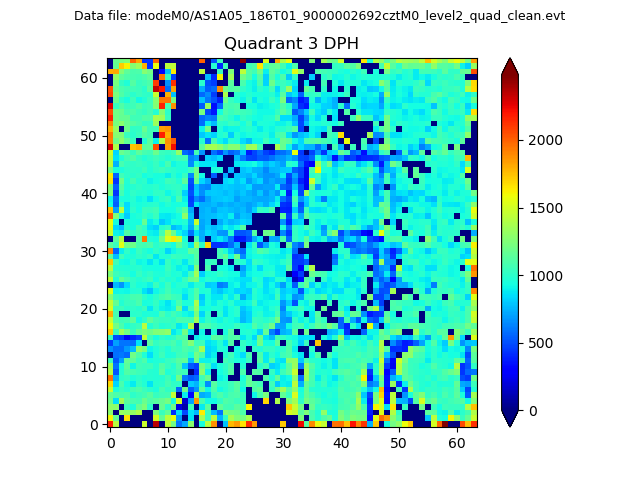 |
 |
Quadrant C |
| Plot type | Count rate plots | Images |
|---|---|---|
| Comparison with Poisson distribution Blue bars denote a histogram of data divided into 1 sec bins. Red curve is a Poisson curve with rate = median count rate of data. |
 |
 |
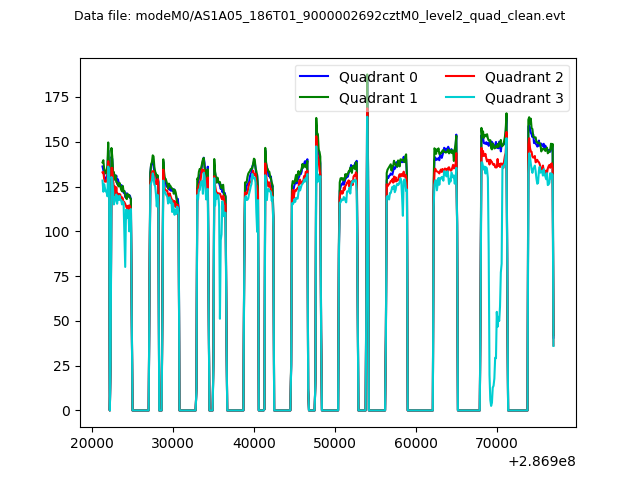
| Quadrant-wise count rates Data is divided into 100 sec bins |
 |
|
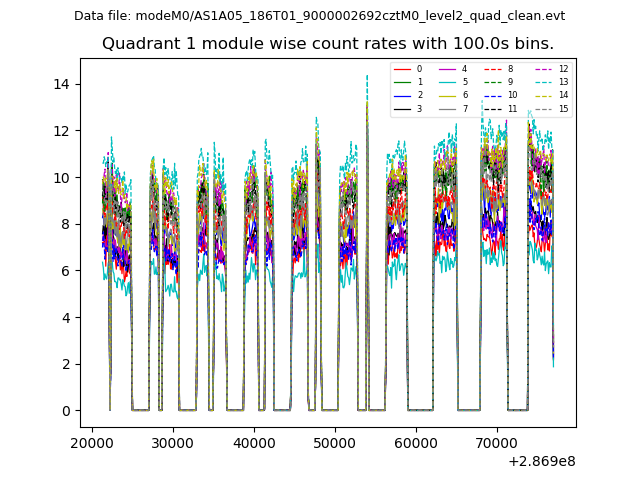
| Module-wise count rates for Quadrant A Data is divided into 100 sec bins |
 |
 |
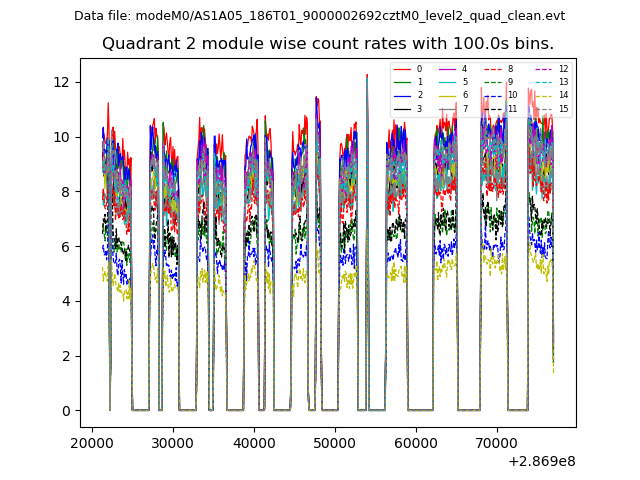
| Module-wise count rates for Quadrant B Data is divided into 100 sec bins |
 |
 |
| Module-wise count rates for Quadrant C Data is divided into 100 sec bins |
 |
 |
| Module-wise count rates for Quadrant D Data is divided into 100 sec bins |
 |
 |
| Parameter | Plot |
|---|---|
| CZT HV Monitor | 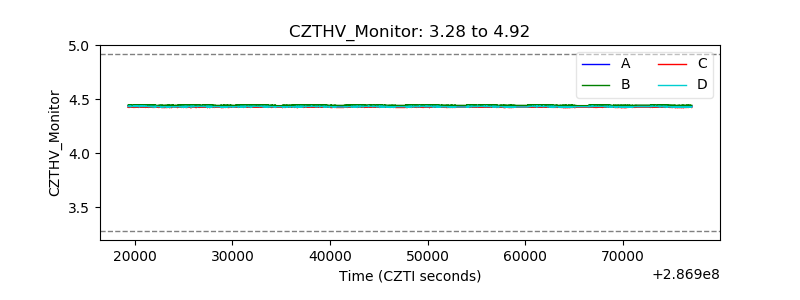 |
| D_VDD | 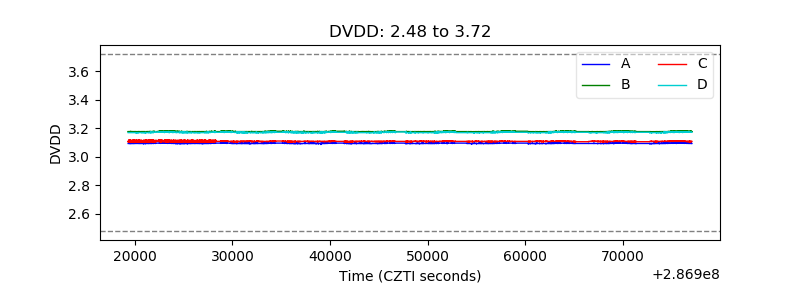 |
| Temperature 1 | 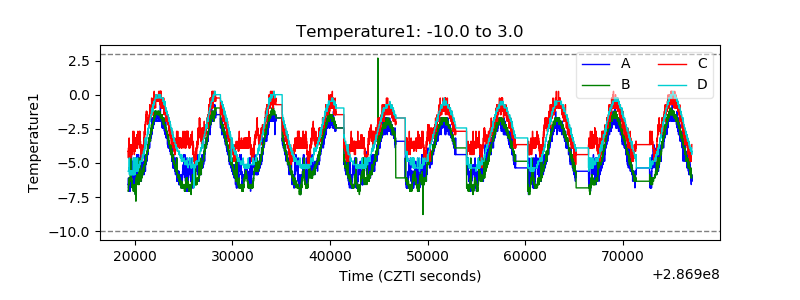 |
| Veto HV Monitor |  |
| Veto LLD | 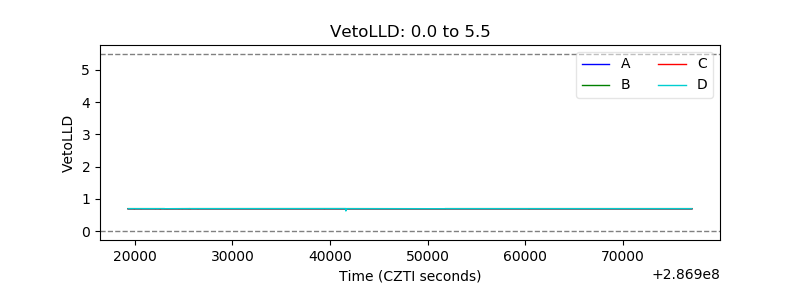 |
| Alpha Counter |  |
| _CPM_Rate | 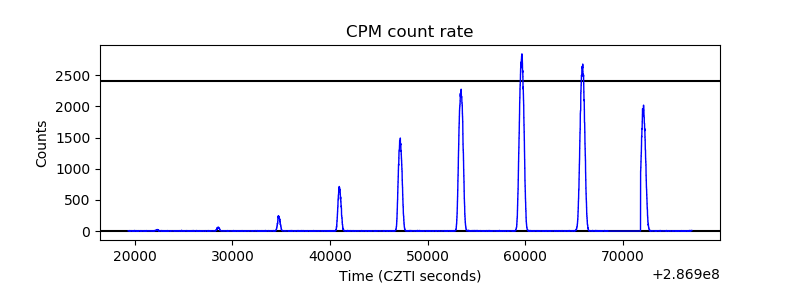 |
| CZT Counter | 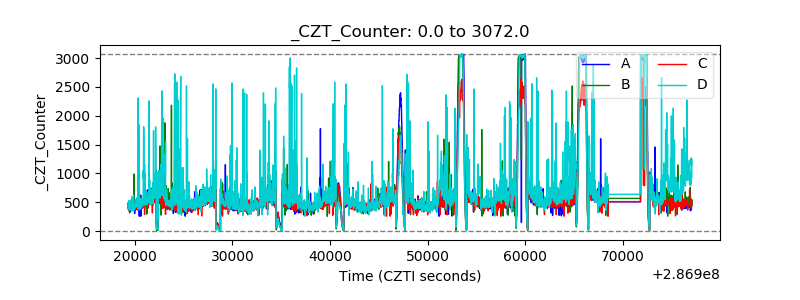 |
| +2.5 Volts monitor | 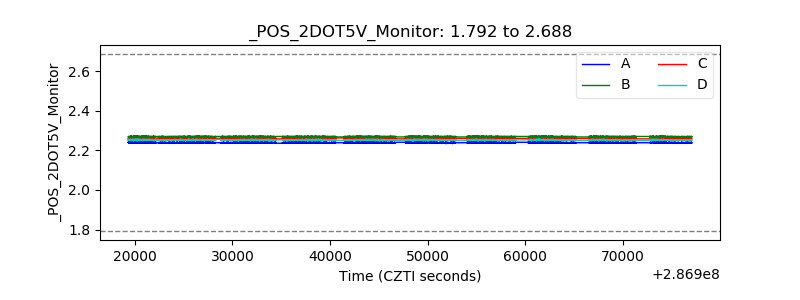 |
| +5 Volts monitor |  |
| _ROLL_ROT | 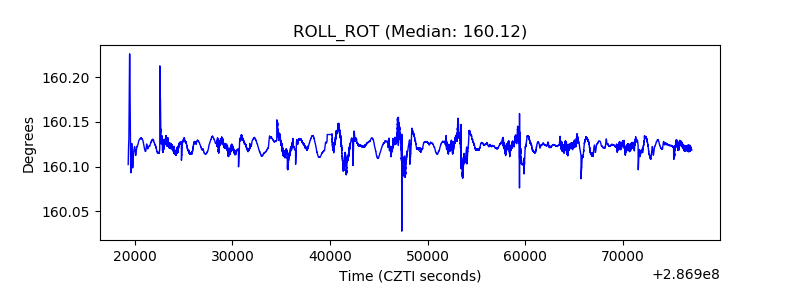 |
| _Roll_DEC | 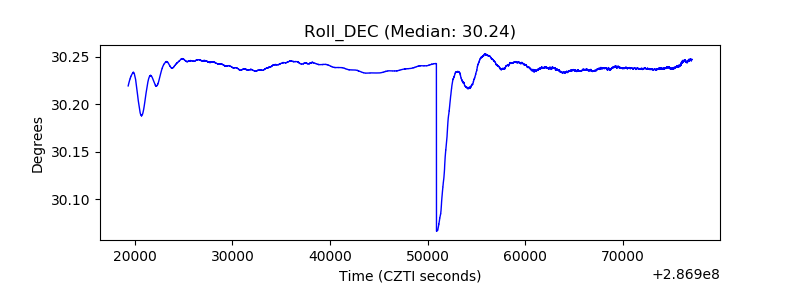 |
| _Roll_RA |  |
| Veto Counter | 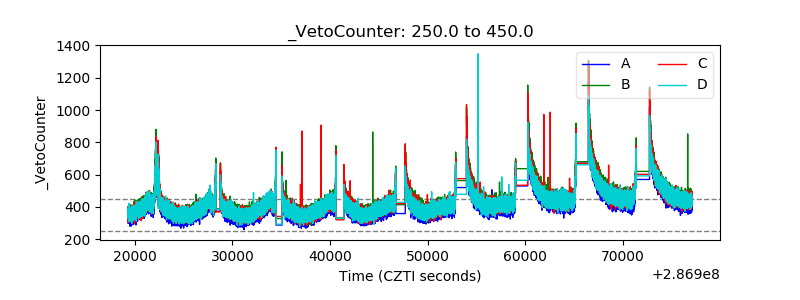 |