| Param | Original file | Final file |
|---|---|---|
| Filename | modeM0/AS1A05_186T01_9000002692_18127cztM0_level2.evt | modeM0/AS1A05_186T01_9000002692_18127cztM0_level2_quad_clean.evt |
| Size (bytes) | 333,725,760 | 53,075,520 |
| Size | 318.3 MB | 50.6 MB |
| Events in quadrant A | 2,229,329 | 329,598 |
| Events in quadrant B | 2,377,266 | 335,042 |
| Events in quadrant C | 2,241,663 | 317,909 |
| Events in quadrant D | 2,952,197 | 308,136 |
| Mode SS | |||
|---|---|---|---|
| Quadrant | BADHDUFLAG | Total packets | Discarded packets |
| A | 0 | 94 | 0 |
| B | 0 | 94 | 0 |
| C | 0 | 94 | 0 |
| D | 0 | 94 | 0 |
| Mode M0 | |||
|---|---|---|---|
| Quadrant | BADHDUFLAG | Total packets | Discarded packets |
| A | 0 | 9489 | 2 |
| B | 0 | 9895 | 2 |
| C | 0 | 9453 | 2 |
| D | 0 | 11836 | 2 |
| Mode M9 | |||
|---|---|---|---|
| Quadrant | BADHDUFLAG | Total packets | Discarded packets |
| A | 0 | 1 | 0 |
| B | 0 | 1 | 0 |
| C | 0 | 1 | 0 |
| D | 0 | 1 | 0 |
| Quadrant | Total seconds | Saturated seconds | Saturation percentage |
|---|---|---|---|
| A | 4488 | 107 | 2.384135% |
| B | 4488 | 129 | 2.874332% |
| C | 4488 | 106 | 2.361854% |
| D | 4488 | 143 | 3.186275% |
Noise dominated data is calculated using 1-second bins in cleaned event files. If a bin has >2000 counts, and if more than 50% of those come from <1% of pixels, then it is considered to be noise-dominated and hence unusable.
| Quadrant | # 1 sec bins | Bins with >0 counts | Bins with >2000 counts | High rate bins dominated by noise | Noise dominated (total time) | Noise dominated (detector-on time) | Marked lightcurve |
|---|---|---|---|---|---|---|---|
| A | 4688 | 4490 | 0 | 0 | 0.00% | 0.00% | 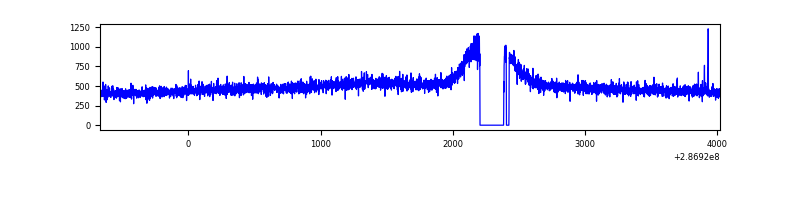 |
| B | 4688 | 4490 | 7 | 7 | 0.15% | 0.16% | 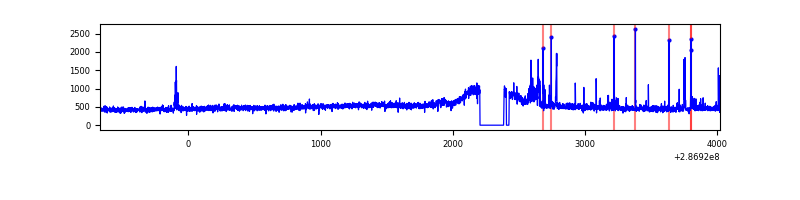 |
| C | 4688 | 4490 | 0 | 0 | 0.00% | 0.00% | 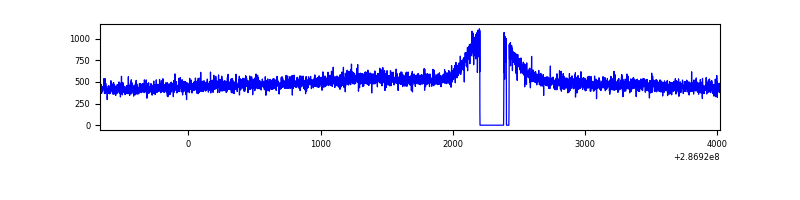 |
| D | 4688 | 4490 | 54 | 54 | 1.15% | 1.20% | 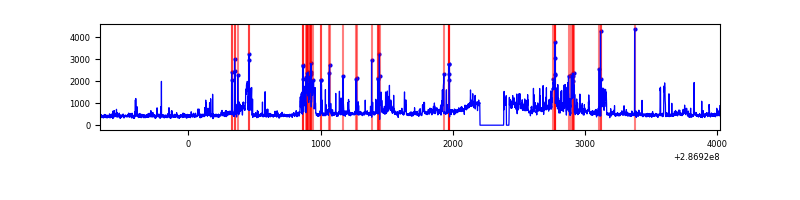 |
Top three noisy pixels from each quadrant. If the there are fewer than three noisy pixels in the level2.evt file, extra rows are filled as -1
| Pixel properties | Quadrant properties | ||||||
|---|---|---|---|---|---|---|---|
| Quadrant | DetID | PixID | Counts | Sigma | Mean | Median | Sigma |
| A | 4 | 2 | 5405 | 40.75 | 577 | 564 | 118.8 |
| A | 0 | 226 | 5020 | 37.51 | 577 | 564 | 118.8 |
| A | 15 | 174 | 4487 | 33.02 | 577 | 564 | 118.8 |
| B | 7 | 220 | 44297 | 389.59 | 572 | 557 | 112.3 |
| B | 4 | 216 | 29477 | 257.59 | 572 | 557 | 112.3 |
| B | 0 | 189 | 16167 | 139.04 | 572 | 557 | 112.3 |
| C | 14 | 238 | 84043 | 643.32 | 545 | 548 | 129.8 |
| C | 5 | 218 | 9163 | 66.38 | 545 | 548 | 129.8 |
| C | 8 | 128 | 8271 | 59.5 | 545 | 548 | 129.8 |
| D | 11 | 176 | 583952 | 4248.21 | 553 | 536 | 137.3 |
| D | 7 | 238 | 126804 | 919.44 | 553 | 536 | 137.3 |
| D | 9 | 64 | 46260 | 332.94 | 553 | 536 | 137.3 |
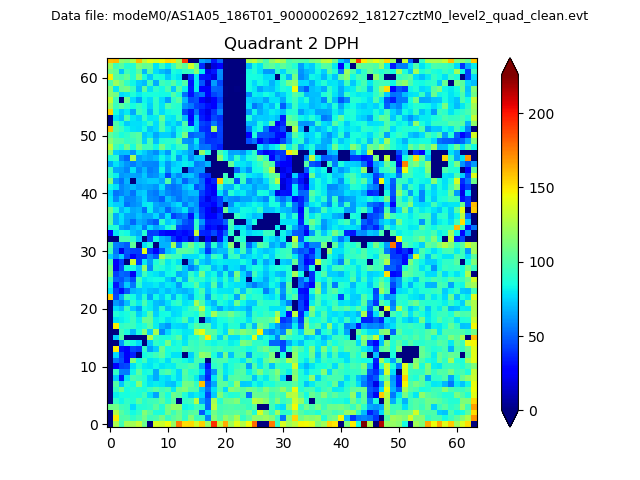
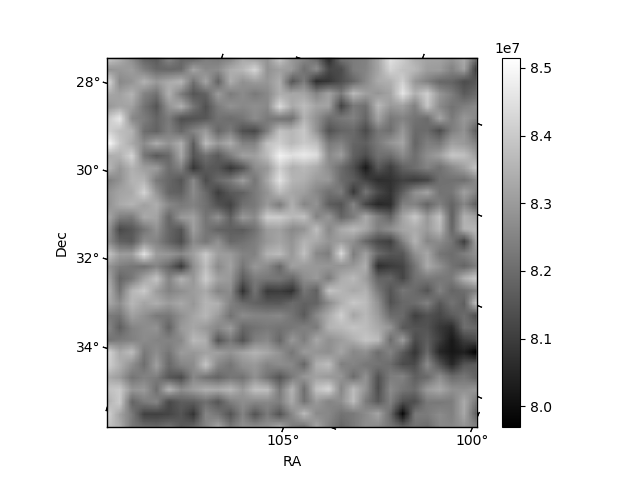
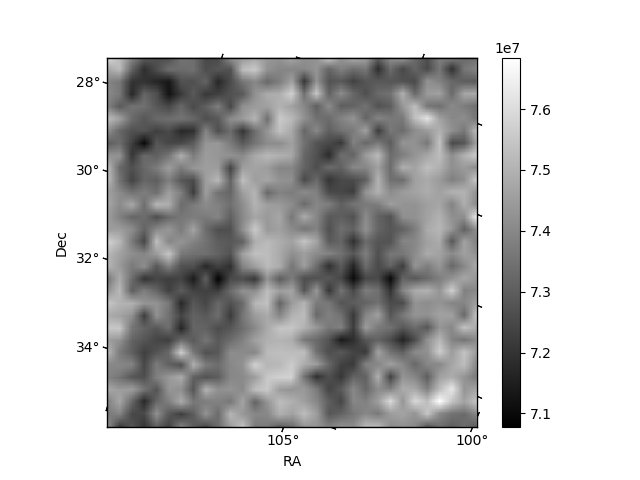
Histogram calculated using DETX and DETY for each event in the final _common_clean file
| Quadrant A | 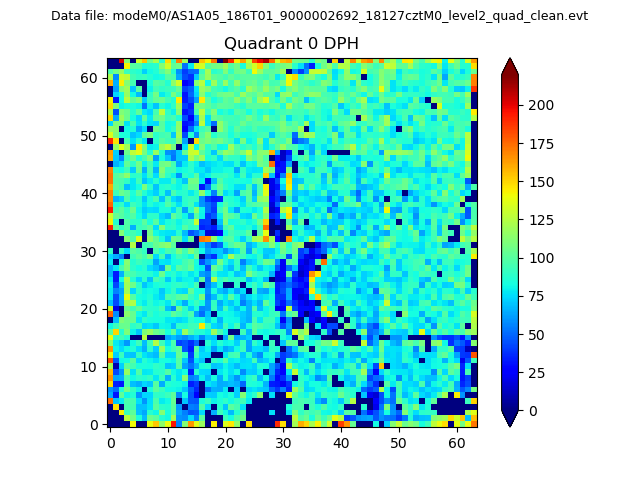 |
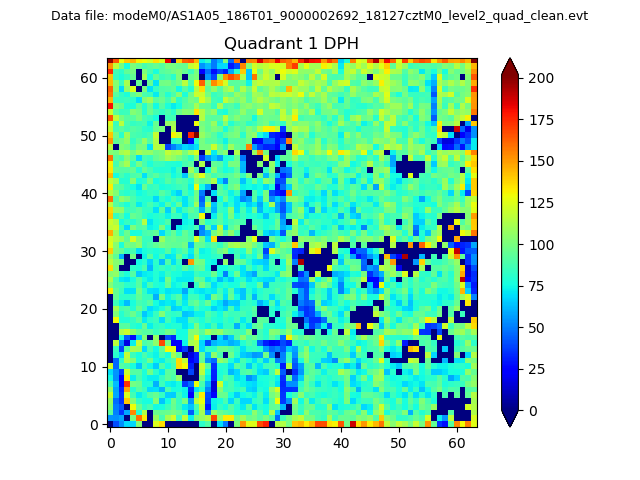 |
Quadrant B |
|---|---|---|---|
| Quadrant D | 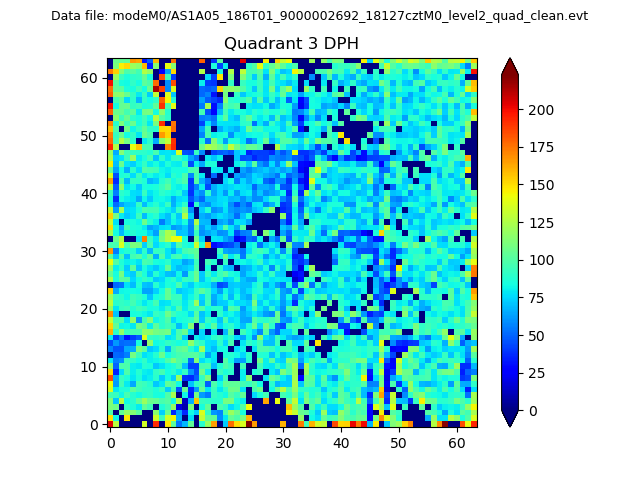 |
 |
Quadrant C |
| Plot type | Count rate plots | Images |
|---|---|---|
| Comparison with Poisson distribution Blue bars denote a histogram of data divided into 1 sec bins. Red curve is a Poisson curve with rate = median count rate of data. |
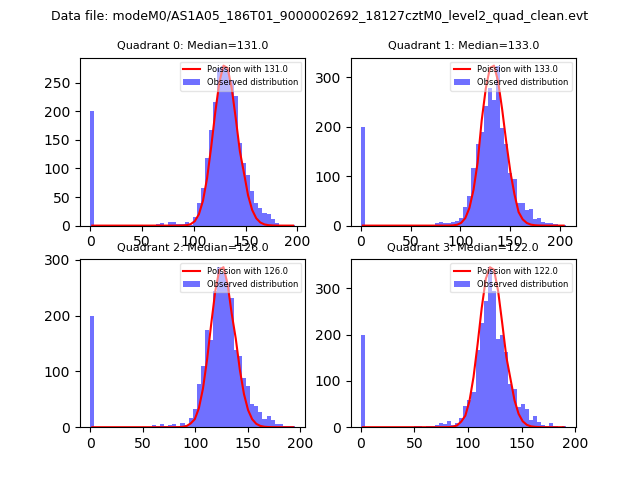 |
 |
| Quadrant-wise count rates Data is divided into 100 sec bins |
 |
|
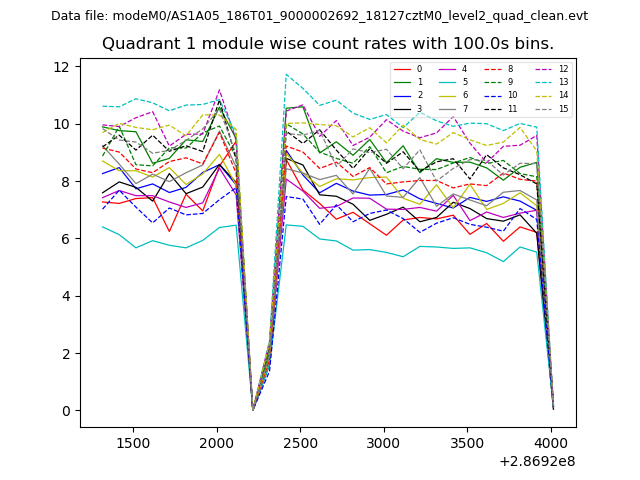
| Module-wise count rates for Quadrant A Data is divided into 100 sec bins |
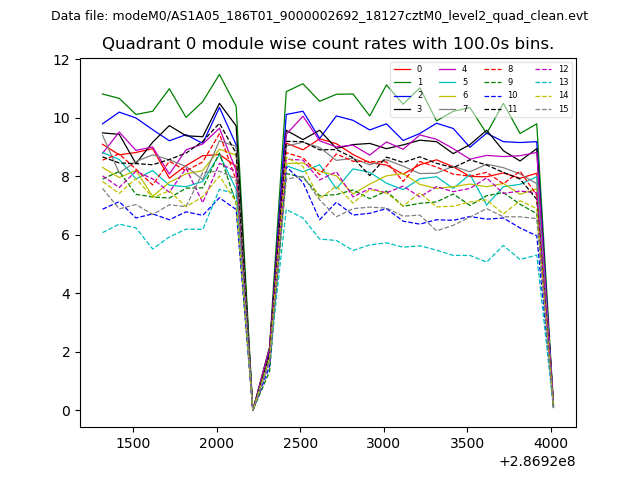 |
 |
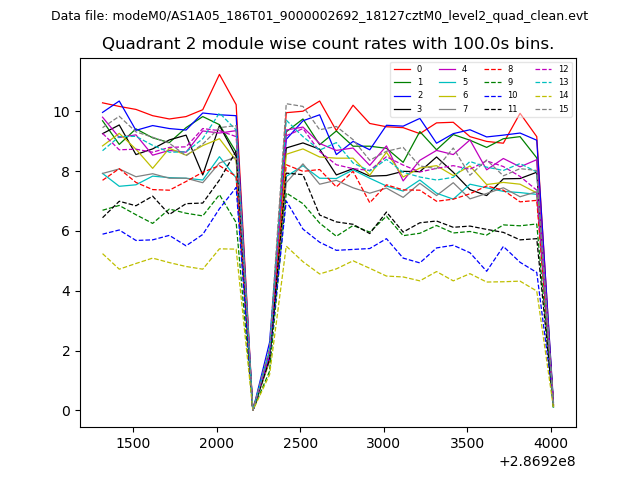
| Module-wise count rates for Quadrant B Data is divided into 100 sec bins |
 |
 |
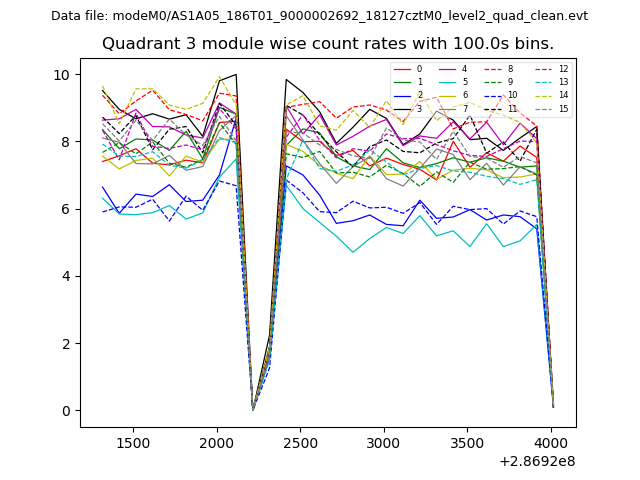
| Module-wise count rates for Quadrant C Data is divided into 100 sec bins |
 |
 |
| Module-wise count rates for Quadrant D Data is divided into 100 sec bins |
 |
 |
| Parameter | Plot |
|---|---|
| CZT HV Monitor | 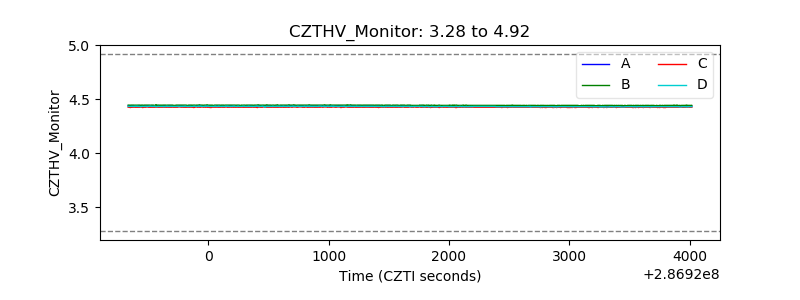 |
| D_VDD | 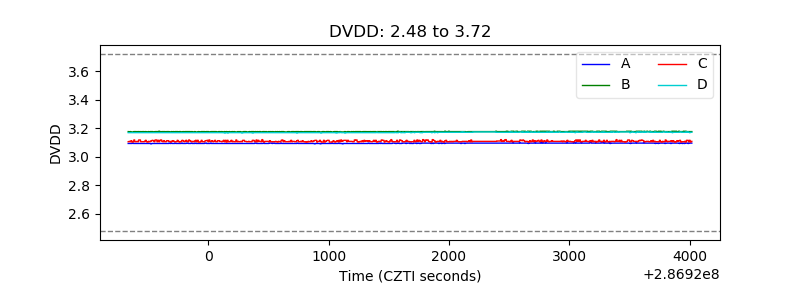 |
| Temperature 1 | 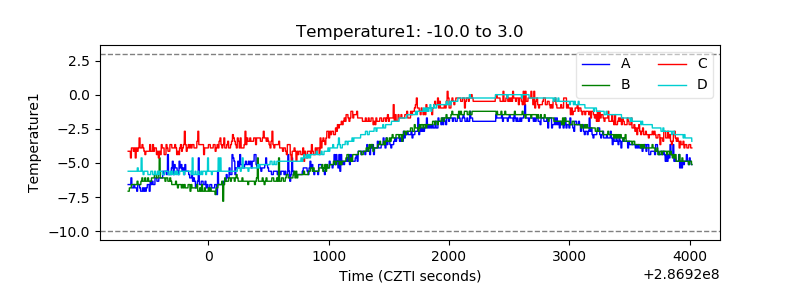 |
| Veto HV Monitor | 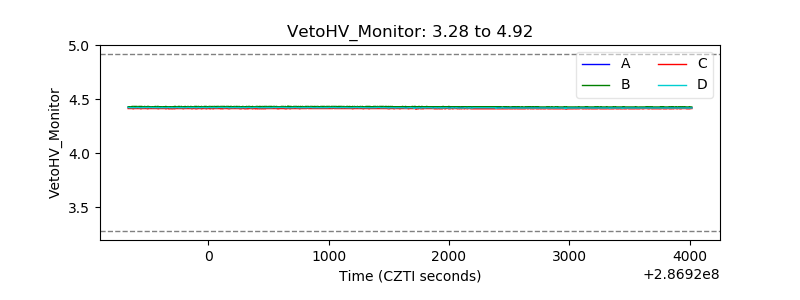 |
| Veto LLD | 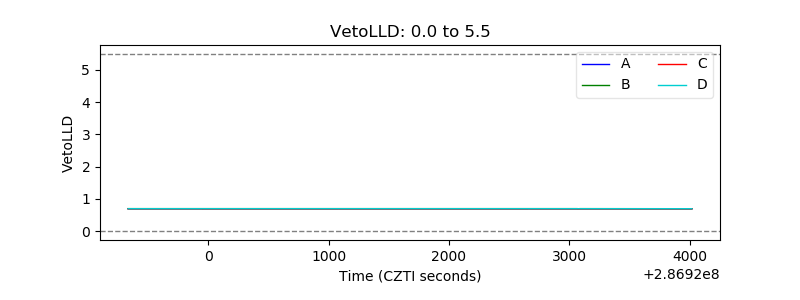 |
| Alpha Counter | 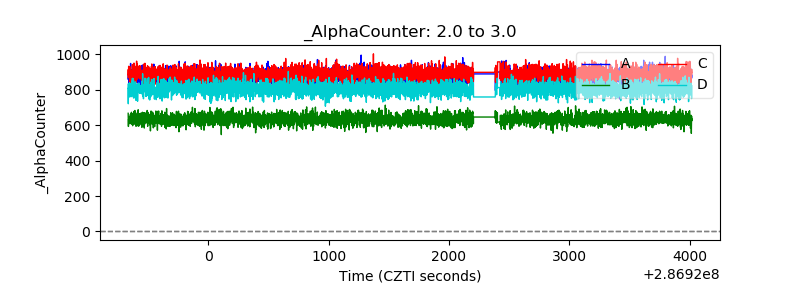 |
| _CPM_Rate |  |
| CZT Counter | 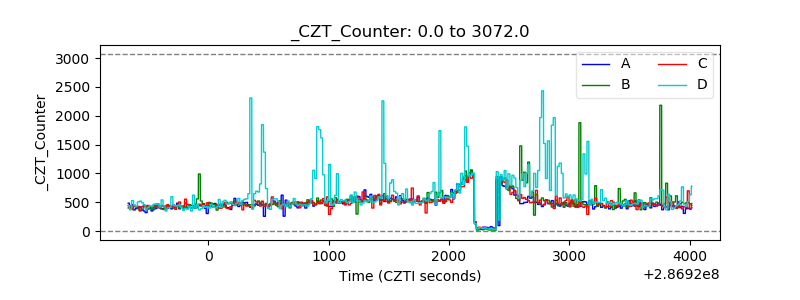 |
| +2.5 Volts monitor | 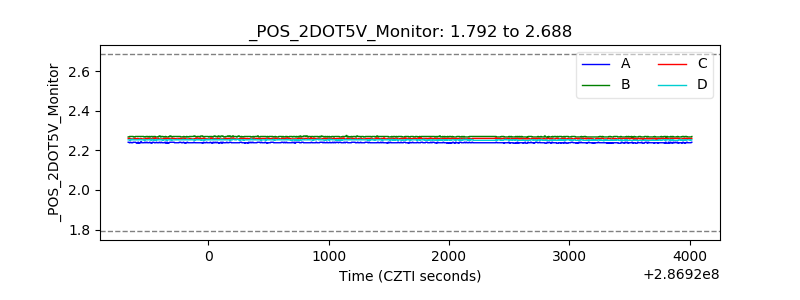 |
| +5 Volts monitor |  |
| _ROLL_ROT | 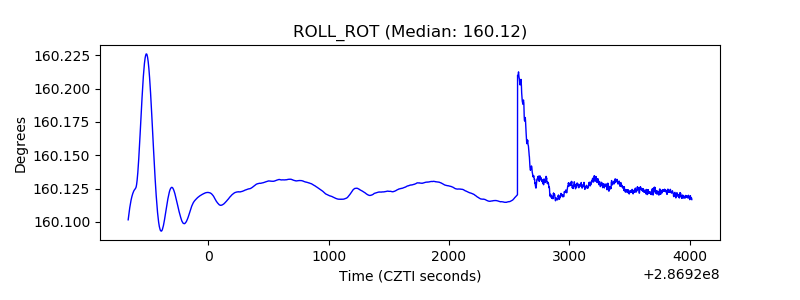 |
| _Roll_DEC | 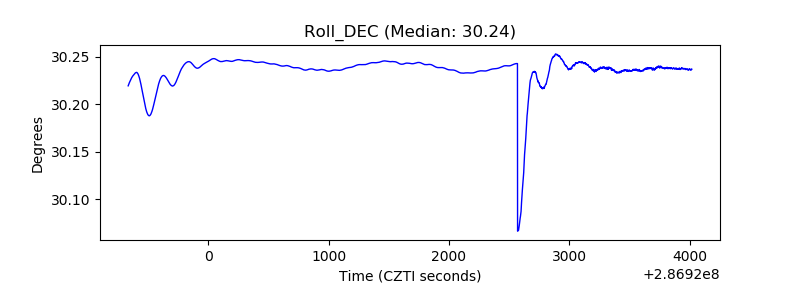 |
| _Roll_RA | 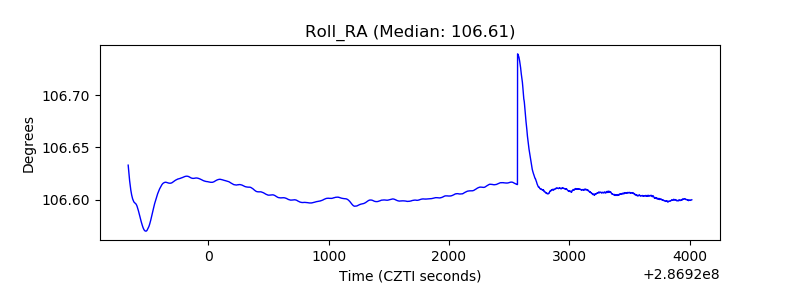 |
| Veto Counter | 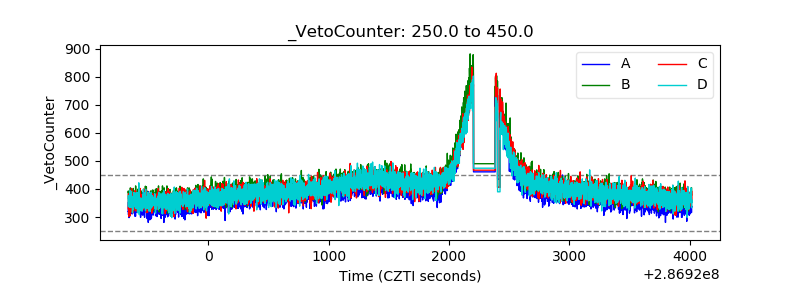 |