| Param | Original file | Final file |
|---|---|---|
| Filename | modeM0/AS1A05_186T01_9000002692_18128cztM0_level2.evt | modeM0/AS1A05_186T01_9000002692_18128cztM0_level2_quad_clean.evt |
| Size (bytes) | 407,439,360 | 69,511,680 |
| Size | 388.6 MB | 66.3 MB |
| Events in quadrant A | 2,645,307 | 440,504 |
| Events in quadrant B | 2,833,237 | 444,350 |
| Events in quadrant C | 2,675,801 | 421,399 |
| Events in quadrant D | 3,802,727 | 405,427 |
| Mode SS | |||
|---|---|---|---|
| Quadrant | BADHDUFLAG | Total packets | Discarded packets |
| A | 0 | 116 | 0 |
| B | 0 | 116 | 0 |
| C | 0 | 116 | 0 |
| D | 0 | 116 | 0 |
| Mode M0 | |||
|---|---|---|---|
| Quadrant | BADHDUFLAG | Total packets | Discarded packets |
| A | 0 | 11725 | 3 |
| B | 0 | 12212 | 2 |
| C | 0 | 11689 | 2 |
| D | 0 | 15011 | 2 |
| Mode M9 | |||
|---|---|---|---|
| Quadrant | BADHDUFLAG | Total packets | Discarded packets |
| A | 0 | 1 | 0 |
| B | 0 | 1 | 0 |
| C | 0 | 1 | 0 |
| D | 0 | 1 | 0 |
| Quadrant | Total seconds | Saturated seconds | Saturation percentage |
|---|---|---|---|
| A | 5612 | 102 | 1.817534% |
| B | 5612 | 128 | 2.280827% |
| C | 5613 | 102 | 1.817210% |
| D | 5613 | 234 | 4.168894% |
Noise dominated data is calculated using 1-second bins in cleaned event files. If a bin has >2000 counts, and if more than 50% of those come from <1% of pixels, then it is considered to be noise-dominated and hence unusable.
| Quadrant | # 1 sec bins | Bins with >0 counts | Bins with >2000 counts | High rate bins dominated by noise | Noise dominated (total time) | Noise dominated (detector-on time) | Marked lightcurve |
|---|---|---|---|---|---|---|---|
| A | 5812 | 5614 | 0 | 0 | 0.00% | 0.00% | 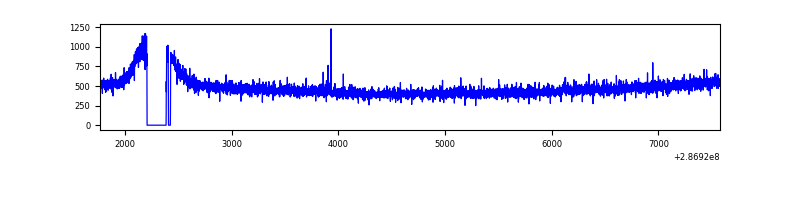 |
| B | 5812 | 5614 | 9 | 9 | 0.15% | 0.16% | 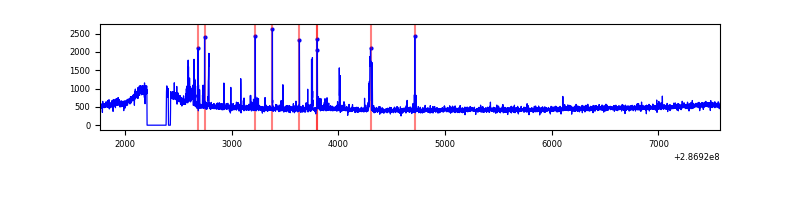 |
| C | 5813 | 5615 | 0 | 0 | 0.00% | 0.00% | 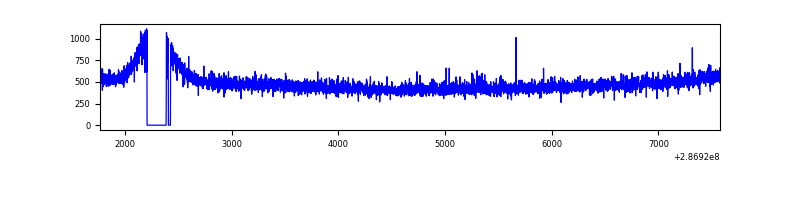 |
| D | 5813 | 5615 | 163 | 163 | 2.80% | 2.90% | 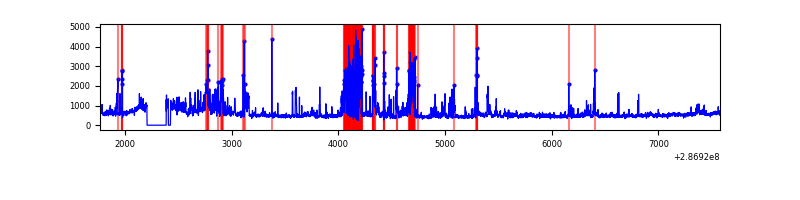 |
Top three noisy pixels from each quadrant. If the there are fewer than three noisy pixels in the level2.evt file, extra rows are filled as -1
| Pixel properties | Quadrant properties | ||||||
|---|---|---|---|---|---|---|---|
| Quadrant | DetID | PixID | Counts | Sigma | Mean | Median | Sigma |
| A | 15 | 174 | 7457 | 48.24 | 685 | 670 | 140.7 |
| A | 4 | 2 | 6040 | 38.17 | 685 | 670 | 140.7 |
| A | 0 | 226 | 5883 | 37.05 | 685 | 670 | 140.7 |
| B | 7 | 220 | 44961 | 331.52 | 681 | 661 | 133.6 |
| B | 4 | 216 | 29720 | 217.46 | 681 | 661 | 133.6 |
| B | 6 | 36 | 29330 | 214.55 | 681 | 661 | 133.6 |
| C | 14 | 238 | 100008 | 641.5 | 651 | 655 | 154.9 |
| C | 8 | 128 | 9745 | 58.69 | 651 | 655 | 154.9 |
| C | 0 | 207 | 8427 | 50.18 | 651 | 655 | 154.9 |
| D | 11 | 176 | 743112 | 4567.57 | 656 | 637 | 162.6 |
| D | 7 | 238 | 283976 | 1743.05 | 656 | 637 | 162.6 |
| D | 9 | 64 | 130207 | 797.09 | 656 | 637 | 162.6 |
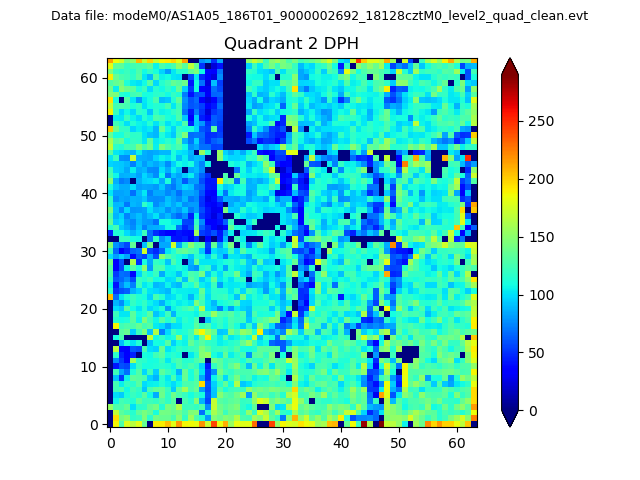
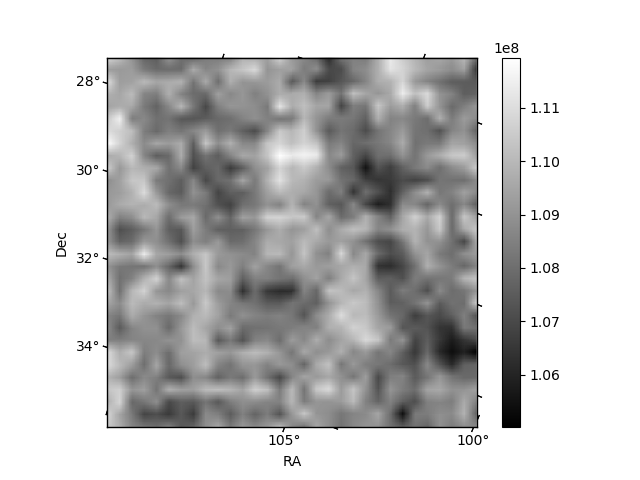
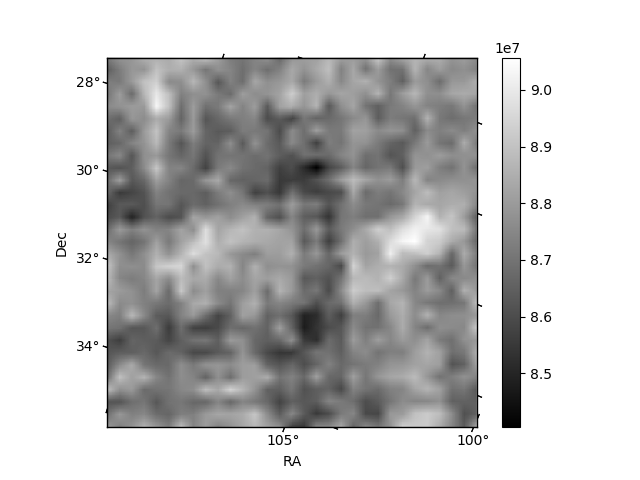
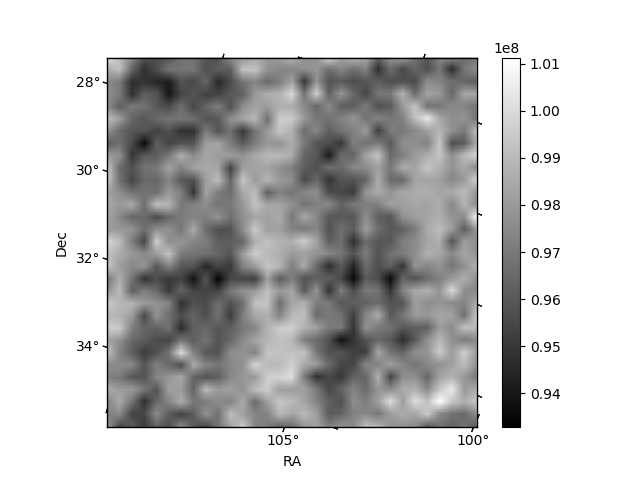
Histogram calculated using DETX and DETY for each event in the final _common_clean file
| Quadrant A | 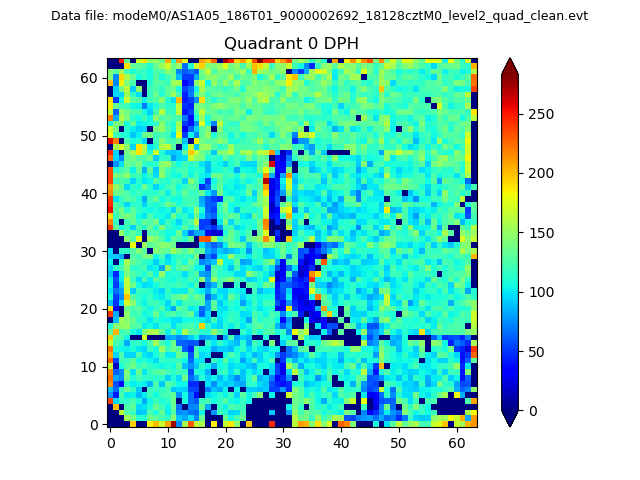 |
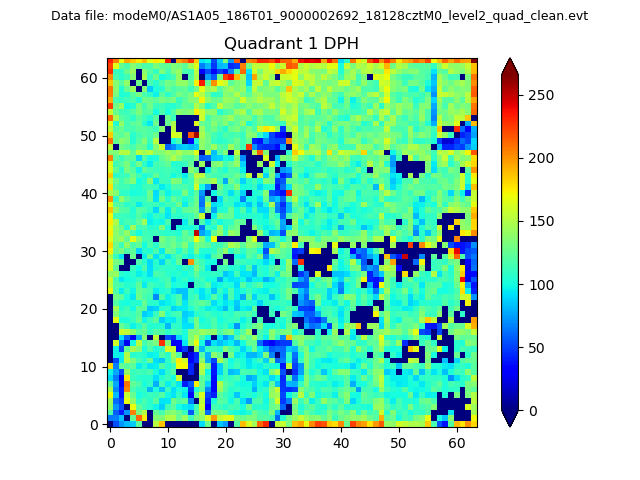 |
Quadrant B |
|---|---|---|---|
| Quadrant D | 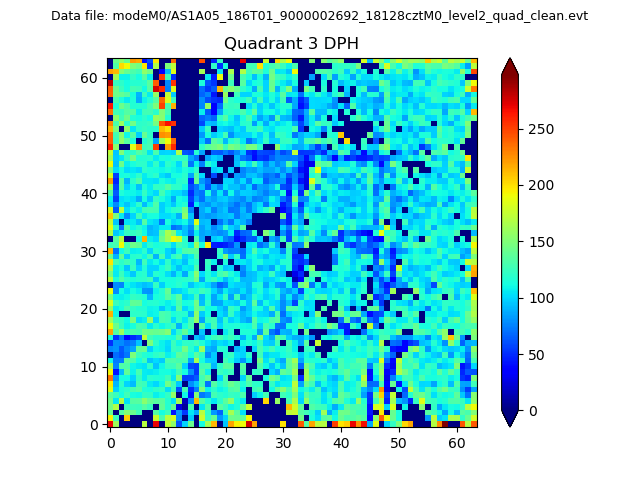 |
 |
Quadrant C |
| Plot type | Count rate plots | Images |
|---|---|---|
| Comparison with Poisson distribution Blue bars denote a histogram of data divided into 1 sec bins. Red curve is a Poisson curve with rate = median count rate of data. |
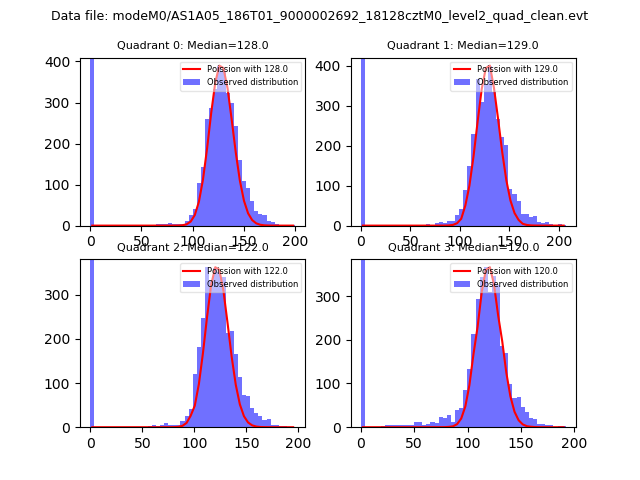 |
 |
| Quadrant-wise count rates Data is divided into 100 sec bins |
 |
|
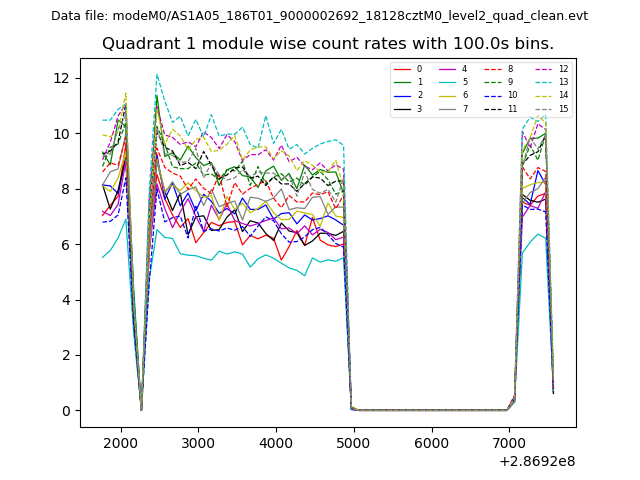
| Module-wise count rates for Quadrant A Data is divided into 100 sec bins |
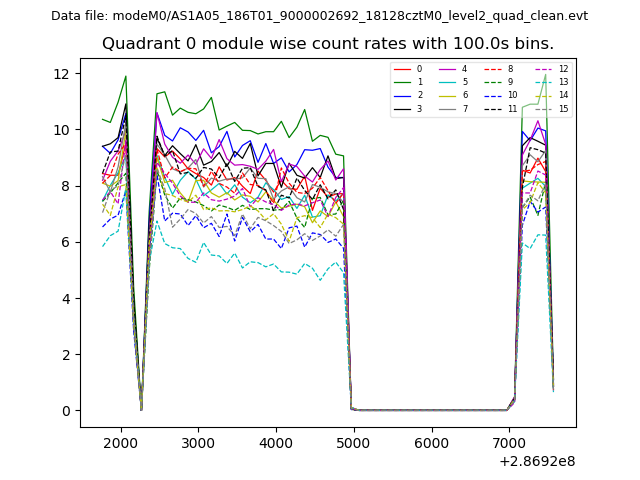 |
 |
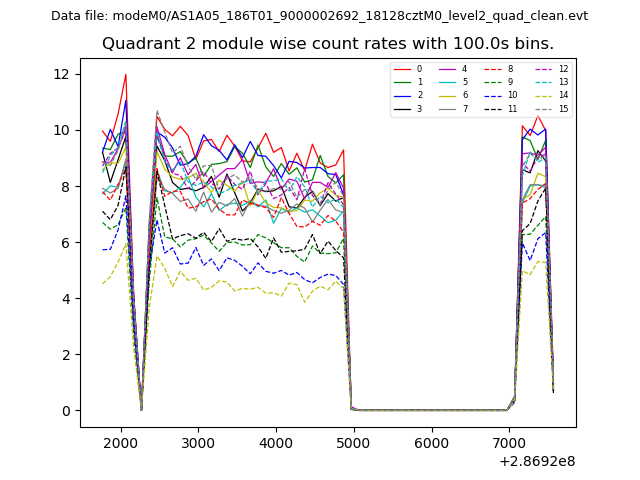
| Module-wise count rates for Quadrant B Data is divided into 100 sec bins |
 |
 |
| Module-wise count rates for Quadrant C Data is divided into 100 sec bins |
 |
 |
| Module-wise count rates for Quadrant D Data is divided into 100 sec bins |
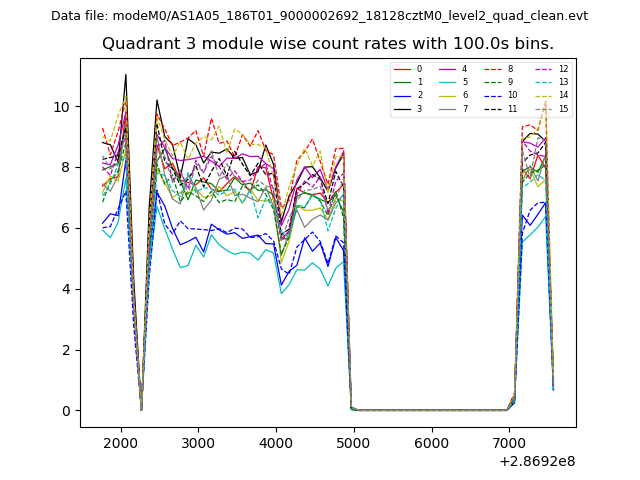 |
 |
| Parameter | Plot |
|---|---|
| CZT HV Monitor | 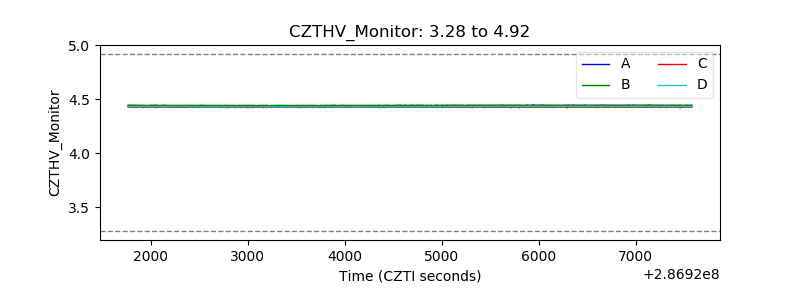 |
| D_VDD | 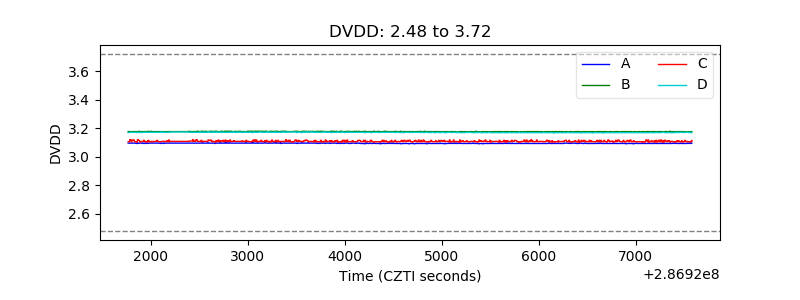 |
| Temperature 1 | 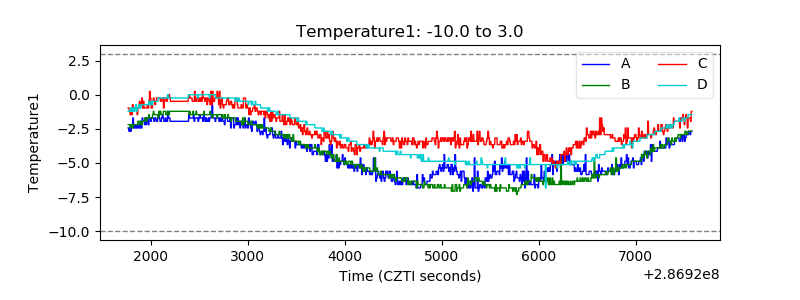 |
| Veto HV Monitor |  |
| Veto LLD | 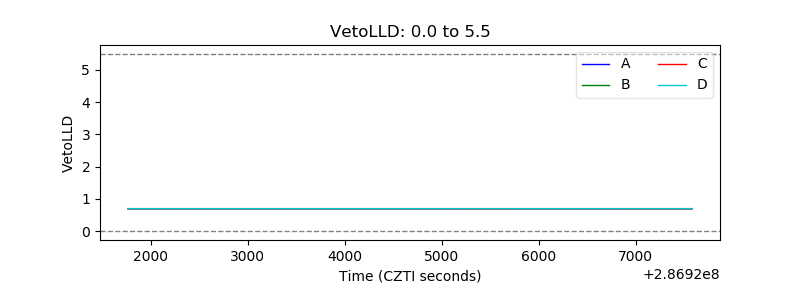 |
| Alpha Counter | 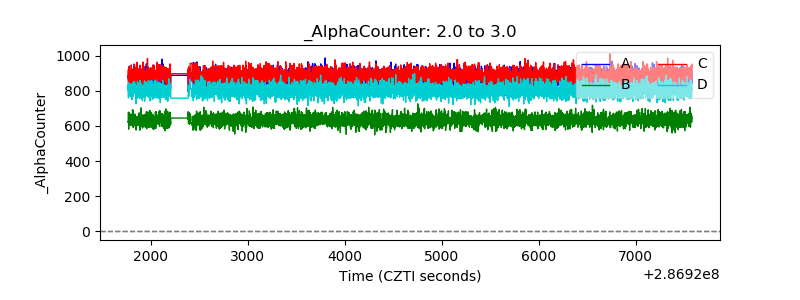 |
| _CPM_Rate | 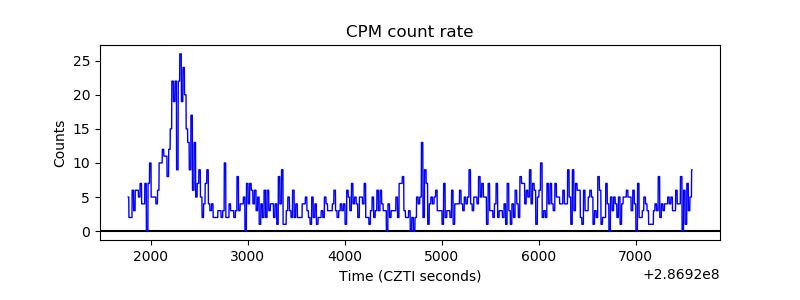 |
| CZT Counter | 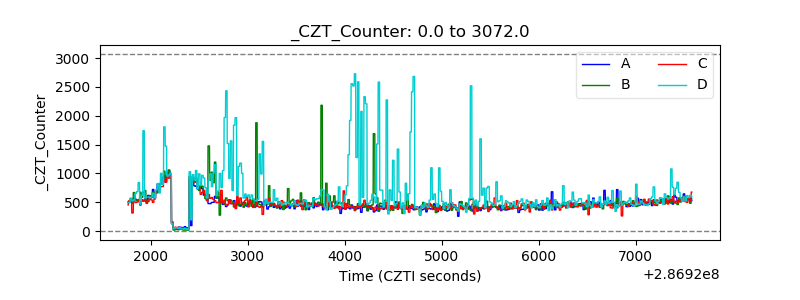 |
| +2.5 Volts monitor | 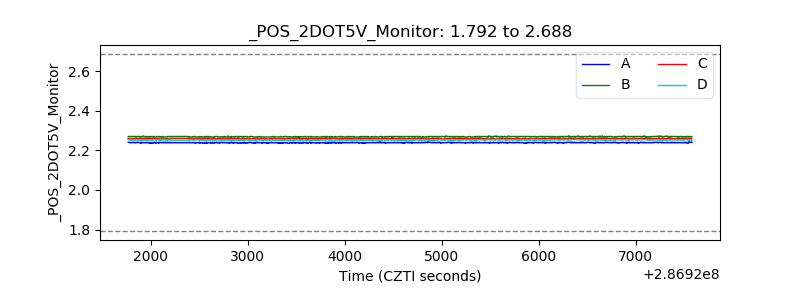 |
| +5 Volts monitor |  |
| _ROLL_ROT | 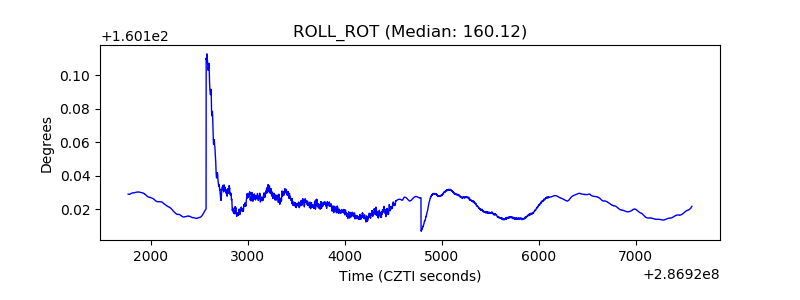 |
| _Roll_DEC | 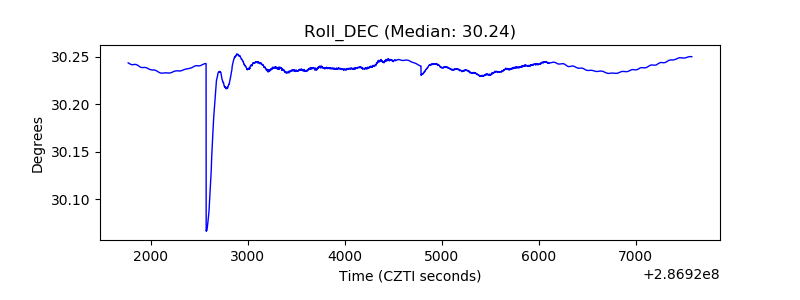 |
| _Roll_RA | 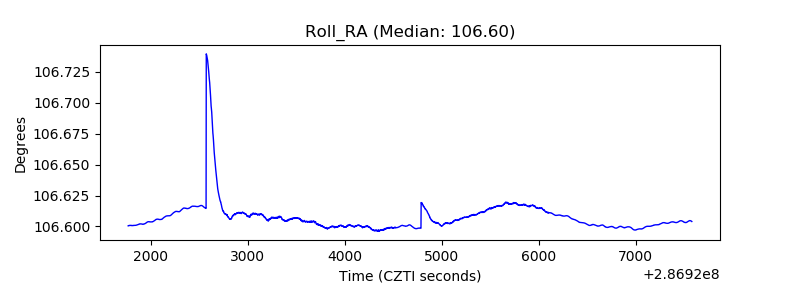 |
| Veto Counter | 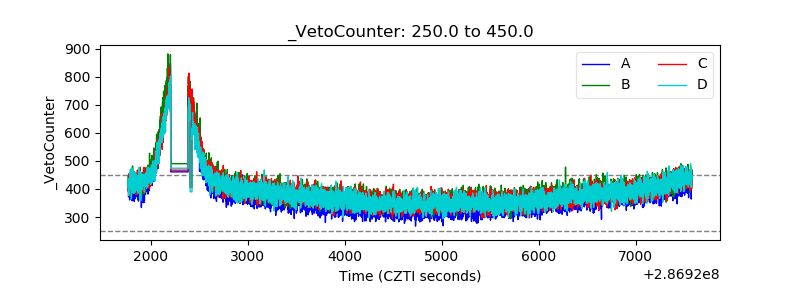 |