| Param | Original file | Final file |
|---|---|---|
| Filename | modeM0/AS1A05_186T01_9000002692_18130cztM0_level2.evt | modeM0/AS1A05_186T01_9000002692_18130cztM0_level2_quad_clean.evt |
| Size (bytes) | 955,635,840 | 177,618,240 |
| Size | 911.4 MB | 169.4 MB |
| Events in quadrant A | 6,389,614 | 1,139,608 |
| Events in quadrant B | 6,752,736 | 1,153,795 |
| Events in quadrant C | 6,415,983 | 1,098,467 |
| Events in quadrant D | 8,463,454 | 1,048,723 |
| Mode SS | |||
|---|---|---|---|
| Quadrant | BADHDUFLAG | Total packets | Discarded packets |
| A | 0 | 278 | 0 |
| B | 0 | 278 | 0 |
| C | 0 | 278 | 0 |
| D | 0 | 278 | 0 |
| Mode M0 | |||
|---|---|---|---|
| Quadrant | BADHDUFLAG | Total packets | Discarded packets |
| A | 0 | 27999 | 3 |
| B | 0 | 28954 | 3 |
| C | 0 | 27906 | 3 |
| D | 0 | 34272 | 3 |
| Mode M9 | |||
|---|---|---|---|
| Quadrant | BADHDUFLAG | Total packets | Discarded packets |
| A | 0 | 19 | 0 |
| B | 0 | 19 | 0 |
| C | 0 | 19 | 0 |
| D | 0 | 19 | 0 |
| Quadrant | Total seconds | Saturated seconds | Saturation percentage |
|---|---|---|---|
| A | 13588 | 57 | 0.419488% |
| B | 13589 | 114 | 0.838914% |
| C | 13589 | 138 | 1.015527% |
| D | 13589 | 485 | 3.569063% |
Noise dominated data is calculated using 1-second bins in cleaned event files. If a bin has >2000 counts, and if more than 50% of those come from <1% of pixels, then it is considered to be noise-dominated and hence unusable.
| Quadrant | # 1 sec bins | Bins with >0 counts | Bins with >2000 counts | High rate bins dominated by noise | Noise dominated (total time) | Noise dominated (detector-on time) | Marked lightcurve |
|---|---|---|---|---|---|---|---|
| A | 15498 | 13591 | 0 | 0 | 0.00% | 0.00% | 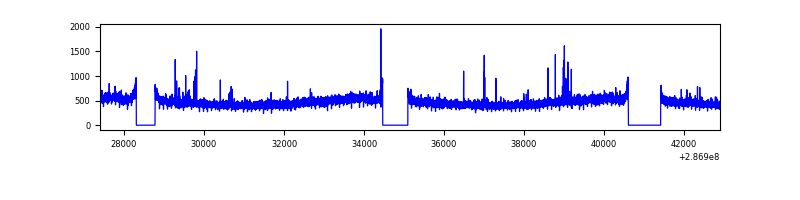 |
| B | 15499 | 13592 | 14 | 14 | 0.09% | 0.10% | 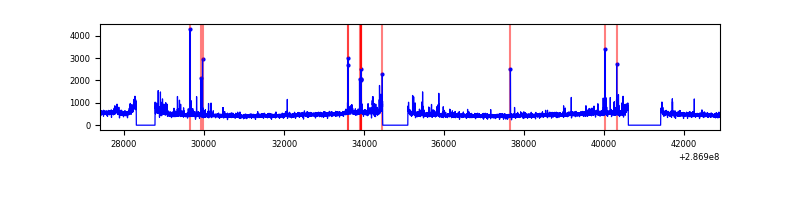 |
| C | 15499 | 13592 | 0 | 0 | 0.00% | 0.00% | 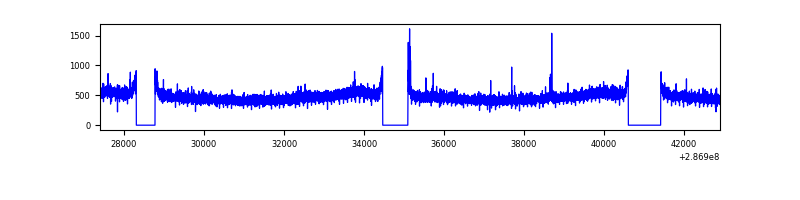 |
| D | 15499 | 13592 | 348 | 348 | 2.25% | 2.56% | 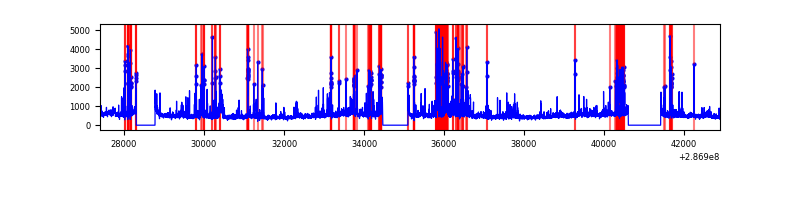 |
Top three noisy pixels from each quadrant. If the there are fewer than three noisy pixels in the level2.evt file, extra rows are filled as -1
| Pixel properties | Quadrant properties | ||||||
|---|---|---|---|---|---|---|---|
| Quadrant | DetID | PixID | Counts | Sigma | Mean | Median | Sigma |
| A | 15 | 174 | 90432 | 266.9 | 1637 | 1603 | 332.8 |
| A | 0 | 226 | 14254 | 38.01 | 1637 | 1603 | 332.8 |
| A | 3 | 137 | 12514 | 32.78 | 1637 | 1603 | 332.8 |
| B | 0 | 189 | 100979 | 319.26 | 1635 | 1593 | 311.3 |
| B | 7 | 220 | 58121 | 181.59 | 1635 | 1593 | 311.3 |
| B | 4 | 171 | 44401 | 137.51 | 1635 | 1593 | 311.3 |
| C | 14 | 238 | 241044 | 648.0 | 1569 | 1575 | 369.6 |
| C | 0 | 207 | 31025 | 79.69 | 1569 | 1575 | 369.6 |
| C | 5 | 218 | 20778 | 51.96 | 1569 | 1575 | 369.6 |
| D | 11 | 176 | 961530 | 2476.95 | 1572 | 1525 | 387.6 |
| D | 7 | 238 | 470907 | 1211.07 | 1572 | 1525 | 387.6 |
| D | 13 | 104 | 288053 | 739.28 | 1572 | 1525 | 387.6 |
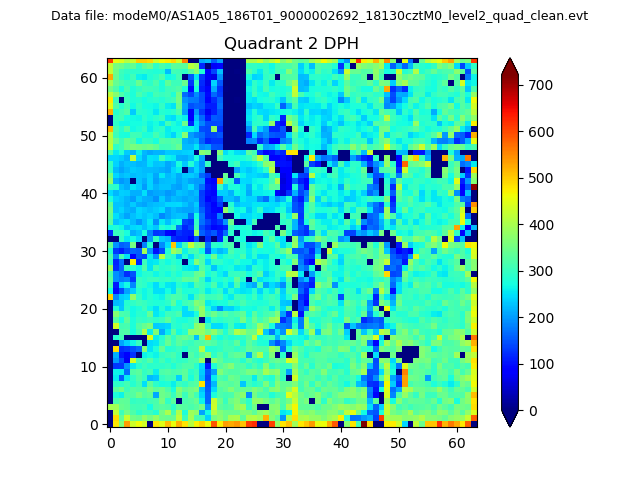
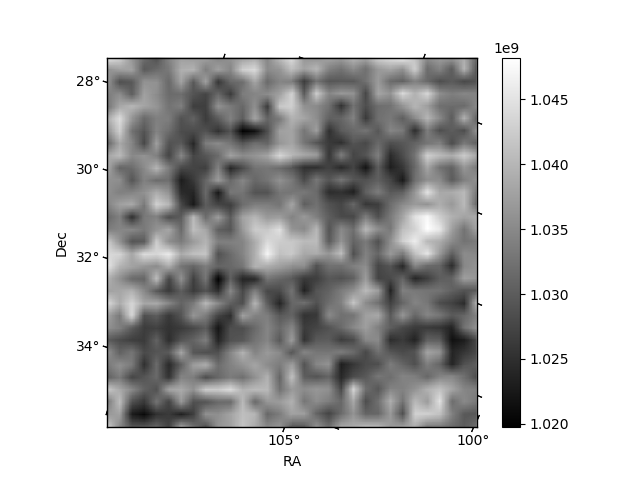
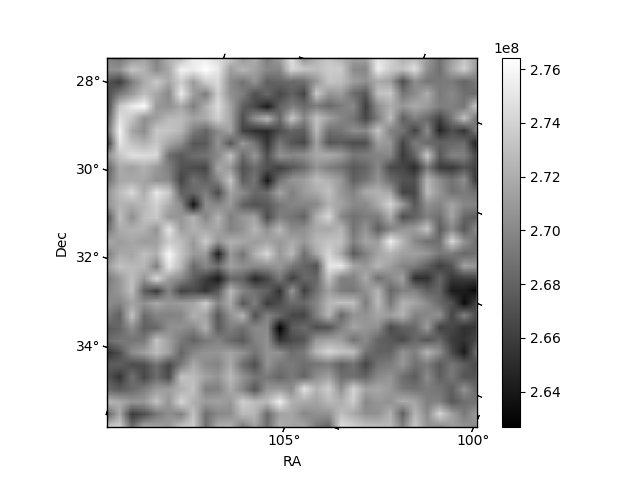
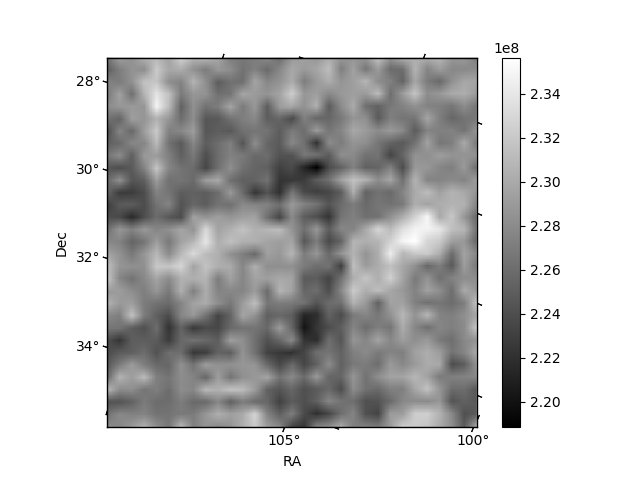
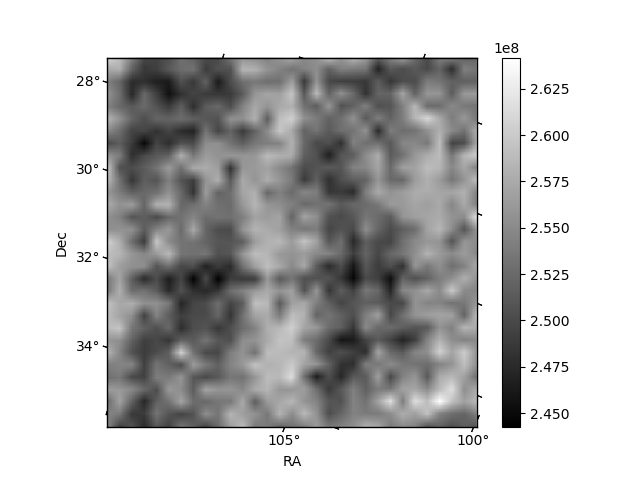
Histogram calculated using DETX and DETY for each event in the final _common_clean file
| Quadrant A | 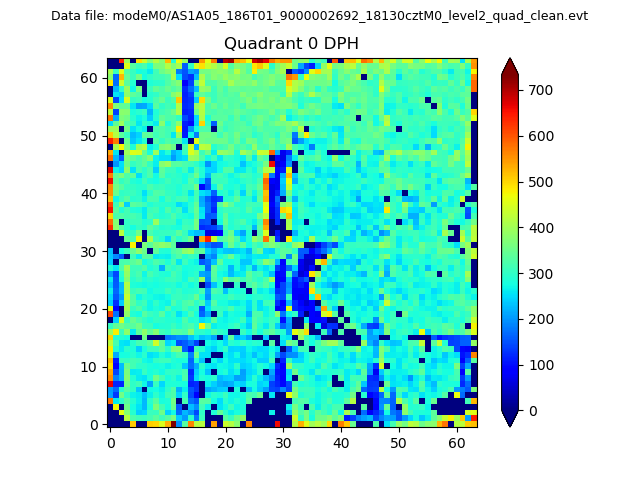 |
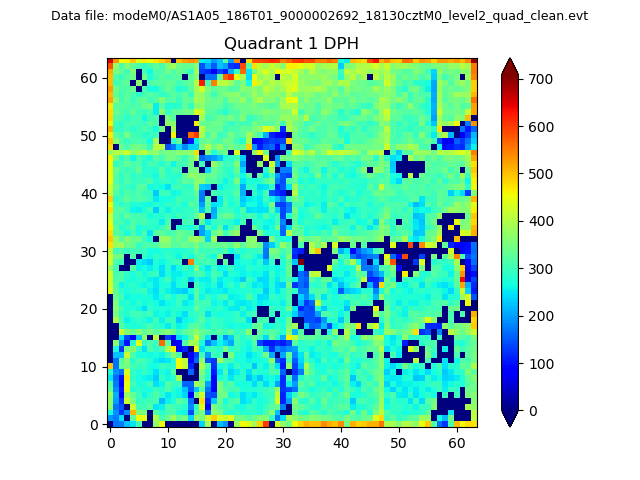 |
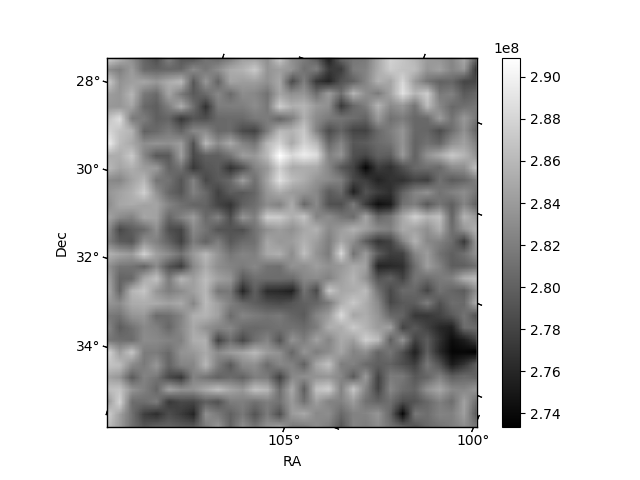
Quadrant B |
|---|---|---|---|
| Quadrant D | 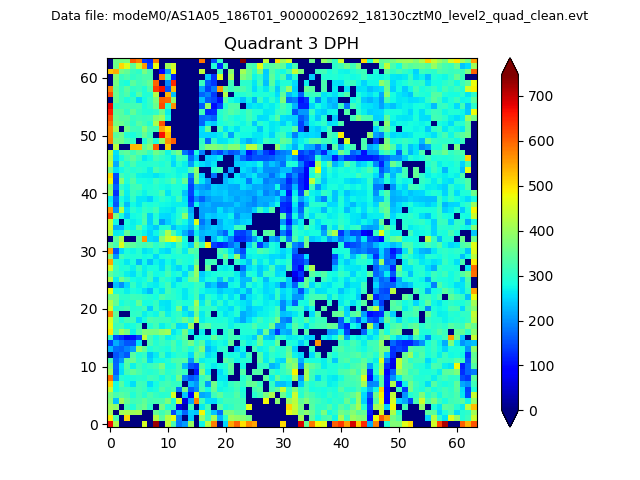 |
 |
Quadrant C |
| Plot type | Count rate plots | Images |
|---|---|---|
| Comparison with Poisson distribution Blue bars denote a histogram of data divided into 1 sec bins. Red curve is a Poisson curve with rate = median count rate of data. |
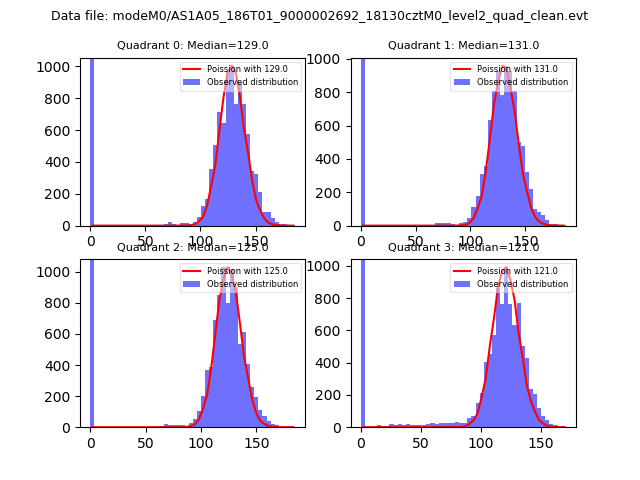 |
 |
| Quadrant-wise count rates Data is divided into 100 sec bins |
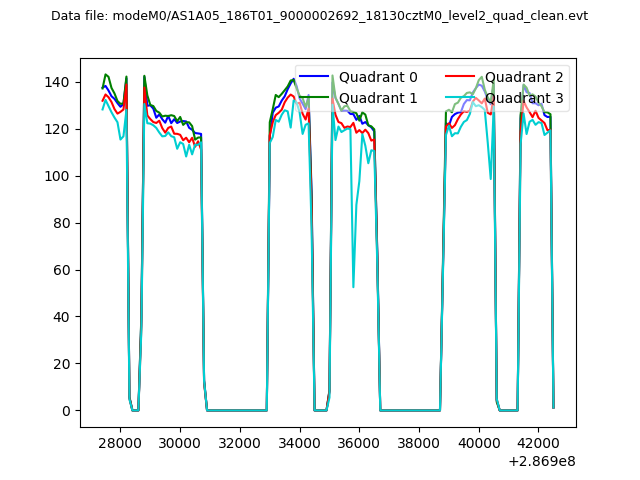 |
|
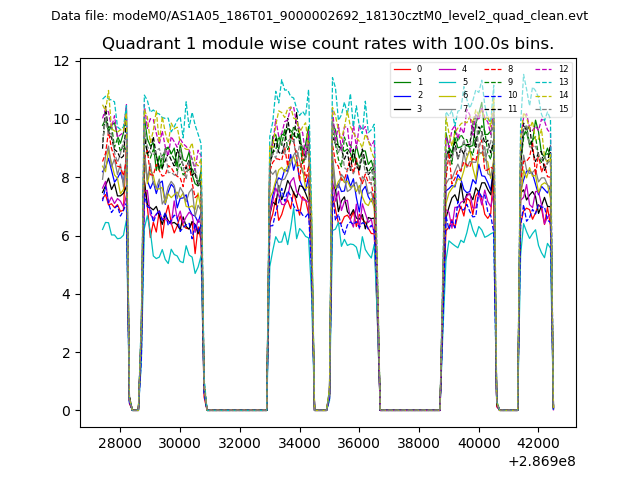
| Module-wise count rates for Quadrant A Data is divided into 100 sec bins |
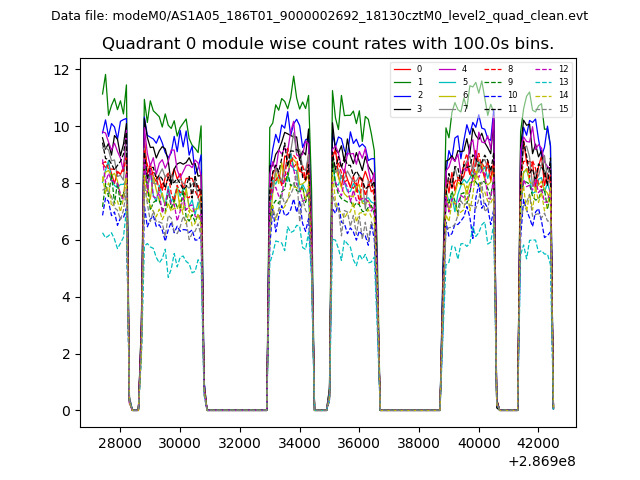 |
 |
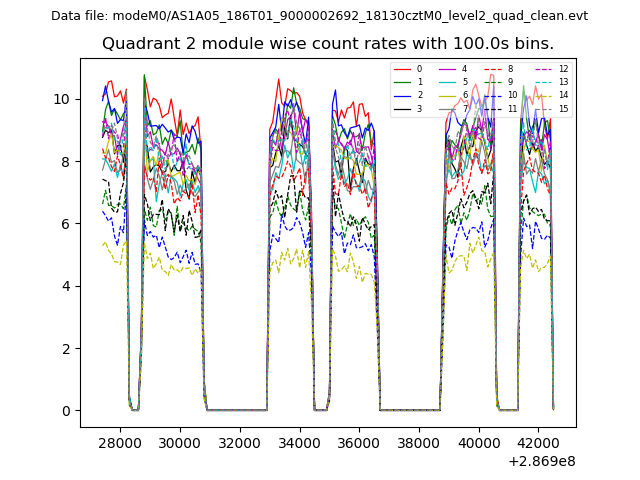
| Module-wise count rates for Quadrant B Data is divided into 100 sec bins |
 |
 |
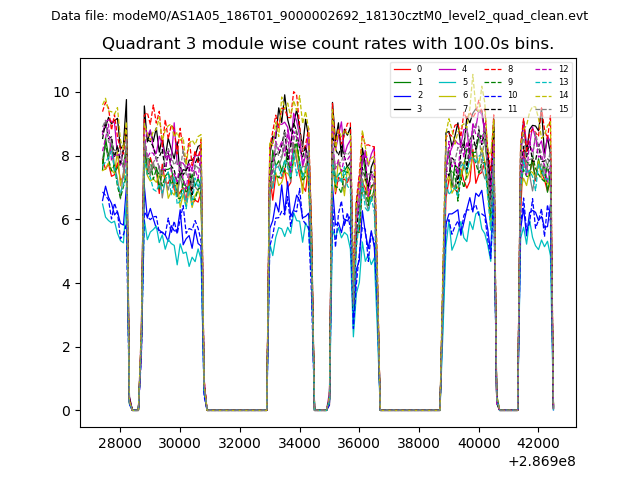
| Module-wise count rates for Quadrant C Data is divided into 100 sec bins |
 |
 |
| Module-wise count rates for Quadrant D Data is divided into 100 sec bins |
 |
 |
| Parameter | Plot |
|---|---|
| CZT HV Monitor | 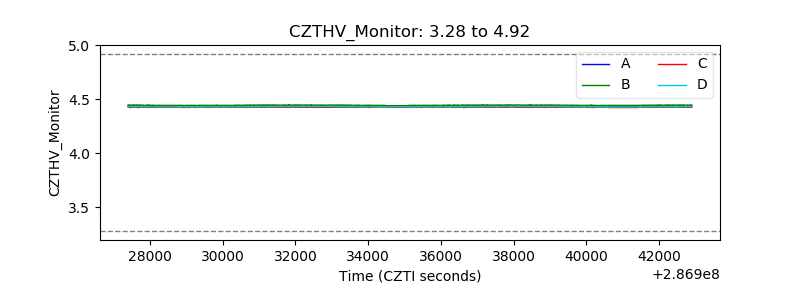 |
| D_VDD | 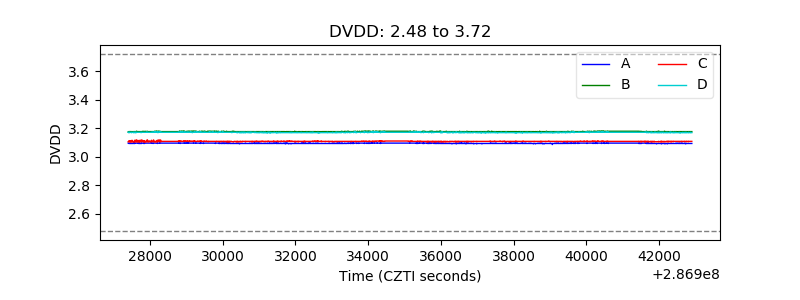 |
| Temperature 1 | 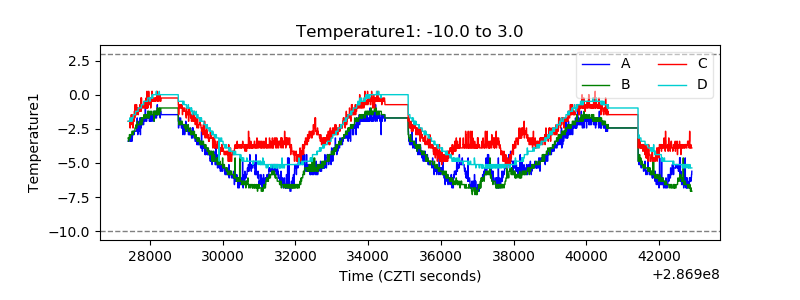 |
| Veto HV Monitor | 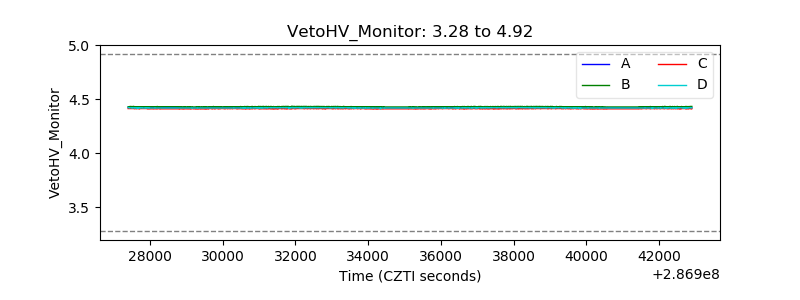 |
| Veto LLD | 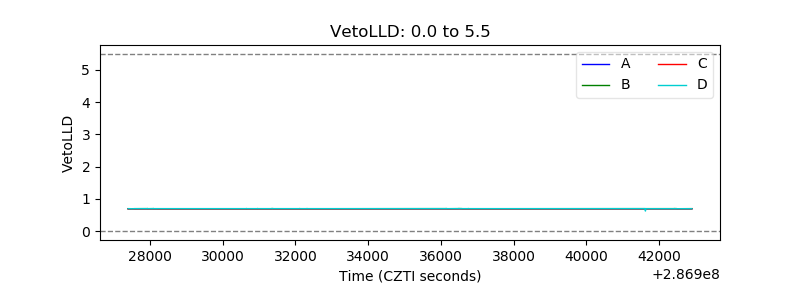 |
| Alpha Counter | 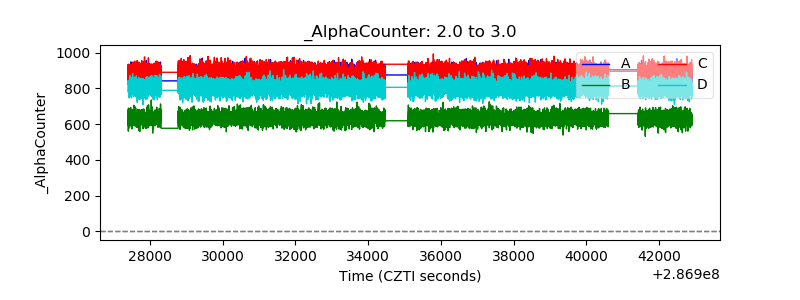 |
| _CPM_Rate | 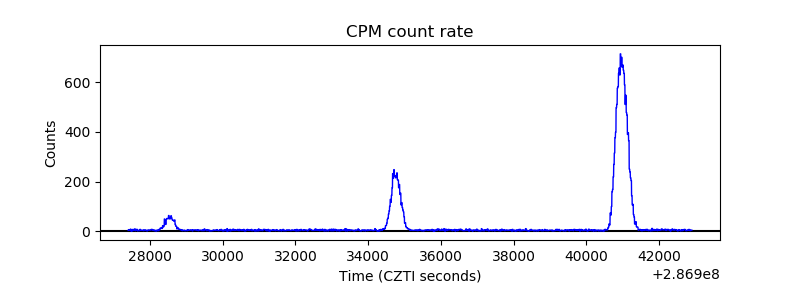 |
| CZT Counter | 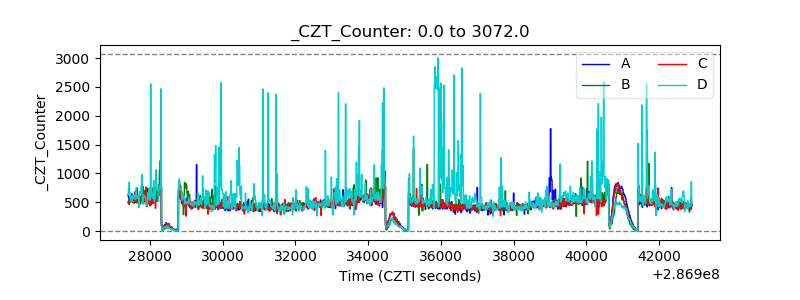 |
| +2.5 Volts monitor | 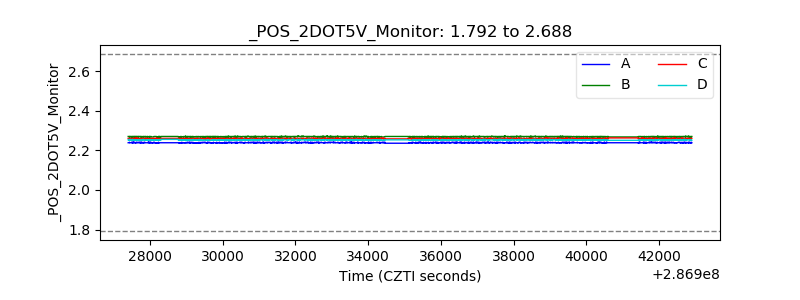 |
| +5 Volts monitor | 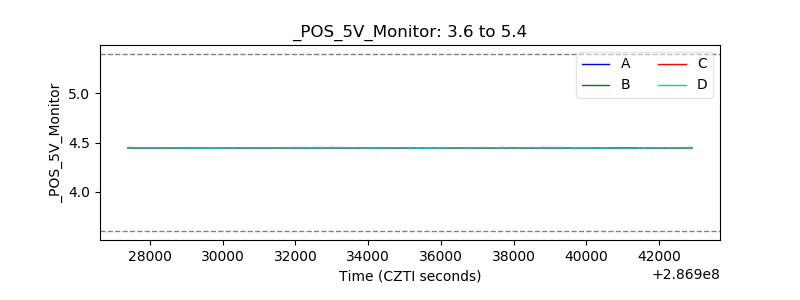 |
| _ROLL_ROT |  |
| _Roll_DEC |  |
| _Roll_RA | 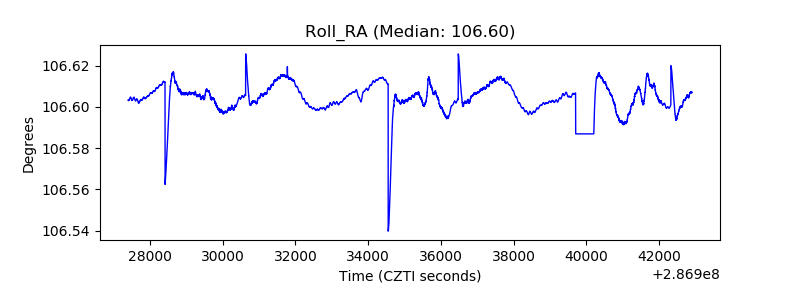 |
| Veto Counter | 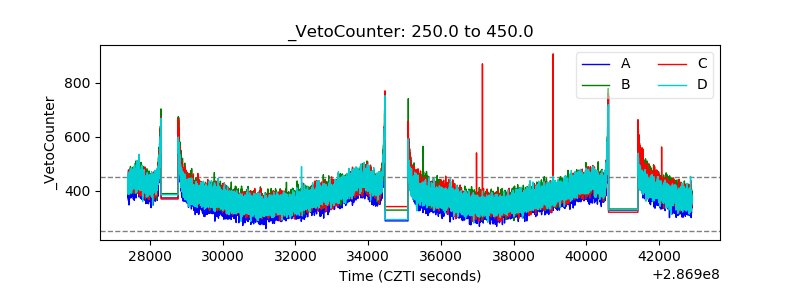 |