| Param | Original file | Final file |
|---|---|---|
| Filename | modeM0/AS1A05_186T01_9000002692_18131cztM0_level2.evt | modeM0/AS1A05_186T01_9000002692_18131cztM0_level2_quad_clean.evt |
| Size (bytes) | 451,085,760 | 80,461,440 |
| Size | 430.2 MB | 76.7 MB |
| Events in quadrant A | 3,109,014 | 504,721 |
| Events in quadrant B | 3,236,938 | 512,957 |
| Events in quadrant C | 3,148,752 | 484,678 |
| Events in quadrant D | 3,712,655 | 468,604 |
| Mode SS | |||
|---|---|---|---|
| Quadrant | BADHDUFLAG | Total packets | Discarded packets |
| A | 0 | 134 | 0 |
| B | 0 | 134 | 0 |
| C | 0 | 134 | 0 |
| D | 0 | 134 | 0 |
| Mode M0 | |||
|---|---|---|---|
| Quadrant | BADHDUFLAG | Total packets | Discarded packets |
| A | 0 | 13586 | 2 |
| B | 0 | 13849 | 2 |
| C | 0 | 13620 | 2 |
| D | 0 | 15525 | 3 |
| Mode M9 | |||
|---|---|---|---|
| Quadrant | BADHDUFLAG | Total packets | Discarded packets |
| A | 0 | 13 | 0 |
| B | 0 | 14 | 0 |
| C | 0 | 14 | 0 |
| D | 0 | 14 | 0 |
| Quadrant | Total seconds | Saturated seconds | Saturation percentage |
|---|---|---|---|
| A | 6683 | 18 | 0.269340% |
| B | 6683 | 29 | 0.433937% |
| C | 6683 | 46 | 0.688314% |
| D | 6682 | 91 | 1.361868% |
Noise dominated data is calculated using 1-second bins in cleaned event files. If a bin has >2000 counts, and if more than 50% of those come from <1% of pixels, then it is considered to be noise-dominated and hence unusable.
| Quadrant | # 1 sec bins | Bins with >0 counts | Bins with >2000 counts | High rate bins dominated by noise | Noise dominated (total time) | Noise dominated (detector-on time) | Marked lightcurve |
|---|---|---|---|---|---|---|---|
| A | 7663 | 6684 | 2 | 2 | 0.03% | 0.03% | 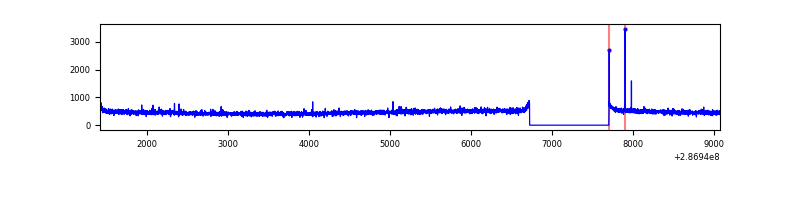 |
| B | 7663 | 6684 | 0 | 0 | 0.00% | 0.00% | 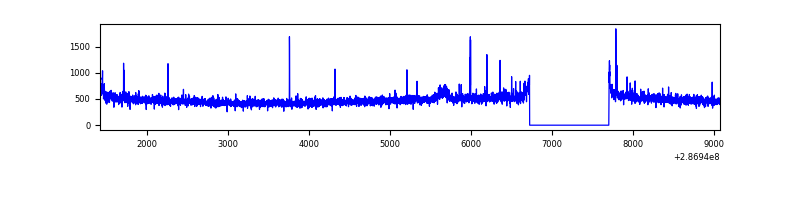 |
| C | 7663 | 6684 | 0 | 0 | 0.00% | 0.00% | 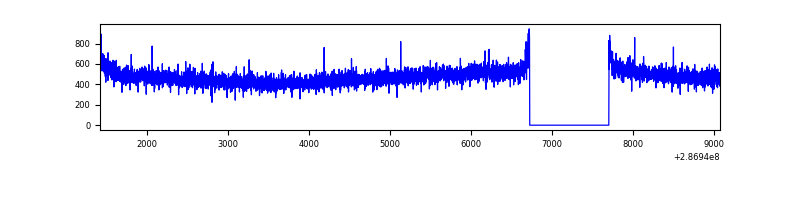 |
| D | 7662 | 6683 | 69 | 69 | 0.90% | 1.03% | 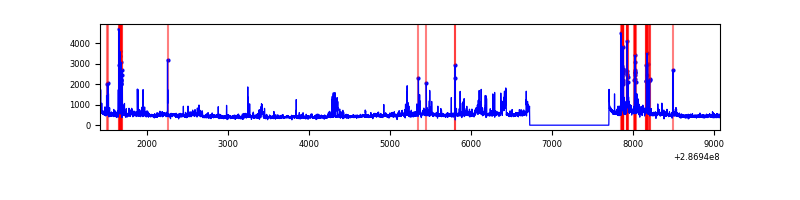 |
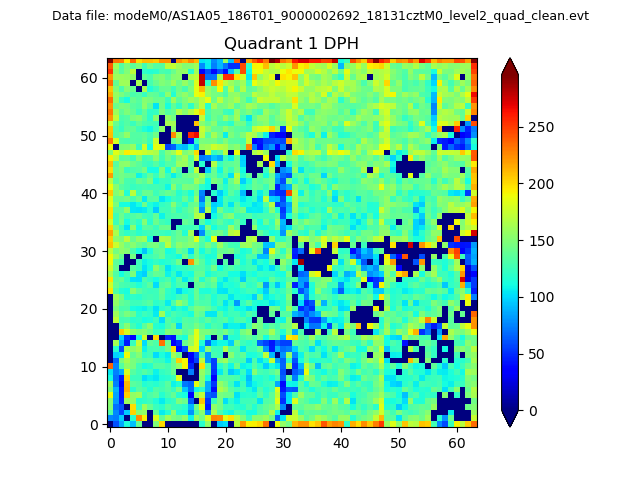
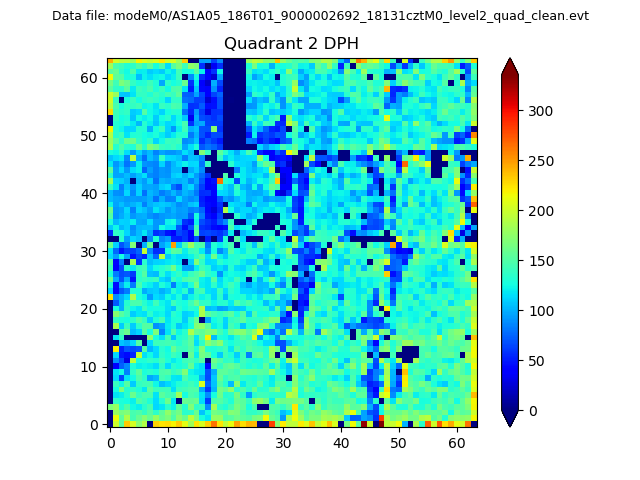
Top three noisy pixels from each quadrant. If the there are fewer than three noisy pixels in the level2.evt file, extra rows are filled as -1
| Pixel properties | Quadrant properties | ||||||
|---|---|---|---|---|---|---|---|
| Quadrant | DetID | PixID | Counts | Sigma | Mean | Median | Sigma |
| A | 4 | 2 | 11894 | 67.27 | 806 | 788 | 165.1 |
| A | 0 | 226 | 6879 | 36.9 | 806 | 788 | 165.1 |
| A | 3 | 137 | 5952 | 31.28 | 806 | 788 | 165.1 |
| B | 0 | 189 | 31714 | 197.8 | 809 | 789 | 156.3 |
| B | 12 | 111 | 18711 | 114.63 | 809 | 789 | 156.3 |
| B | 7 | 220 | 16961 | 103.44 | 809 | 789 | 156.3 |
| C | 14 | 238 | 120171 | 654.6 | 772 | 775 | 182.4 |
| C | 0 | 207 | 12806 | 65.96 | 772 | 775 | 182.4 |
| C | 3 | 233 | 7688 | 37.9 | 772 | 775 | 182.4 |
| D | 11 | 176 | 359849 | 1881.1 | 776 | 754 | 190.9 |
| D | 7 | 238 | 206661 | 1078.63 | 776 | 754 | 190.9 |
| D | 10 | 70 | 66958 | 346.81 | 776 | 754 | 190.9 |
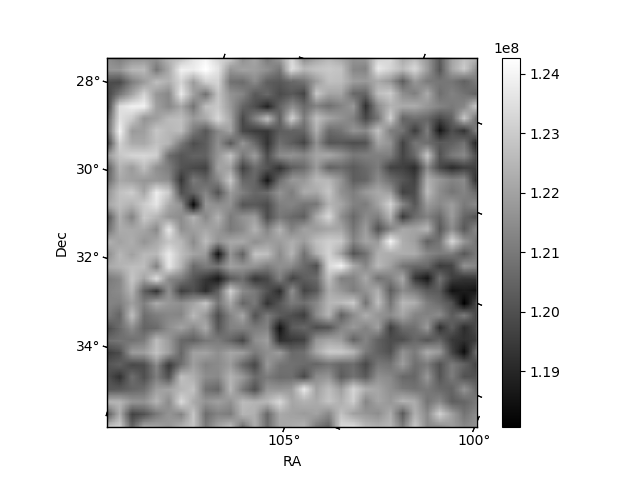
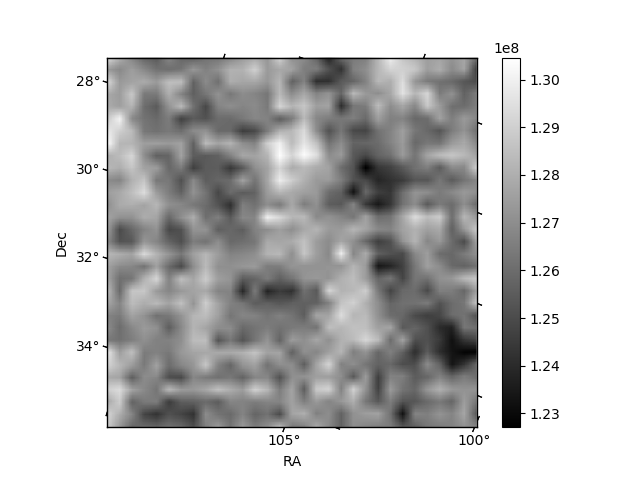
Histogram calculated using DETX and DETY for each event in the final _common_clean file
| Quadrant A | 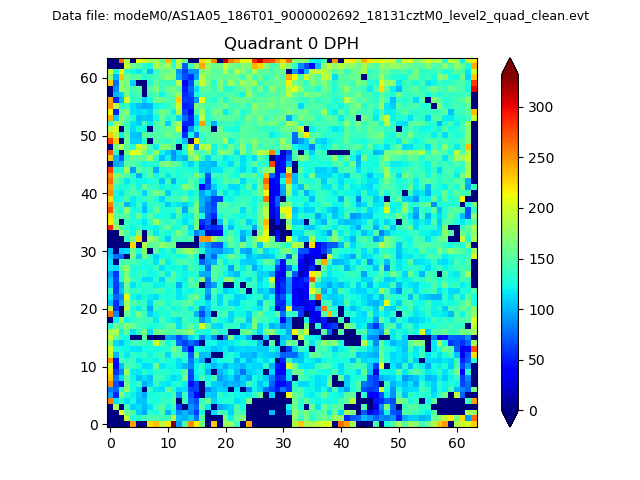 |
 |
Quadrant B |
|---|---|---|---|
| Quadrant D | 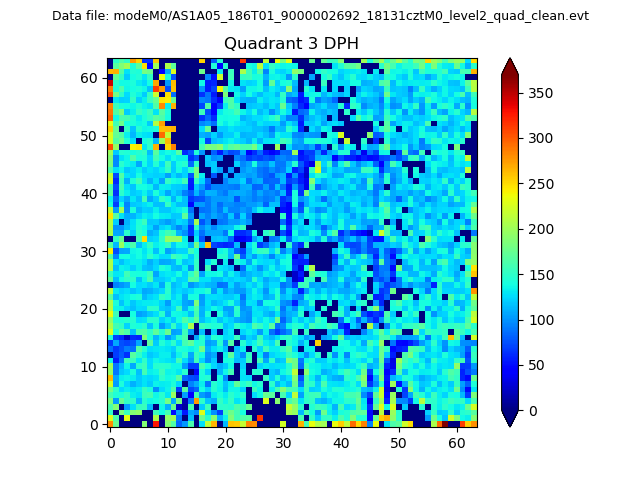 |
 |
Quadrant C |
| Plot type | Count rate plots | Images |
|---|---|---|
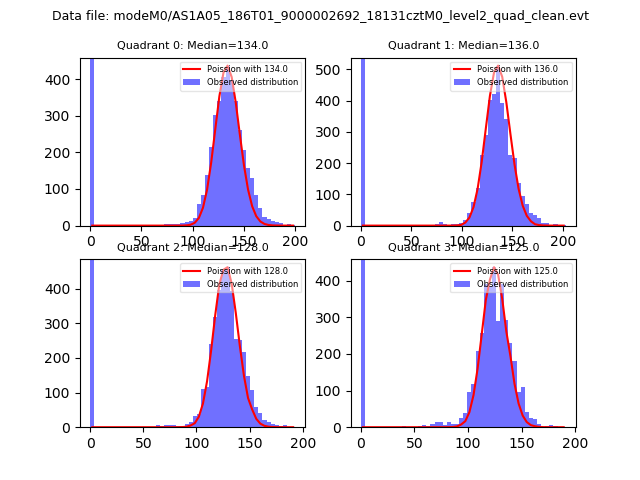
| Comparison with Poisson distribution Blue bars denote a histogram of data divided into 1 sec bins. Red curve is a Poisson curve with rate = median count rate of data. |
 |
 |
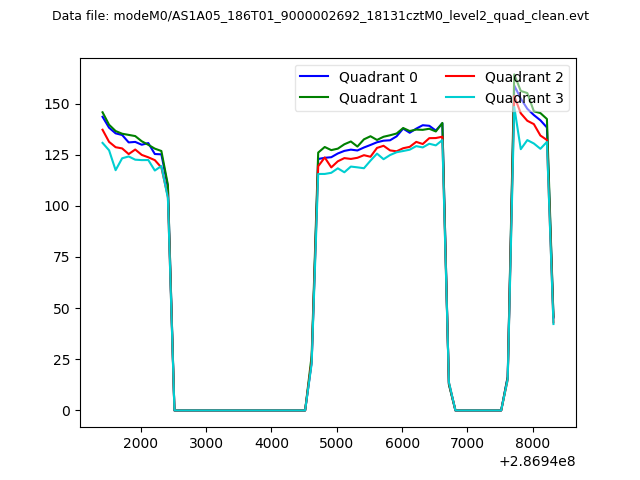
| Quadrant-wise count rates Data is divided into 100 sec bins |
 |
|
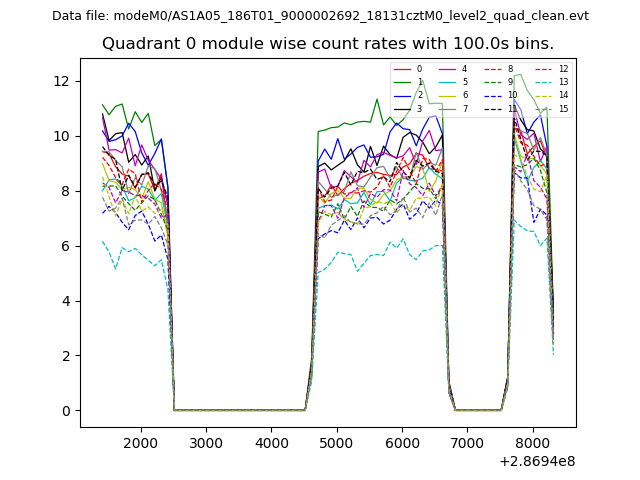
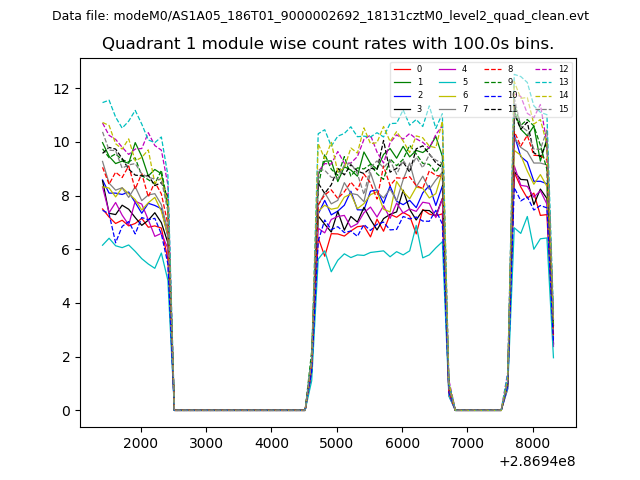
| Module-wise count rates for Quadrant A Data is divided into 100 sec bins |
 |
 |
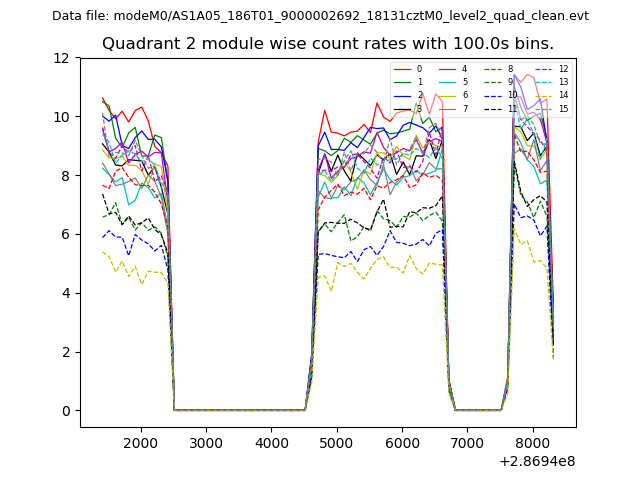
| Module-wise count rates for Quadrant B Data is divided into 100 sec bins |
 |
 |
| Module-wise count rates for Quadrant C Data is divided into 100 sec bins |
 |
 |
| Module-wise count rates for Quadrant D Data is divided into 100 sec bins |
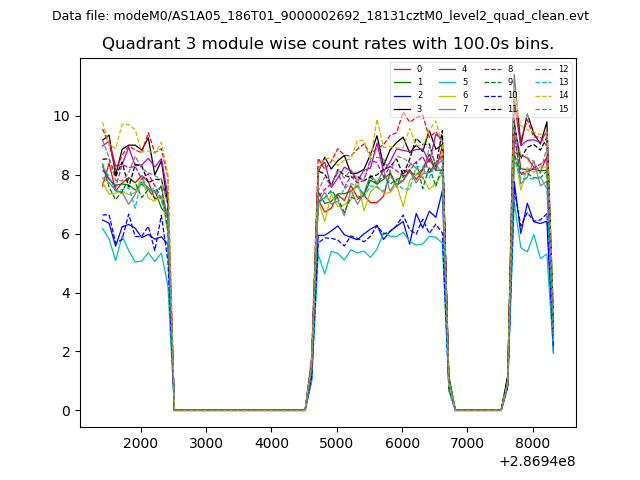 |
 |
| Parameter | Plot |
|---|---|
| CZT HV Monitor | 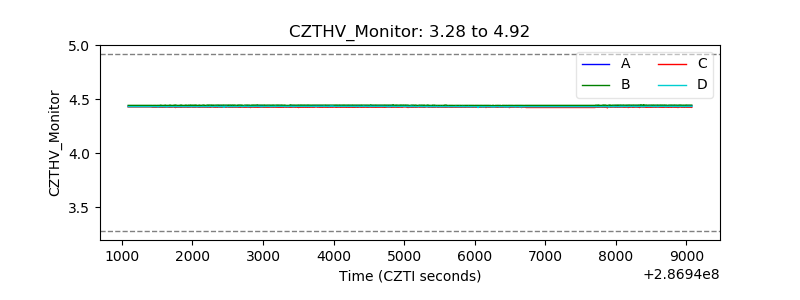 |
| D_VDD | 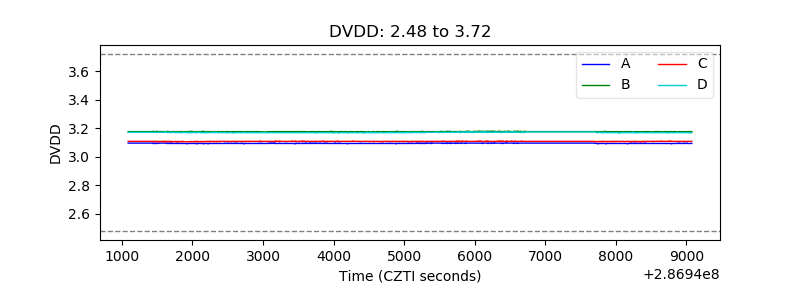 |
| Temperature 1 | 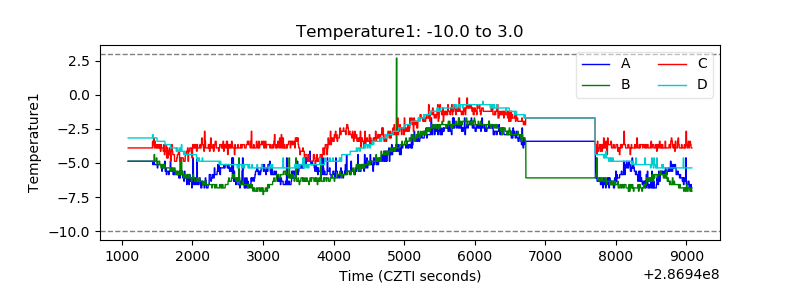 |
| Veto HV Monitor |  |
| Veto LLD | 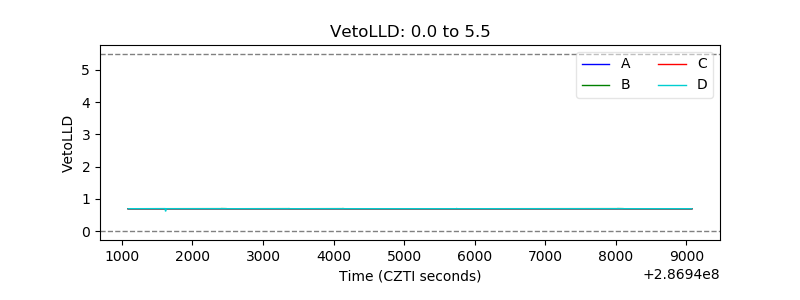 |
| Alpha Counter | 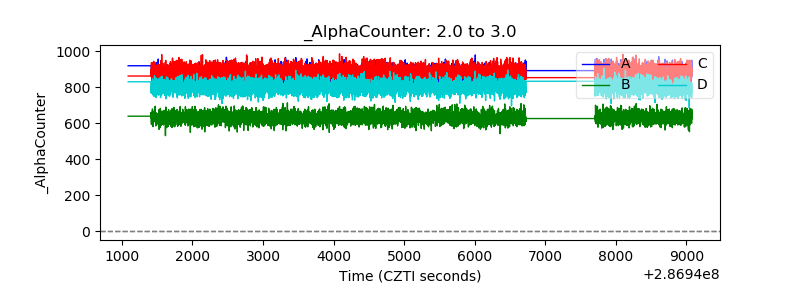 |
| _CPM_Rate | 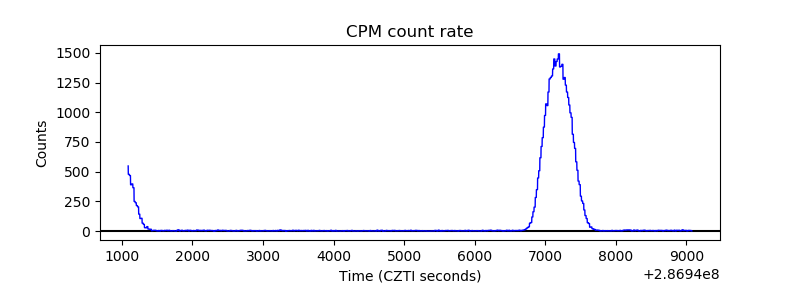 |
| CZT Counter | 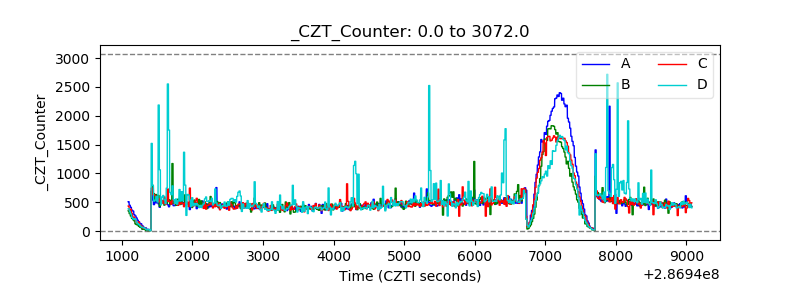 |
| +2.5 Volts monitor | 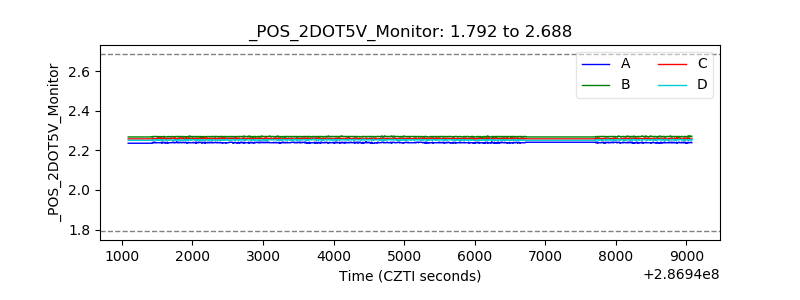 |
| +5 Volts monitor |  |
| _ROLL_ROT | 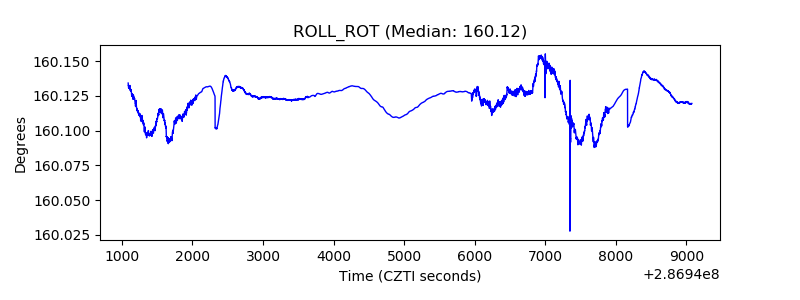 |
| _Roll_DEC | 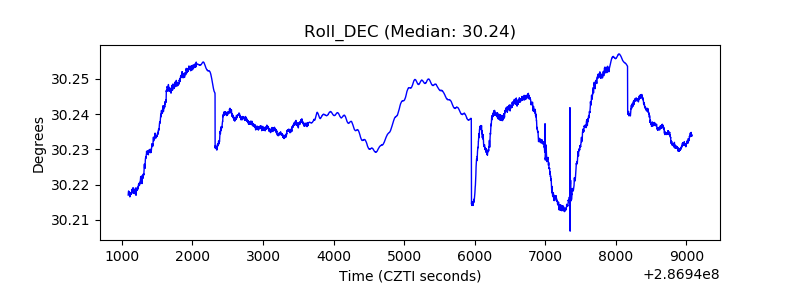 |
| _Roll_RA | 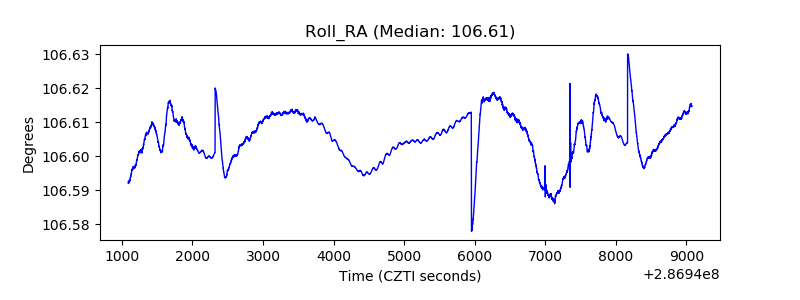 |
| Veto Counter | 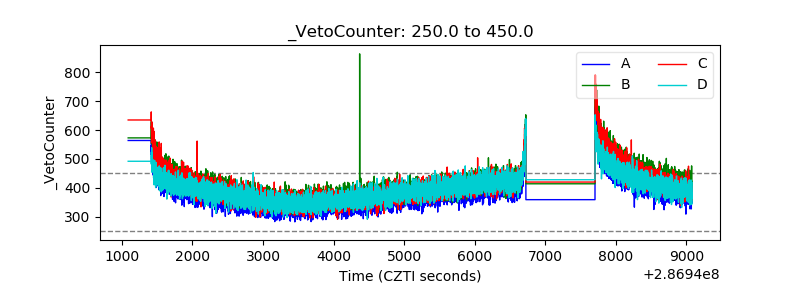 |