| Param | Original file | Final file |
|---|---|---|
| Filename | modeM0/AS1A05_186T01_9000002692_18133cztM0_level2.evt | modeM0/AS1A05_186T01_9000002692_18133cztM0_level2_quad_clean.evt |
| Size (bytes) | 503,930,880 | 76,475,520 |
| Size | 480.6 MB | 72.9 MB |
| Events in quadrant A | 3,370,702 | 470,667 |
| Events in quadrant B | 3,519,573 | 478,358 |
| Events in quadrant C | 3,398,221 | 450,913 |
| Events in quadrant D | 4,502,832 | 432,871 |
| Mode SS | |||
|---|---|---|---|
| Quadrant | BADHDUFLAG | Total packets | Discarded packets |
| A | 0 | 142 | 0 |
| B | 0 | 142 | 0 |
| C | 0 | 142 | 0 |
| D | 0 | 142 | 0 |
| Mode M0 | |||
|---|---|---|---|
| Quadrant | BADHDUFLAG | Total packets | Discarded packets |
| A | 0 | 14309 | 2 |
| B | 0 | 14673 | 2 |
| C | 0 | 14369 | 2 |
| D | 0 | 18137 | 3 |
| Mode M9 | |||
|---|---|---|---|
| Quadrant | BADHDUFLAG | Total packets | Discarded packets |
| A | 0 | 21 | 0 |
| B | 0 | 21 | 0 |
| C | 0 | 21 | 0 |
| D | 0 | 21 | 0 |
| Quadrant | Total seconds | Saturated seconds | Saturation percentage |
|---|---|---|---|
| A | 6933 | 47 | 0.677917% |
| B | 6933 | 63 | 0.908698% |
| C | 6933 | 66 | 0.951969% |
| D | 6933 | 148 | 2.134718% |
Noise dominated data is calculated using 1-second bins in cleaned event files. If a bin has >2000 counts, and if more than 50% of those come from <1% of pixels, then it is considered to be noise-dominated and hence unusable.
| Quadrant | # 1 sec bins | Bins with >0 counts | Bins with >2000 counts | High rate bins dominated by noise | Noise dominated (total time) | Noise dominated (detector-on time) | Marked lightcurve |
|---|---|---|---|---|---|---|---|
| A | 9018 | 6935 | 2 | 2 | 0.02% | 0.03% | 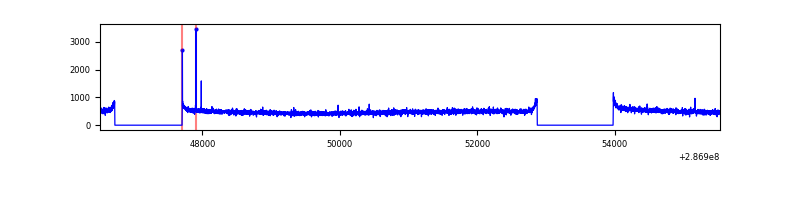 |
| B | 9018 | 6935 | 2 | 2 | 0.02% | 0.03% | 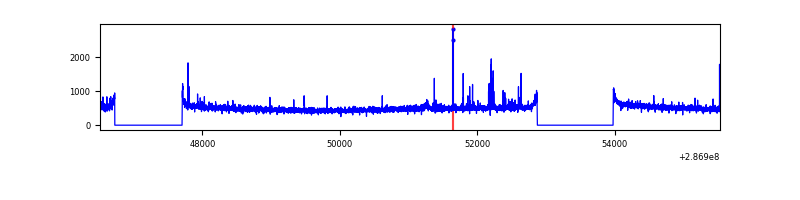 |
| C | 9018 | 6935 | 1 | 1 | 0.01% | 0.01% | 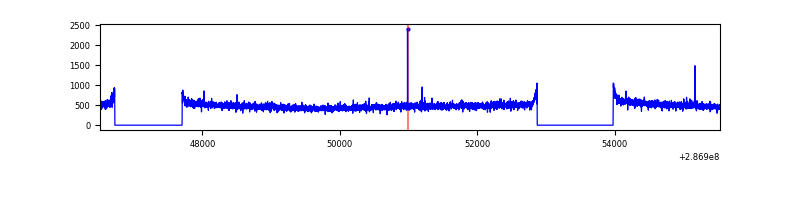 |
| D | 9018 | 6935 | 86 | 86 | 0.95% | 1.24% | 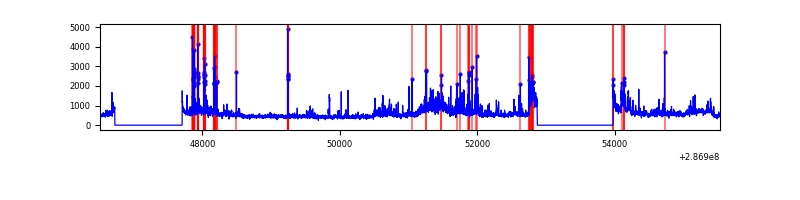 |
Top three noisy pixels from each quadrant. If the there are fewer than three noisy pixels in the level2.evt file, extra rows are filled as -1
| Pixel properties | Quadrant properties | ||||||
|---|---|---|---|---|---|---|---|
| Quadrant | DetID | PixID | Counts | Sigma | Mean | Median | Sigma |
| A | 4 | 2 | 12384 | 64.83 | 874 | 857 | 177.8 |
| A | 0 | 226 | 7491 | 37.31 | 874 | 857 | 177.8 |
| A | 3 | 137 | 6246 | 30.31 | 874 | 857 | 177.8 |
| B | 7 | 220 | 44845 | 263.61 | 877 | 856 | 166.9 |
| B | 0 | 189 | 20259 | 116.27 | 877 | 856 | 166.9 |
| B | 12 | 111 | 19582 | 112.22 | 877 | 856 | 166.9 |
| C | 14 | 238 | 129303 | 657.0 | 832 | 839 | 195.5 |
| C | 0 | 207 | 12504 | 59.66 | 832 | 839 | 195.5 |
| C | 3 | 233 | 6384 | 28.36 | 832 | 839 | 195.5 |
| D | 7 | 238 | 715530 | 3527.82 | 835 | 813 | 202.6 |
| D | 11 | 176 | 239946 | 1180.35 | 835 | 813 | 202.6 |
| D | 1 | 52 | 112788 | 552.71 | 835 | 813 | 202.6 |
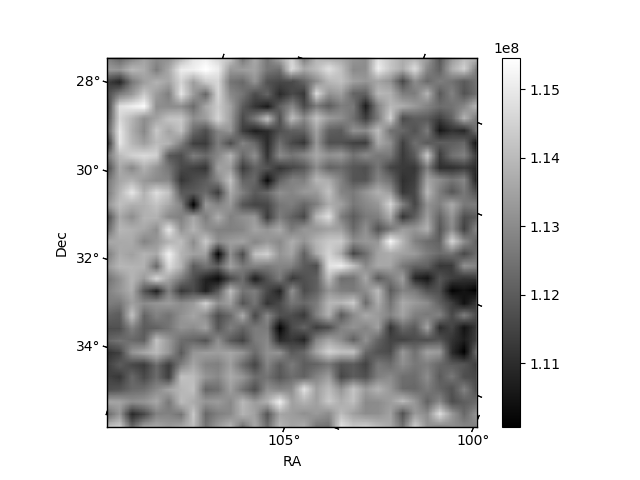
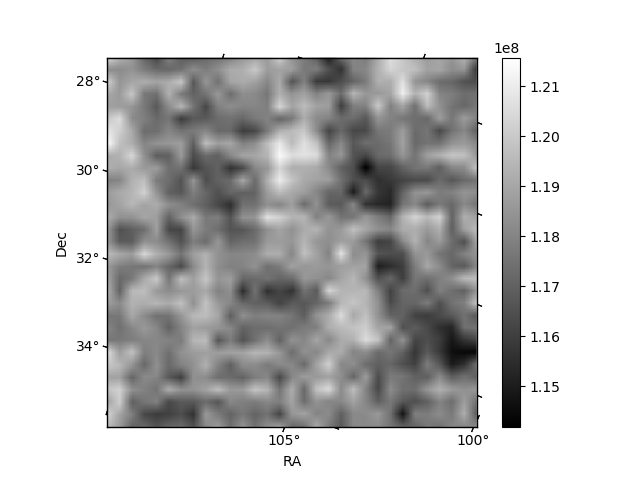
Histogram calculated using DETX and DETY for each event in the final _common_clean file
| Quadrant A | 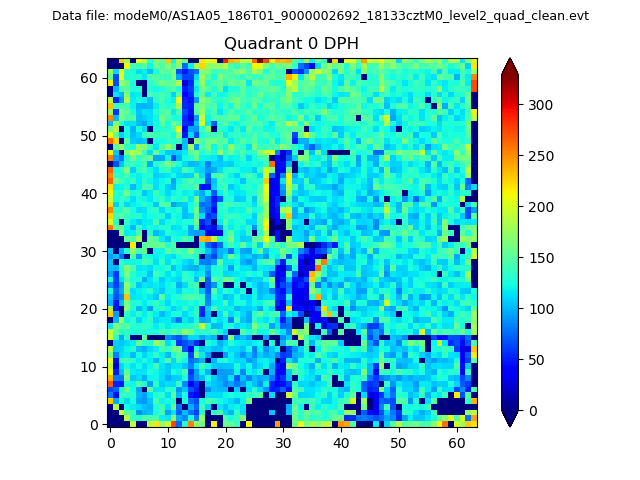 |
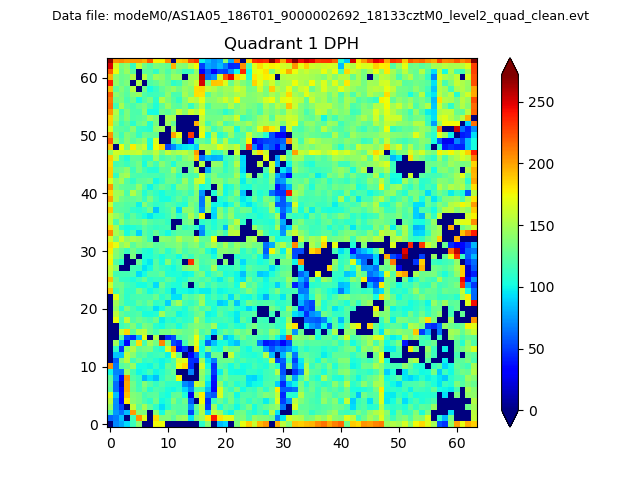 |
Quadrant B |
|---|---|---|---|
| Quadrant D | 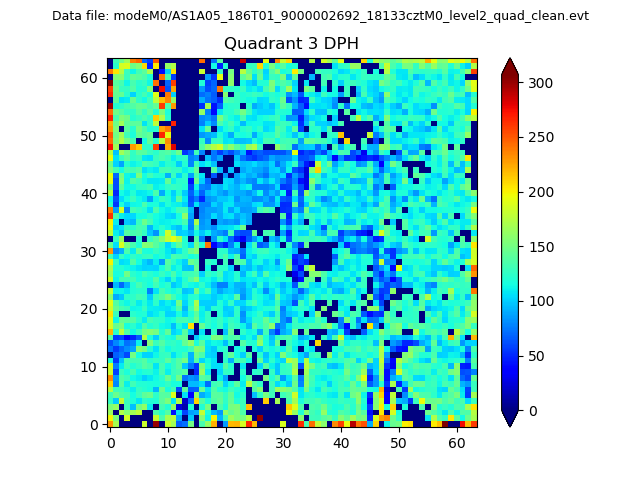 |
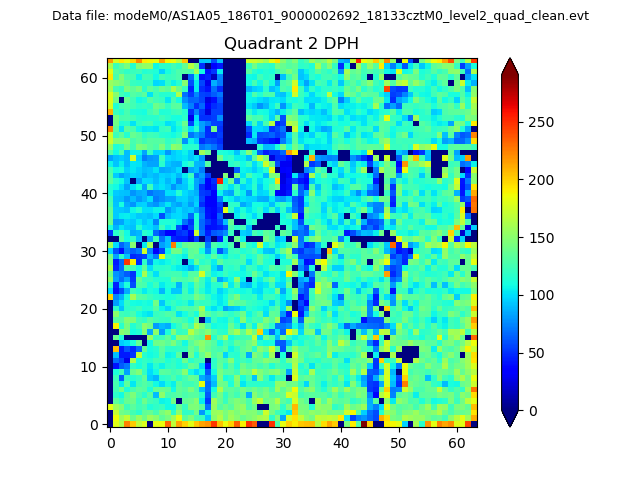 |
Quadrant C |
| Plot type | Count rate plots | Images |
|---|---|---|
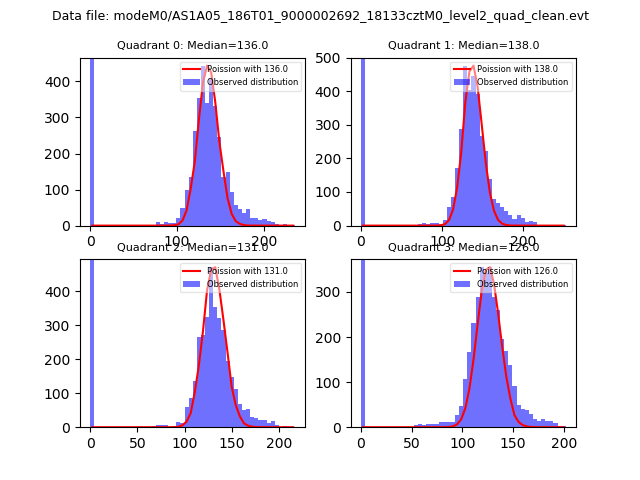
| Comparison with Poisson distribution Blue bars denote a histogram of data divided into 1 sec bins. Red curve is a Poisson curve with rate = median count rate of data. |
 |
 |
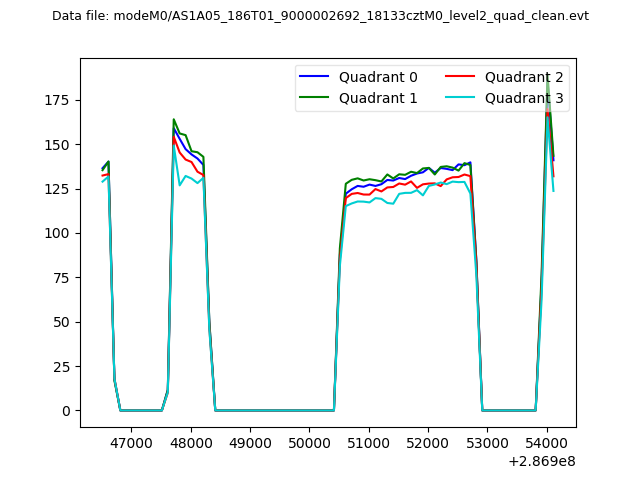
| Quadrant-wise count rates Data is divided into 100 sec bins |
 |
|
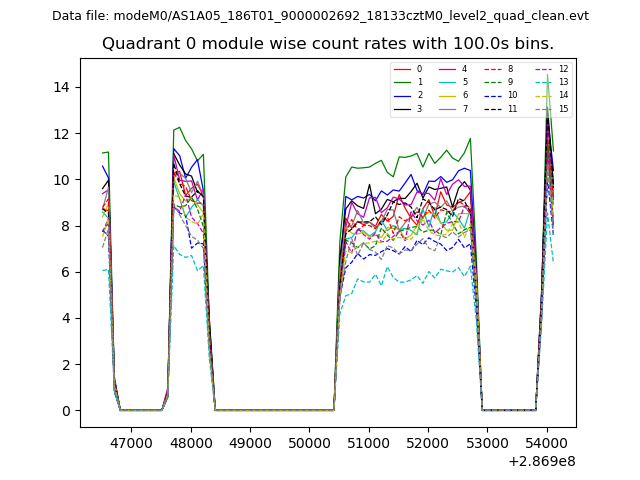
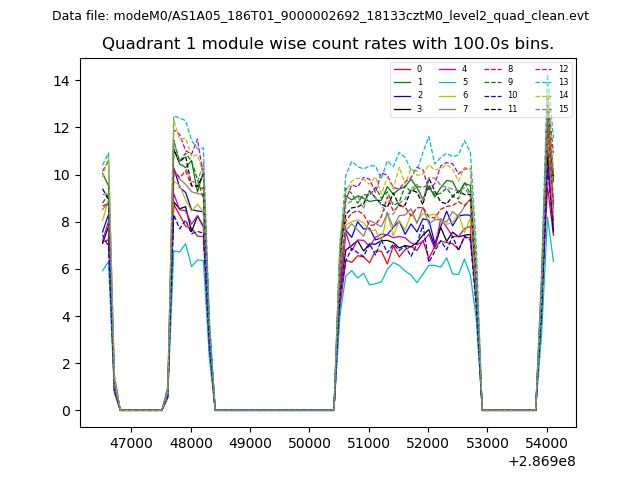
| Module-wise count rates for Quadrant A Data is divided into 100 sec bins |
 |
 |
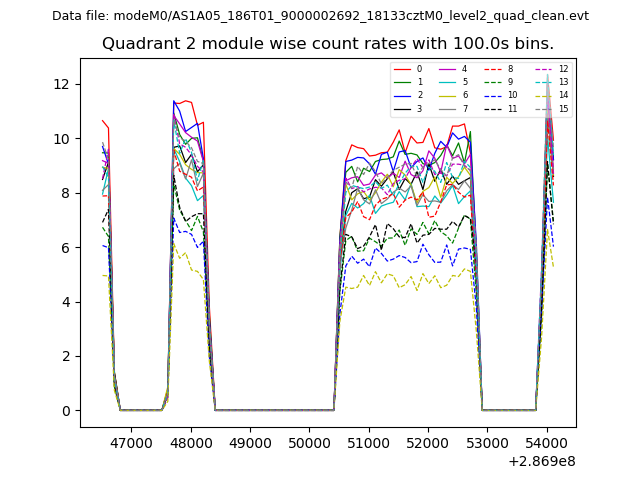
| Module-wise count rates for Quadrant B Data is divided into 100 sec bins |
 |
 |
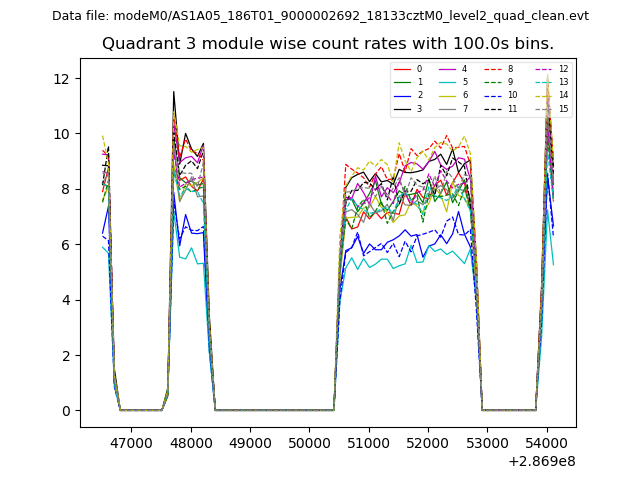
| Module-wise count rates for Quadrant C Data is divided into 100 sec bins |
 |
 |
| Module-wise count rates for Quadrant D Data is divided into 100 sec bins |
 |
 |
| Parameter | Plot |
|---|---|
| CZT HV Monitor | 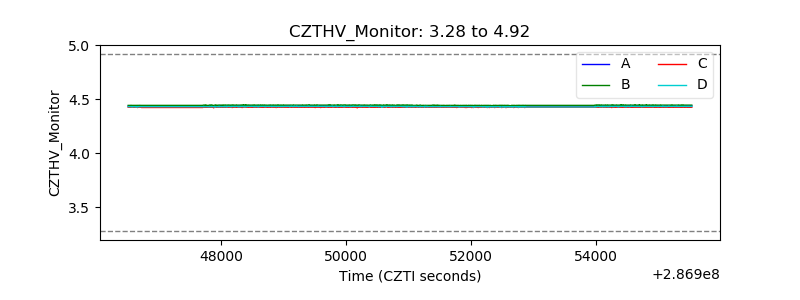 |
| D_VDD | 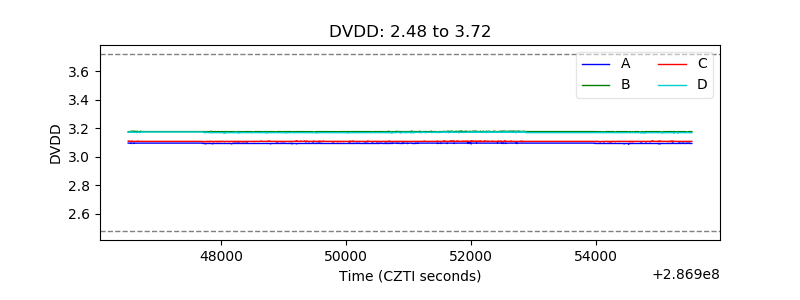 |
| Temperature 1 | 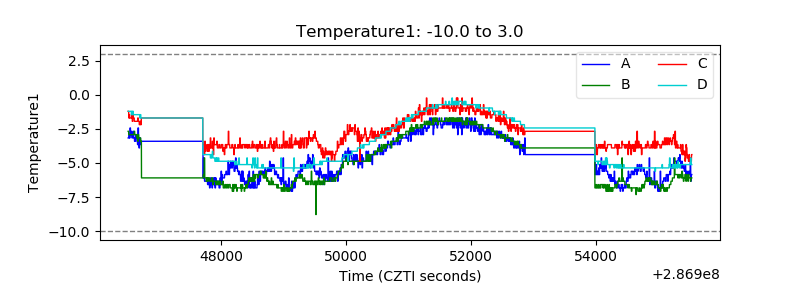 |
| Veto HV Monitor | 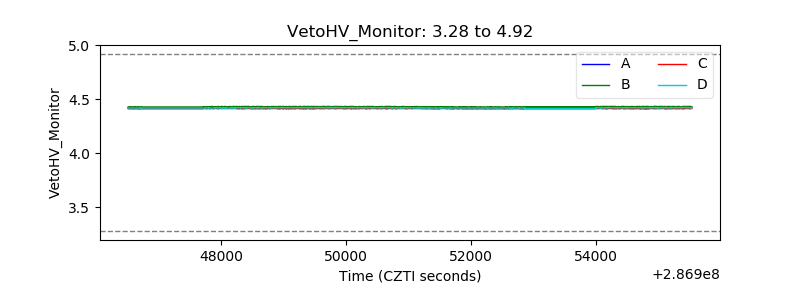 |
| Veto LLD | 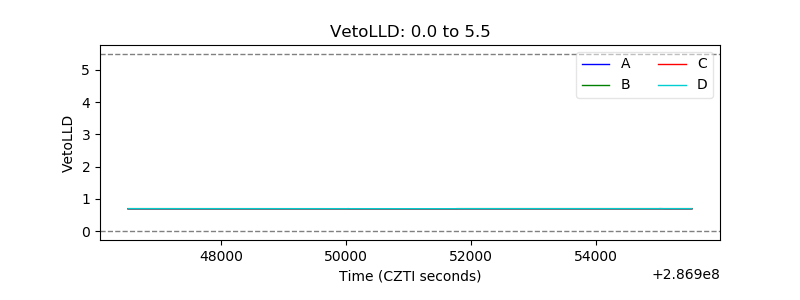 |
| Alpha Counter | 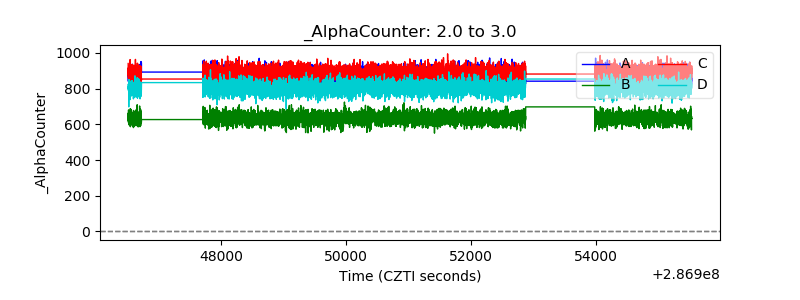 |
| _CPM_Rate | 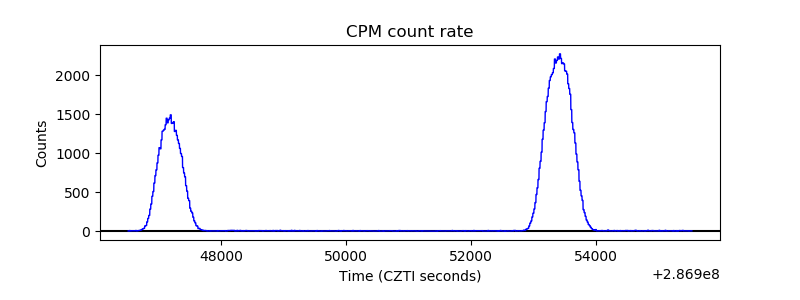 |
| CZT Counter | 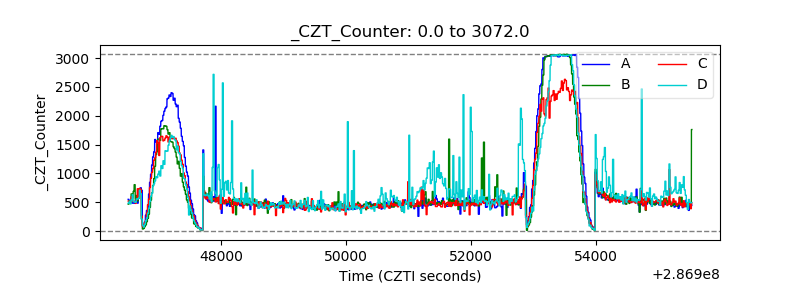 |
| +2.5 Volts monitor |  |
| +5 Volts monitor | 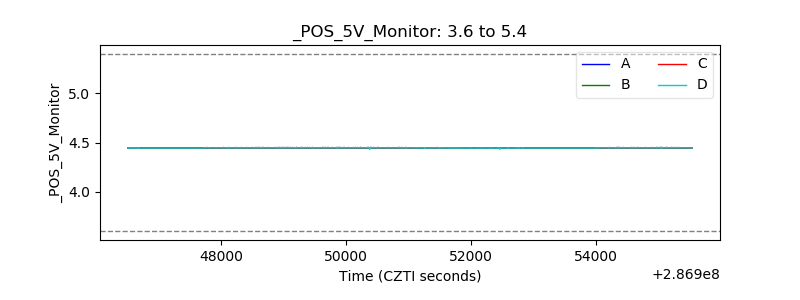 |
| _ROLL_ROT | 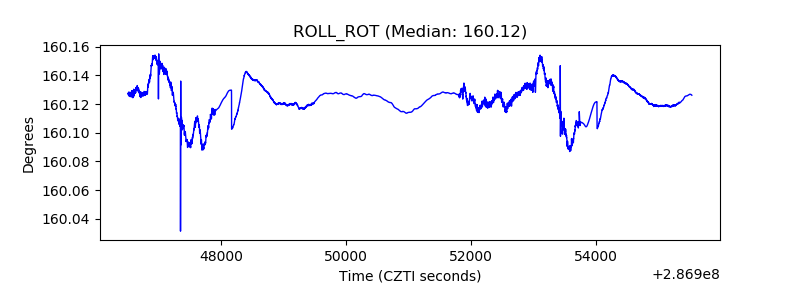 |
| _Roll_DEC | 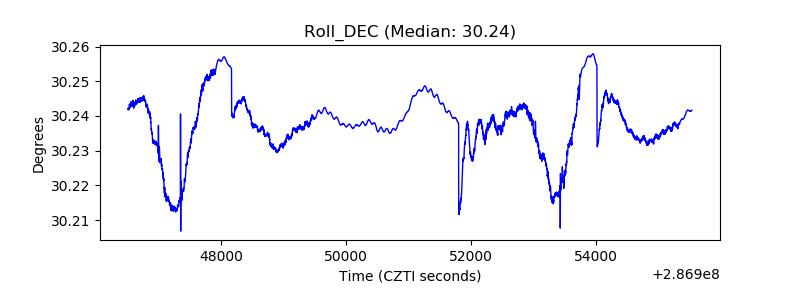 |
| _Roll_RA | 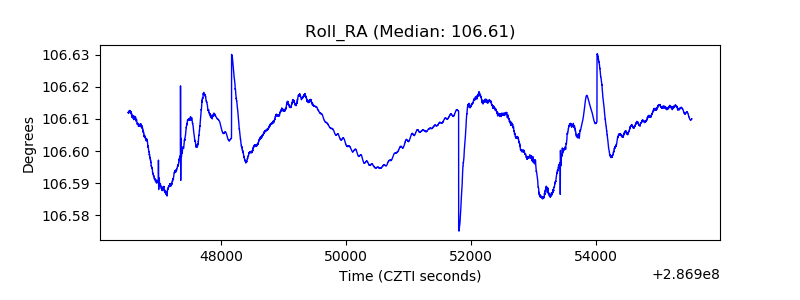 |
| Veto Counter | 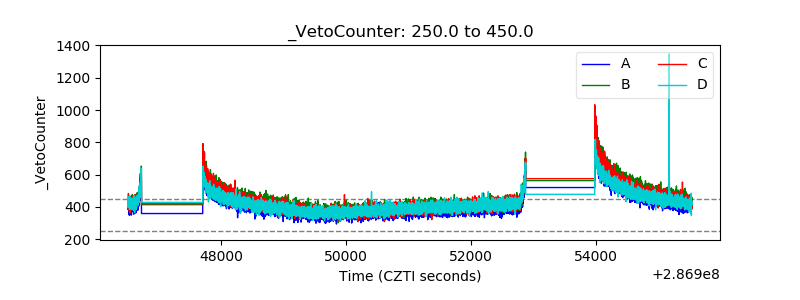 |