| Param | Original file | Final file |
|---|---|---|
| Filename | modeM0/AS1A05_186T01_9000002692_18134cztM0_level2.evt | modeM0/AS1A05_186T01_9000002692_18134cztM0_level2_quad_clean.evt |
| Size (bytes) | 483,935,040 | 65,571,840 |
| Size | 461.5 MB | 62.5 MB |
| Events in quadrant A | 3,275,389 | 396,980 |
| Events in quadrant B | 3,380,828 | 405,055 |
| Events in quadrant C | 3,270,456 | 376,813 |
| Events in quadrant D | 4,294,797 | 359,690 |
| Mode SS | |||
|---|---|---|---|
| Quadrant | BADHDUFLAG | Total packets | Discarded packets |
| A | 0 | 132 | 0 |
| B | 0 | 132 | 0 |
| C | 0 | 132 | 0 |
| D | 0 | 132 | 0 |
| Mode M0 | |||
|---|---|---|---|
| Quadrant | BADHDUFLAG | Total packets | Discarded packets |
| A | 0 | 13561 | 2 |
| B | 0 | 13863 | 2 |
| C | 0 | 13578 | 2 |
| D | 0 | 17047 | 3 |
| Mode M9 | |||
|---|---|---|---|
| Quadrant | BADHDUFLAG | Total packets | Discarded packets |
| A | 0 | 17 | 0 |
| B | 0 | 18 | 0 |
| C | 0 | 18 | 0 |
| D | 0 | 18 | 0 |
| Quadrant | Total seconds | Saturated seconds | Saturation percentage |
|---|---|---|---|
| A | 6396 | 20 | 0.312695% |
| B | 6396 | 39 | 0.609756% |
| C | 6396 | 57 | 0.891182% |
| D | 6395 | 140 | 2.189210% |
Noise dominated data is calculated using 1-second bins in cleaned event files. If a bin has >2000 counts, and if more than 50% of those come from <1% of pixels, then it is considered to be noise-dominated and hence unusable.
| Quadrant | # 1 sec bins | Bins with >0 counts | Bins with >2000 counts | High rate bins dominated by noise | Noise dominated (total time) | Noise dominated (detector-on time) | Marked lightcurve |
|---|---|---|---|---|---|---|---|
| A | 7631 | 6397 | 0 | 0 | 0.00% | 0.00% | 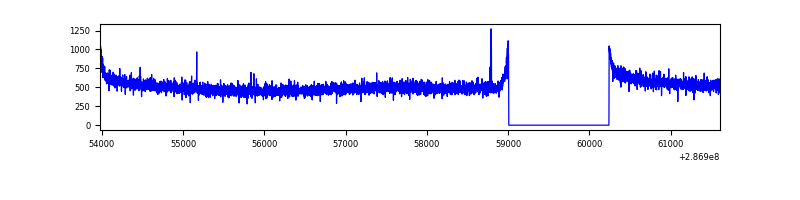 |
| B | 7631 | 6397 | 0 | 0 | 0.00% | 0.00% | 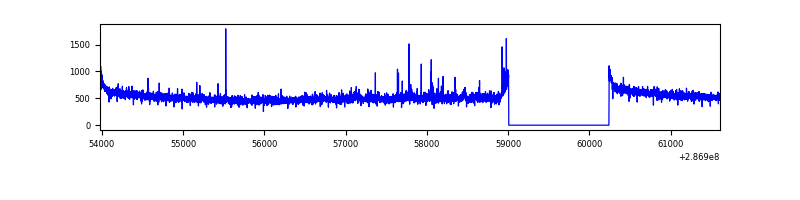 |
| C | 7631 | 6397 | 0 | 0 | 0.00% | 0.00% | 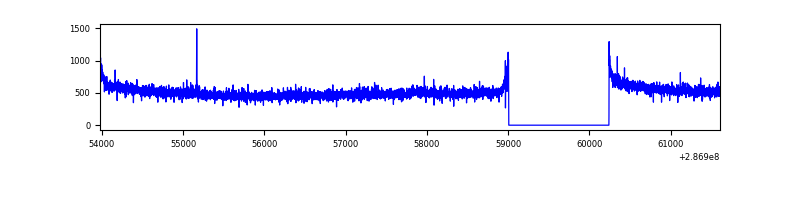 |
| D | 7630 | 6396 | 90 | 90 | 1.18% | 1.41% | 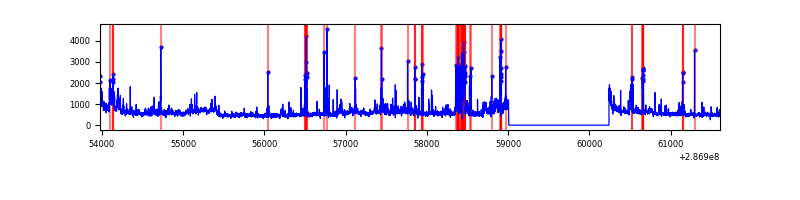 |
Top three noisy pixels from each quadrant. If the there are fewer than three noisy pixels in the level2.evt file, extra rows are filled as -1
| Pixel properties | Quadrant properties | ||||||
|---|---|---|---|---|---|---|---|
| Quadrant | DetID | PixID | Counts | Sigma | Mean | Median | Sigma |
| A | 0 | 226 | 7455 | 38.97 | 851 | 836 | 169.8 |
| A | 4 | 2 | 6029 | 30.58 | 851 | 836 | 169.8 |
| A | 12 | 194 | 5903 | 29.84 | 851 | 836 | 169.8 |
| B | 4 | 171 | 19726 | 119.0 | 852 | 835 | 158.7 |
| B | 12 | 111 | 18426 | 110.81 | 852 | 835 | 158.7 |
| B | 0 | 189 | 16842 | 100.83 | 852 | 835 | 158.7 |
| C | 14 | 238 | 127408 | 675.46 | 804 | 811 | 187.4 |
| C | 0 | 207 | 6107 | 28.26 | 804 | 811 | 187.4 |
| C | 13 | 61 | 5774 | 26.48 | 804 | 811 | 187.4 |
| D | 7 | 238 | 652455 | 3331.49 | 805 | 783 | 195.6 |
| D | 11 | 176 | 299395 | 1526.57 | 805 | 783 | 195.6 |
| D | 10 | 70 | 193382 | 984.61 | 805 | 783 | 195.6 |
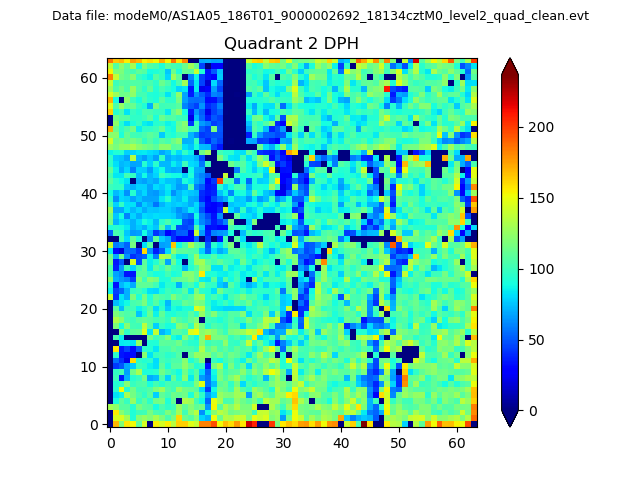
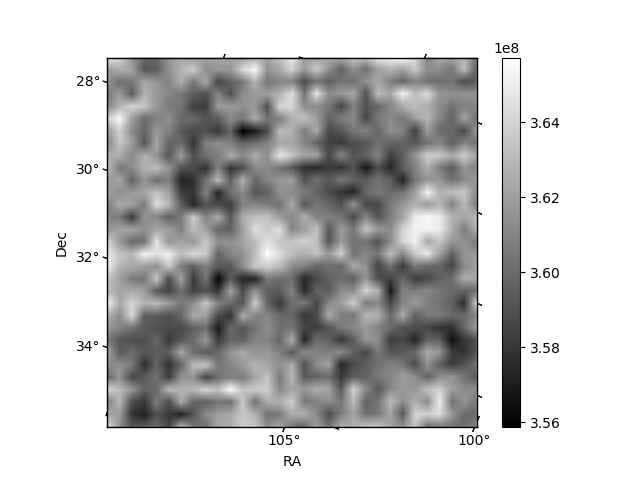
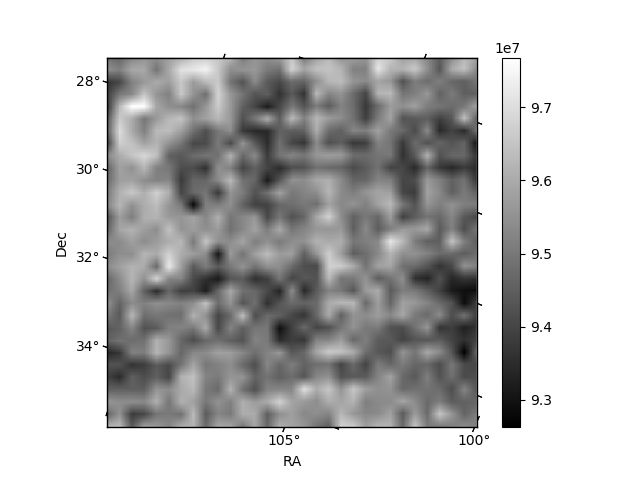
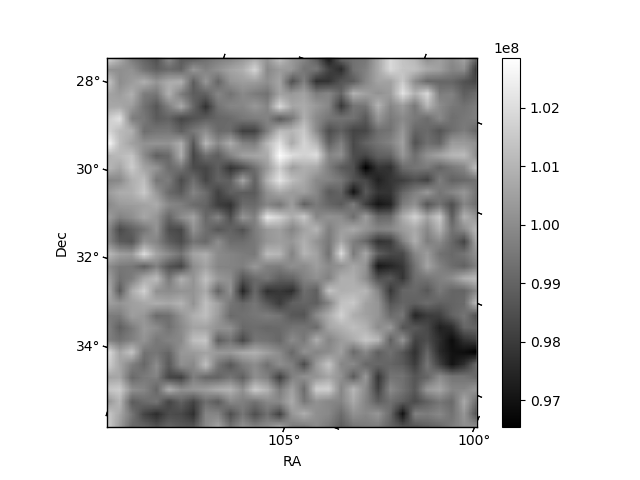
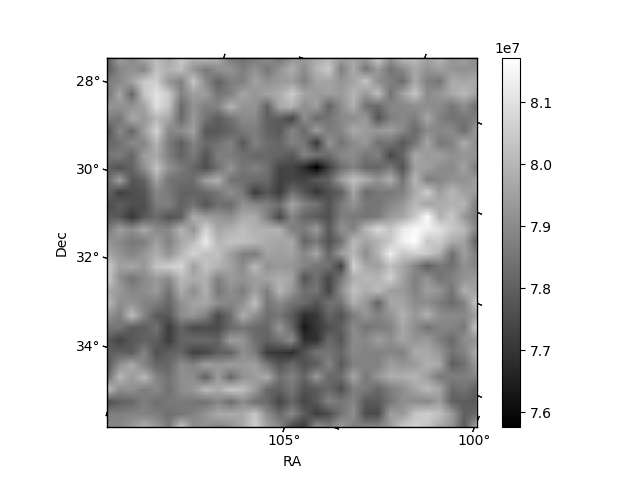
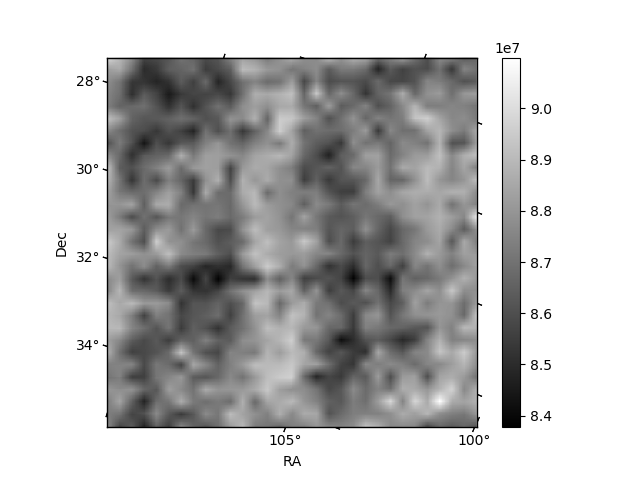
Histogram calculated using DETX and DETY for each event in the final _common_clean file
| Quadrant A | 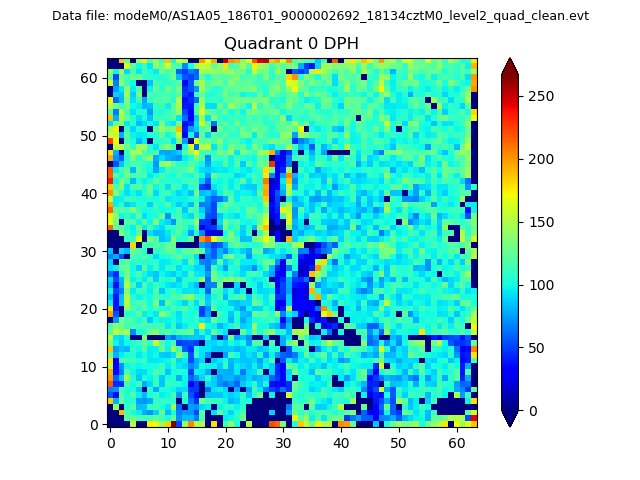 |
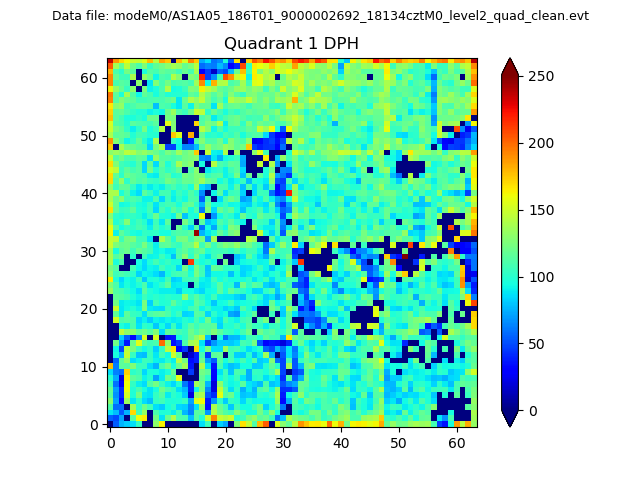 |
Quadrant B |
|---|---|---|---|
| Quadrant D | 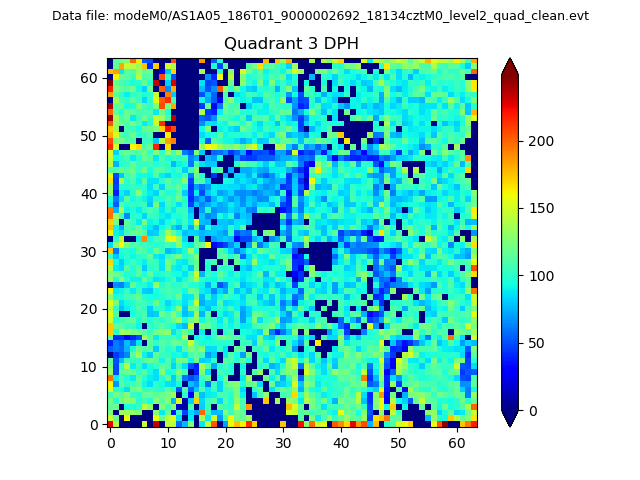 |
 |
Quadrant C |
| Plot type | Count rate plots | Images |
|---|---|---|
| Comparison with Poisson distribution Blue bars denote a histogram of data divided into 1 sec bins. Red curve is a Poisson curve with rate = median count rate of data. |
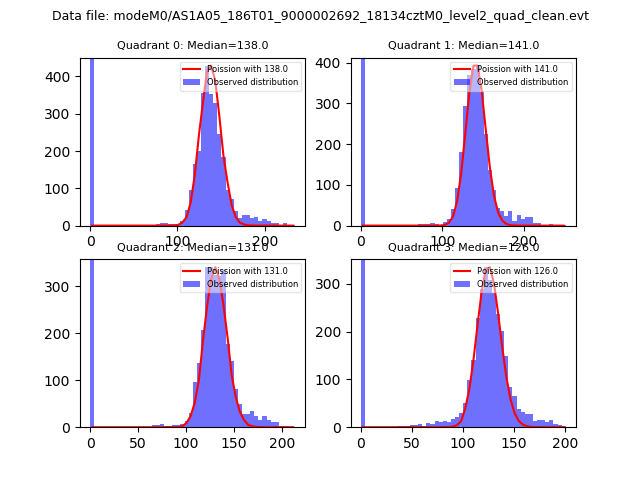 |
 |
| Quadrant-wise count rates Data is divided into 100 sec bins |
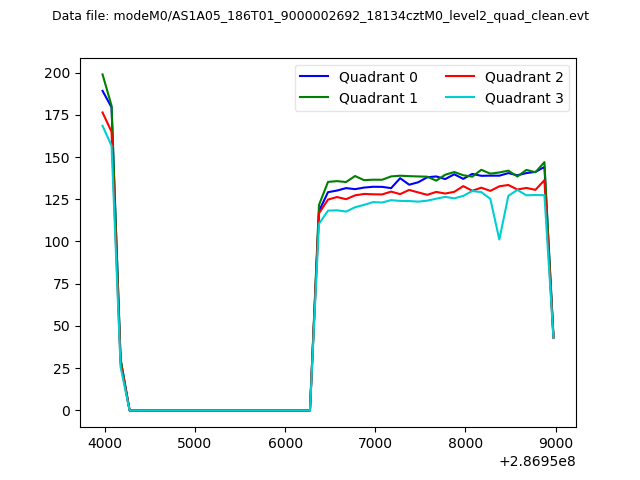 |
|
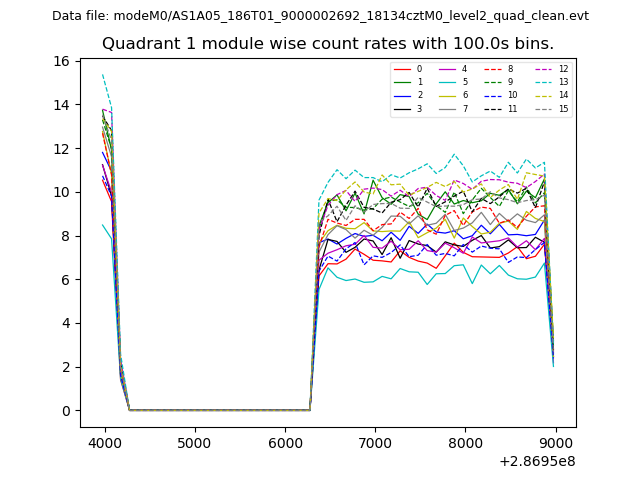
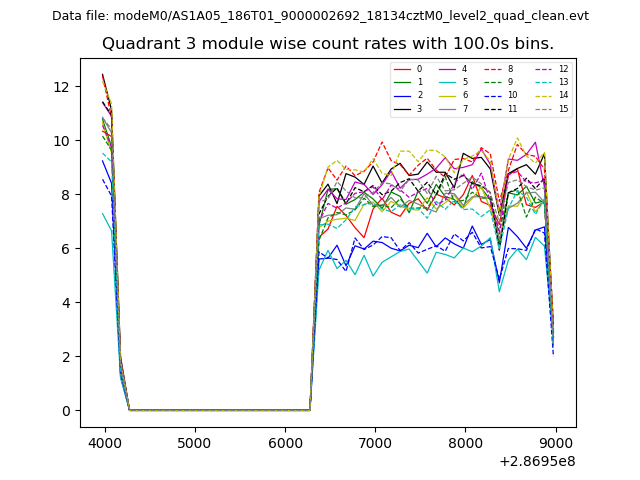
| Module-wise count rates for Quadrant A Data is divided into 100 sec bins |
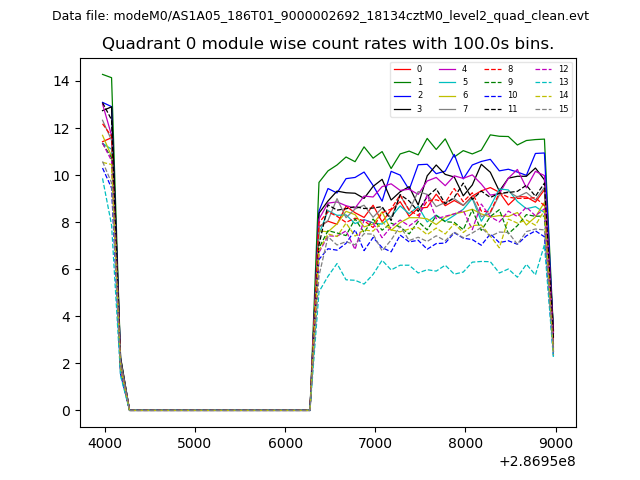 |
 |
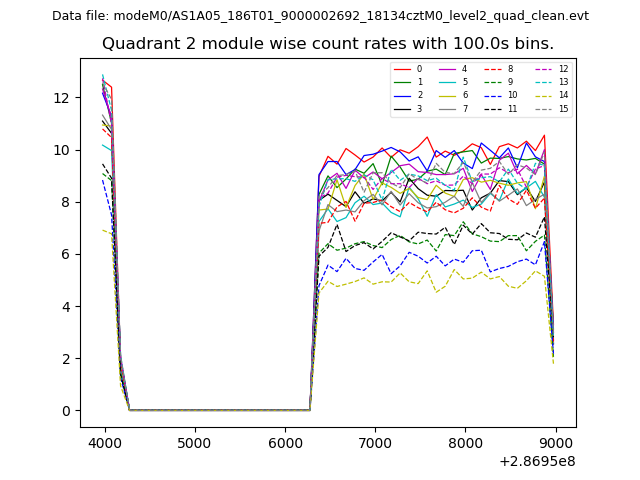
| Module-wise count rates for Quadrant B Data is divided into 100 sec bins |
 |
 |
| Module-wise count rates for Quadrant C Data is divided into 100 sec bins |
 |
 |
| Module-wise count rates for Quadrant D Data is divided into 100 sec bins |
 |
 |
| Parameter | Plot |
|---|---|
| CZT HV Monitor |  |
| D_VDD | 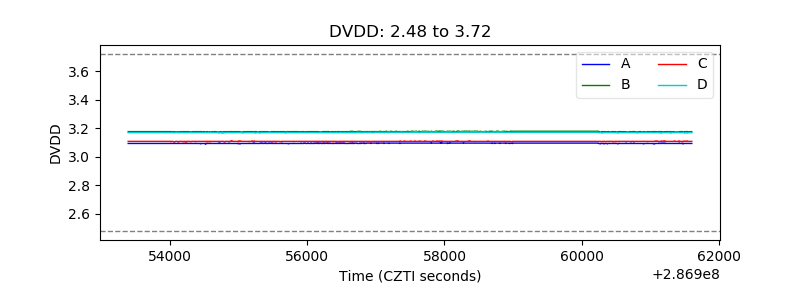 |
| Temperature 1 | 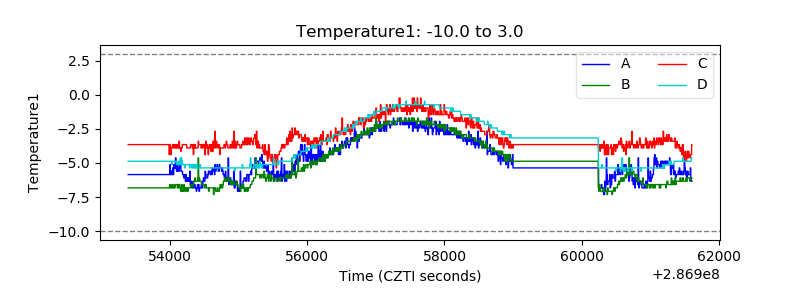 |
| Veto HV Monitor | 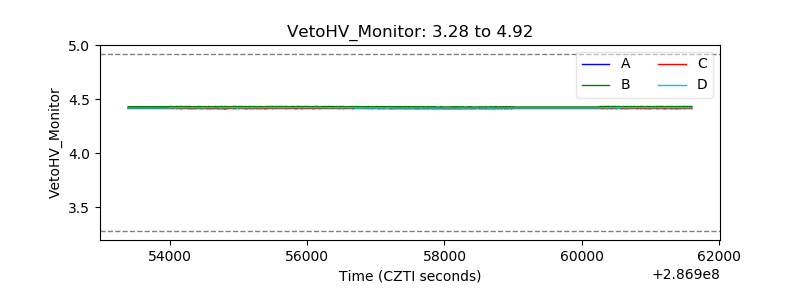 |
| Veto LLD | 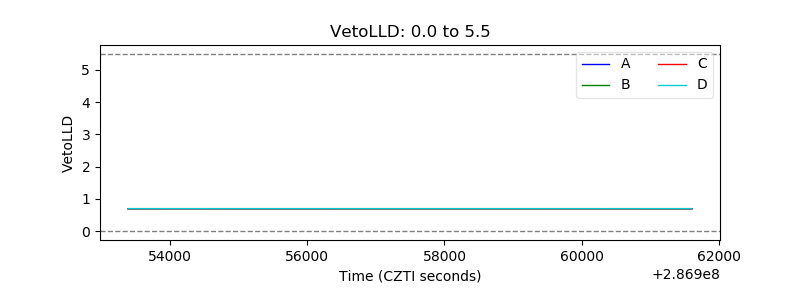 |
| Alpha Counter | 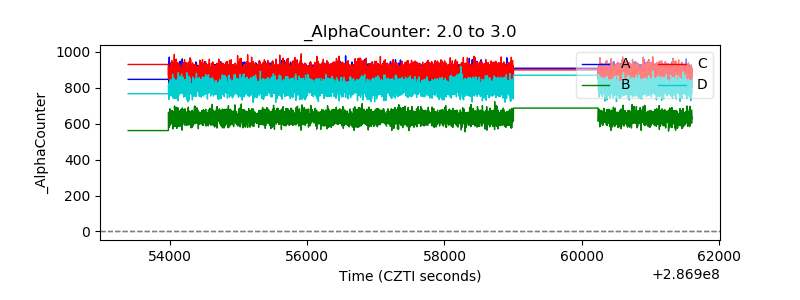 |
| _CPM_Rate | 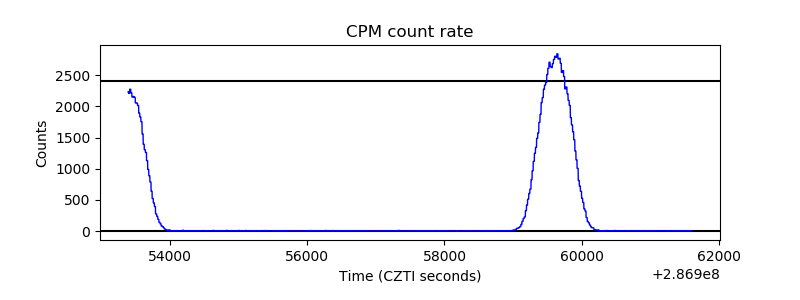 |
| CZT Counter | 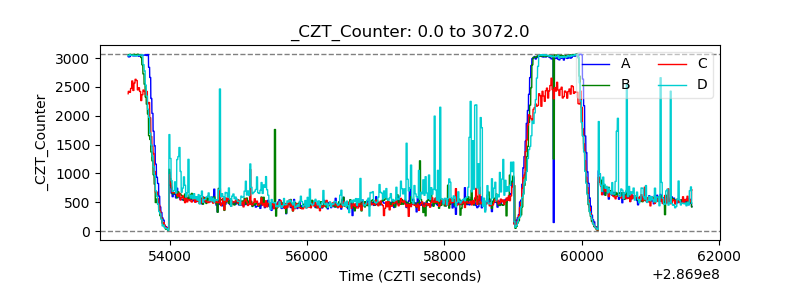 |
| +2.5 Volts monitor | 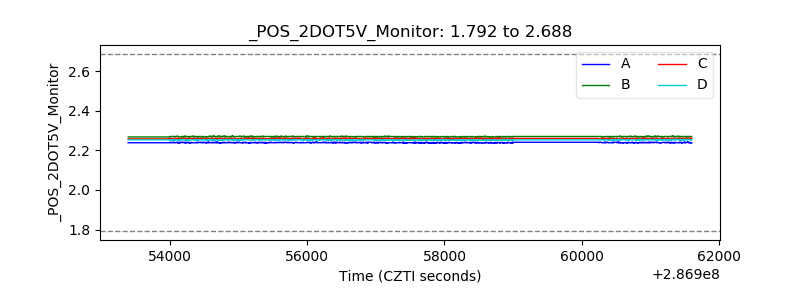 |
| +5 Volts monitor |  |
| _ROLL_ROT | 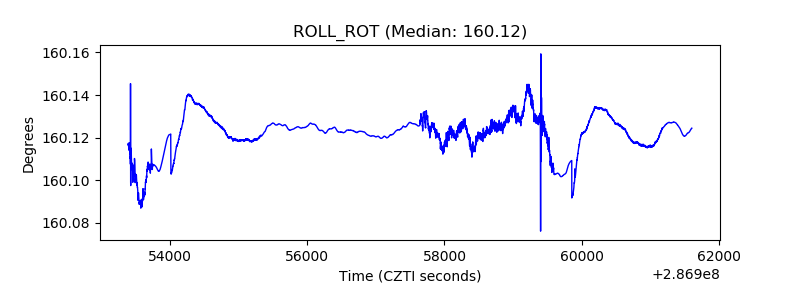 |
| _Roll_DEC | 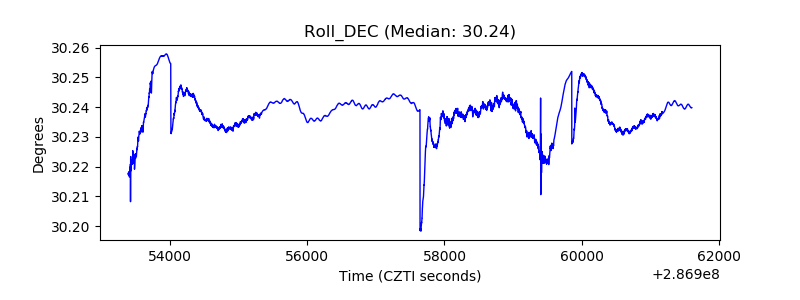 |
| _Roll_RA | 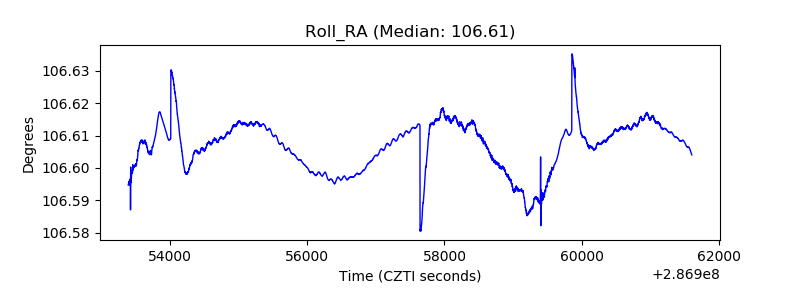 |
| Veto Counter | 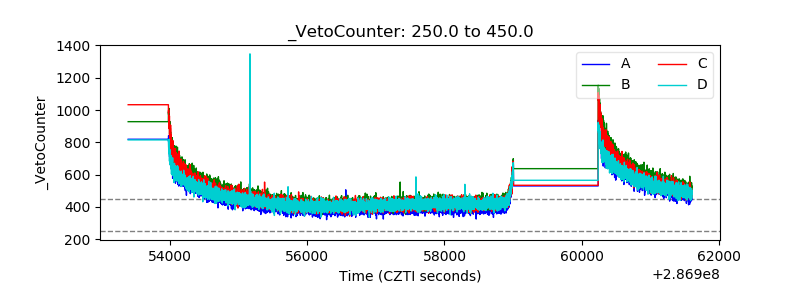 |