| Param | Original file | Final file |
|---|---|---|
| Filename | modeM0/AS1A05_186T01_9000002692_18137cztM0_level2.evt | modeM0/AS1A05_186T01_9000002692_18137cztM0_level2_quad_clean.evt |
| Size (bytes) | 364,371,840 | 69,128,640 |
| Size | 347.5 MB | 65.9 MB |
| Events in quadrant A | 2,301,338 | 467,446 |
| Events in quadrant B | 2,361,405 | 472,089 |
| Events in quadrant C | 2,240,519 | 434,311 |
| Events in quadrant D | 3,837,641 | 414,891 |
| Mode SS | |||
|---|---|---|---|
| Quadrant | BADHDUFLAG | Total packets | Discarded packets |
| A | 0 | 86 | 0 |
| B | 0 | 86 | 0 |
| C | 0 | 86 | 0 |
| D | 0 | 86 | 0 |
| Mode M0 | |||
|---|---|---|---|
| Quadrant | BADHDUFLAG | Total packets | Discarded packets |
| A | 0 | 9414 | 1 |
| B | 0 | 9559 | 1 |
| C | 0 | 9187 | 1 |
| D | 0 | 14351 | 1 |
| Mode M9 | |||
|---|---|---|---|
| Quadrant | BADHDUFLAG | Total packets | Discarded packets |
| A | 0 | 3 | 0 |
| B | 0 | 4 | 0 |
| C | 0 | 4 | 0 |
| D | 0 | 4 | 0 |
| Quadrant | Total seconds | Saturated seconds | Saturation percentage |
|---|---|---|---|
| A | 4329 | 26 | 0.600601% |
| B | 4329 | 25 | 0.577501% |
| C | 4329 | 29 | 0.669901% |
| D | 4329 | 102 | 2.356202% |
Noise dominated data is calculated using 1-second bins in cleaned event files. If a bin has >2000 counts, and if more than 50% of those come from <1% of pixels, then it is considered to be noise-dominated and hence unusable.
| Quadrant | # 1 sec bins | Bins with >0 counts | Bins with >2000 counts | High rate bins dominated by noise | Noise dominated (total time) | Noise dominated (detector-on time) | Marked lightcurve |
|---|---|---|---|---|---|---|---|
| A | 4329 | 4329 | 0 | 0 | 0.00% | 0.00% | 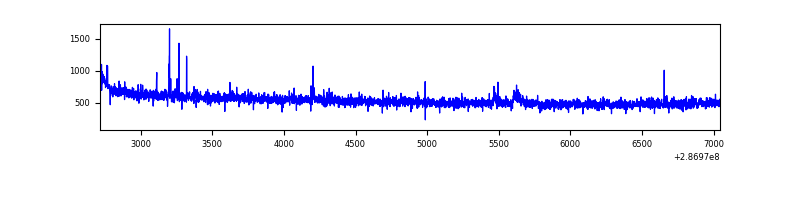 |
| B | 4329 | 4329 | 1 | 1 | 0.02% | 0.02% | 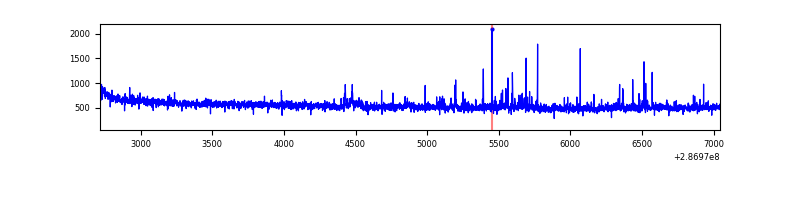 |
| C | 4329 | 4329 | 0 | 0 | 0.00% | 0.00% | 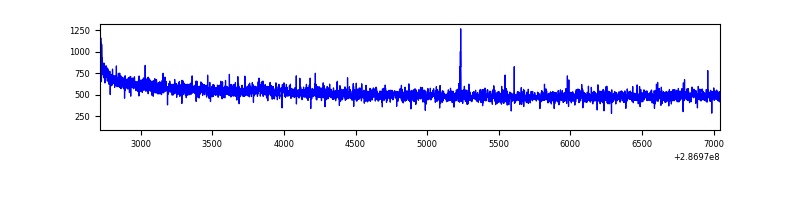 |
| D | 4329 | 4329 | 82 | 82 | 1.89% | 1.89% | 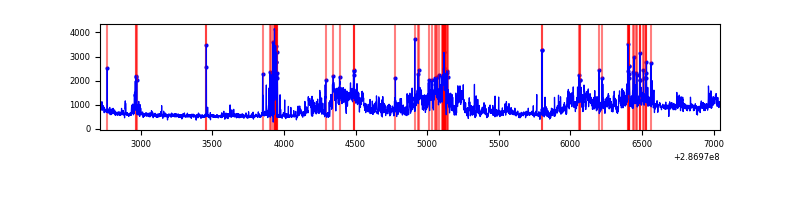 |
Top three noisy pixels from each quadrant. If the there are fewer than three noisy pixels in the level2.evt file, extra rows are filled as -1
| Pixel properties | Quadrant properties | ||||||
|---|---|---|---|---|---|---|---|
| Quadrant | DetID | PixID | Counts | Sigma | Mean | Median | Sigma |
| A | 15 | 174 | 16370 | 133.61 | 590 | 580 | 118.2 |
| A | 4 | 2 | 14748 | 119.89 | 590 | 580 | 118.2 |
| A | 0 | 226 | 5424 | 40.99 | 590 | 580 | 118.2 |
| B | 7 | 220 | 30889 | 278.11 | 584 | 572 | 109.0 |
| B | 0 | 189 | 13788 | 121.24 | 584 | 572 | 109.0 |
| B | 12 | 111 | 11735 | 102.4 | 584 | 572 | 109.0 |
| C | 14 | 238 | 87840 | 699.25 | 547 | 554 | 124.8 |
| C | 3 | 233 | 9849 | 74.46 | 547 | 554 | 124.8 |
| C | 13 | 61 | 3873 | 26.59 | 547 | 554 | 124.8 |
| D | 7 | 238 | 1421599 | 10490.8 | 557 | 543 | 135.5 |
| D | 11 | 176 | 149226 | 1097.64 | 557 | 543 | 135.5 |
| D | 14 | 34 | 88564 | 649.81 | 557 | 543 | 135.5 |
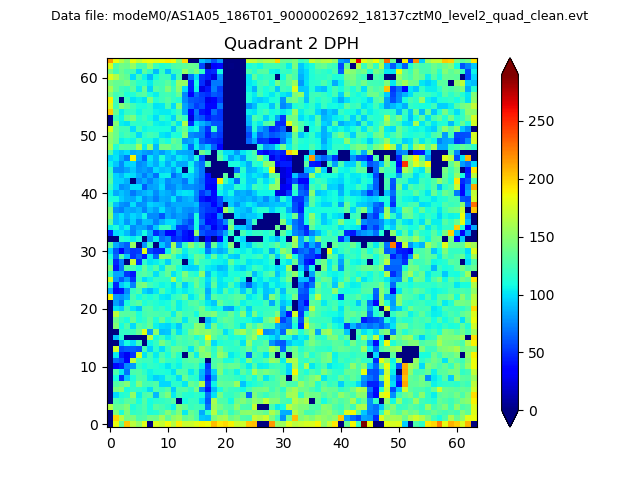
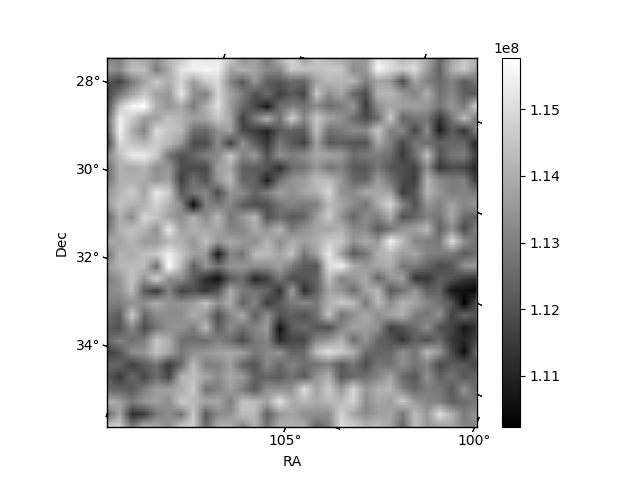
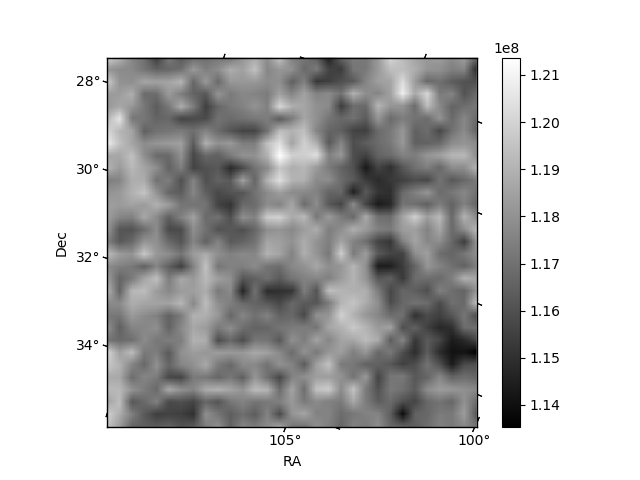
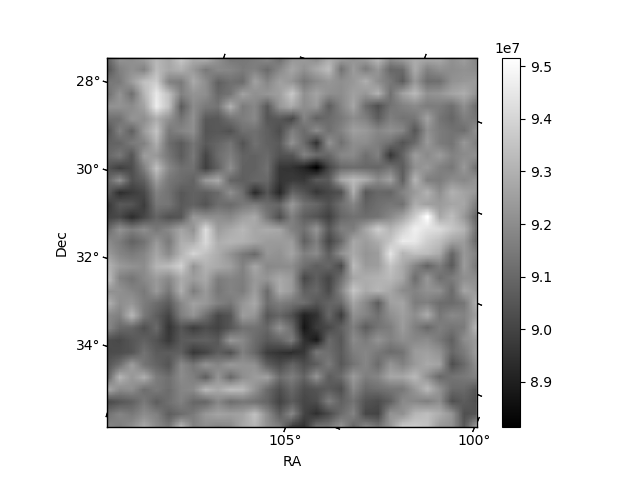
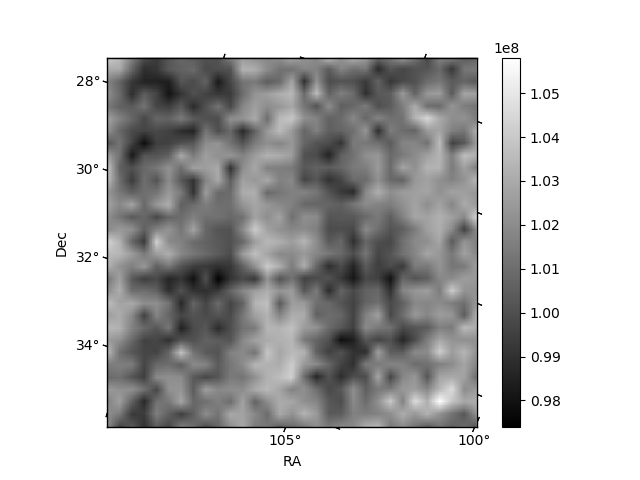
Histogram calculated using DETX and DETY for each event in the final _common_clean file
| Quadrant A | 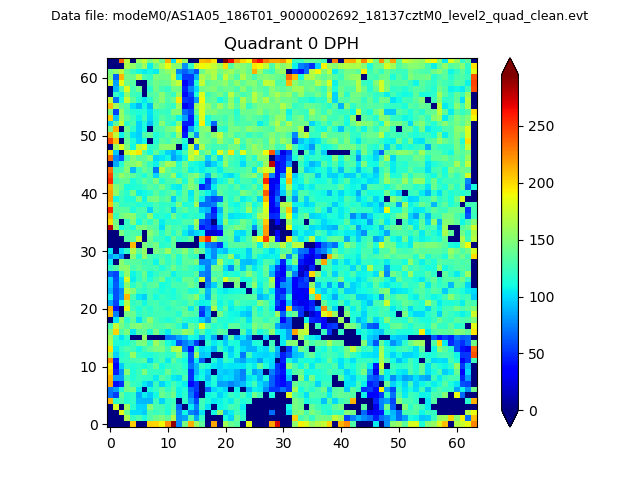 |
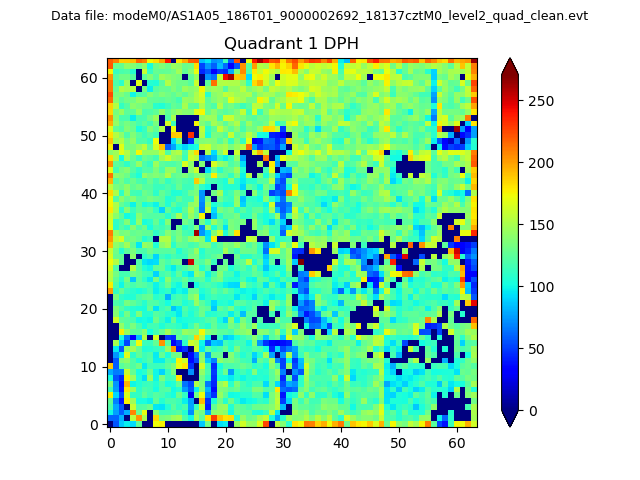 |
Quadrant B |
|---|---|---|---|
| Quadrant D | 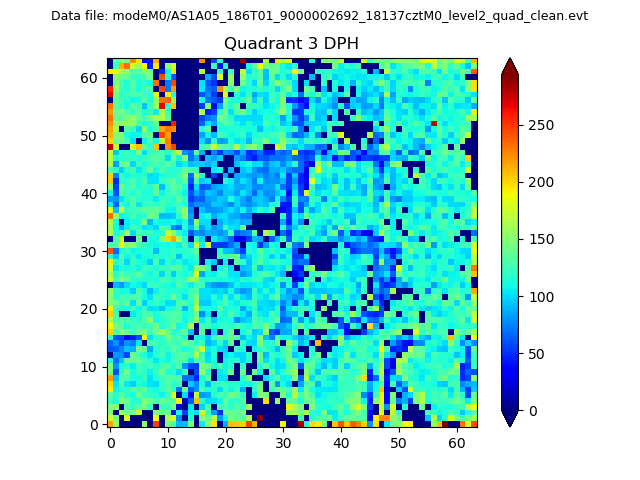 |
 |
Quadrant C |
| Plot type | Count rate plots | Images |
|---|---|---|
| Comparison with Poisson distribution Blue bars denote a histogram of data divided into 1 sec bins. Red curve is a Poisson curve with rate = median count rate of data. |
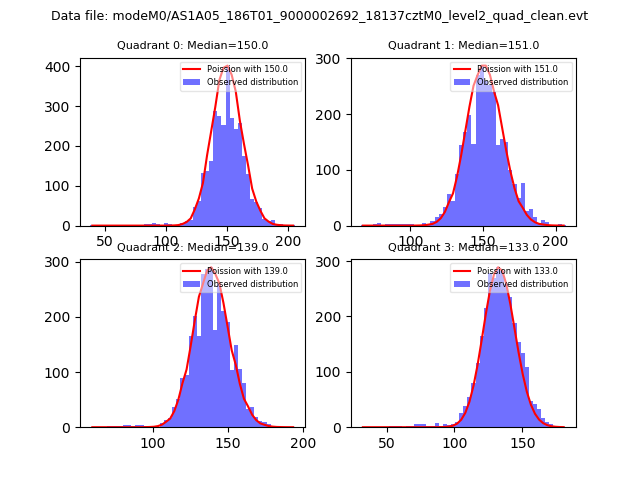 |
 |
| Quadrant-wise count rates Data is divided into 100 sec bins |
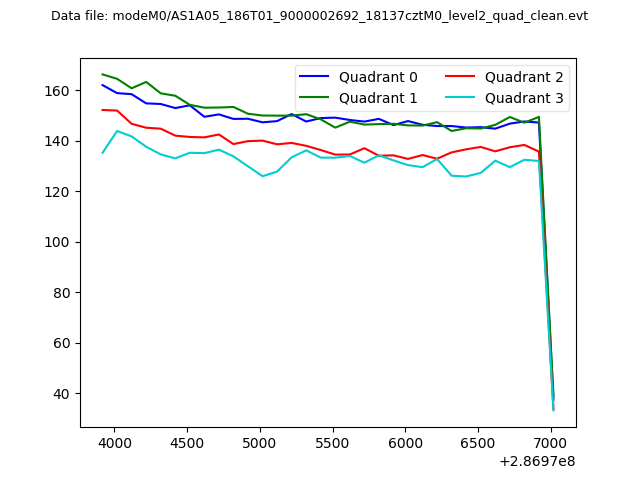 |
|
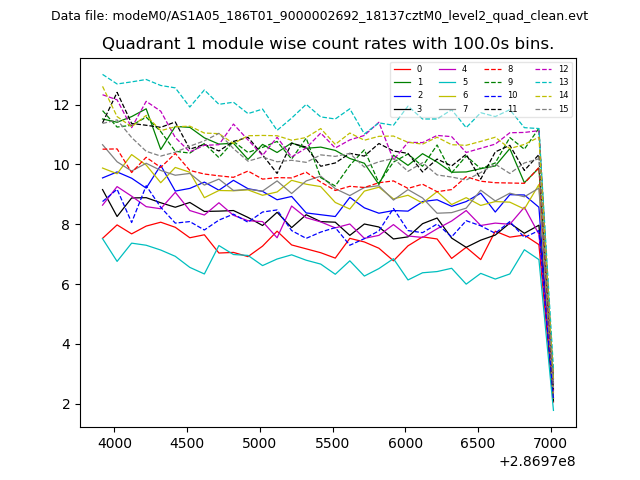
| Module-wise count rates for Quadrant A Data is divided into 100 sec bins |
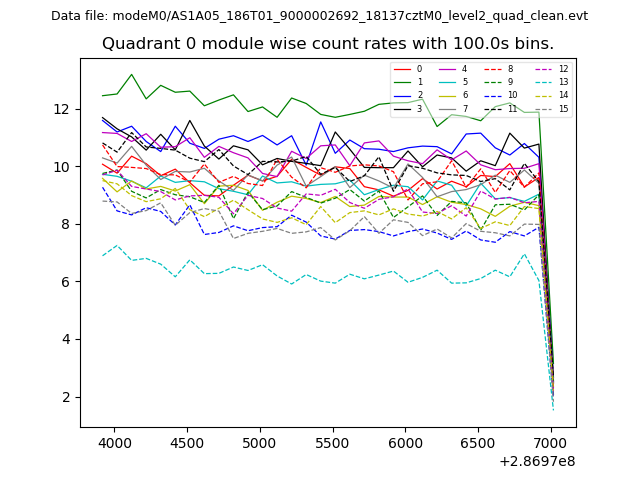 |
 |
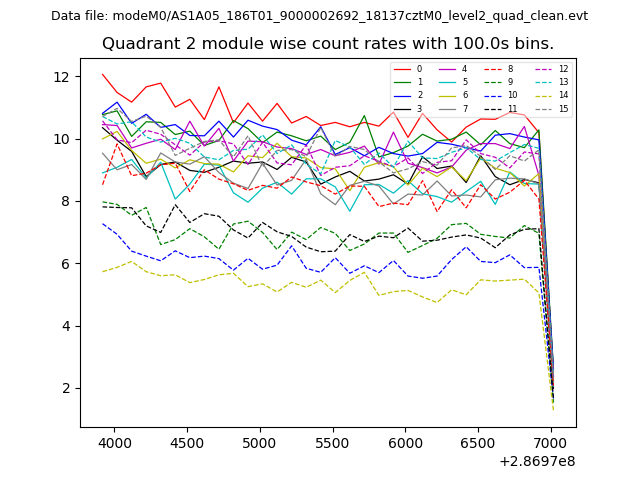
| Module-wise count rates for Quadrant B Data is divided into 100 sec bins |
 |
 |
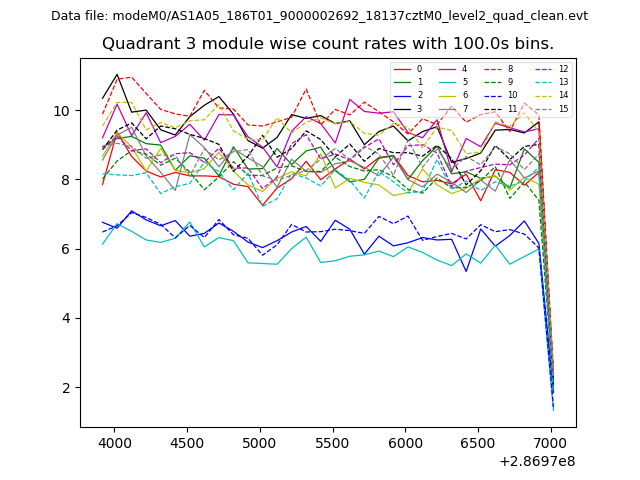
| Module-wise count rates for Quadrant C Data is divided into 100 sec bins |
 |
 |
| Module-wise count rates for Quadrant D Data is divided into 100 sec bins |
 |
 |
| Parameter | Plot |
|---|---|
| CZT HV Monitor | 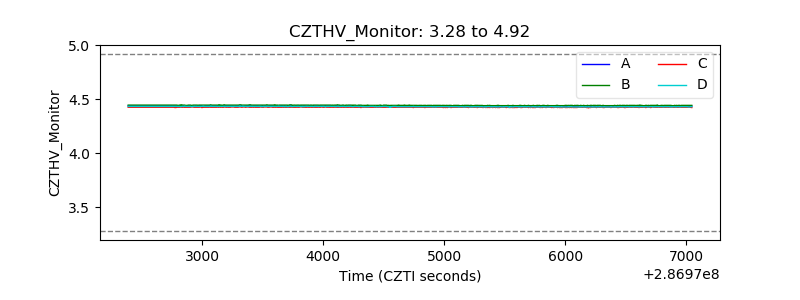 |
| D_VDD | 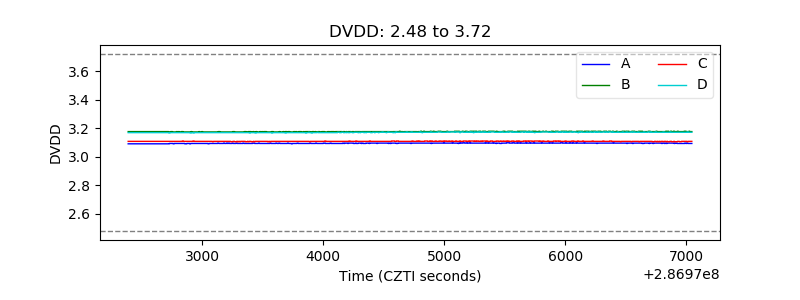 |
| Temperature 1 | 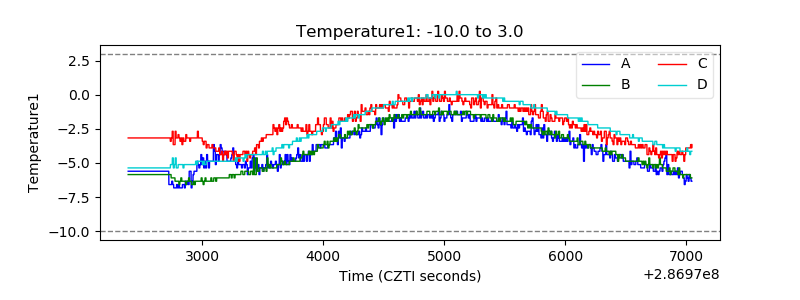 |
| Veto HV Monitor | 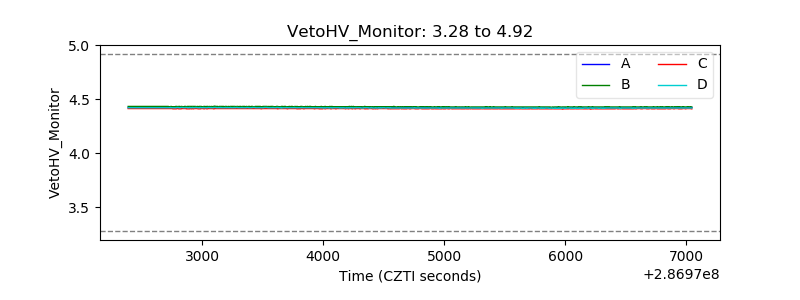 |
| Veto LLD | 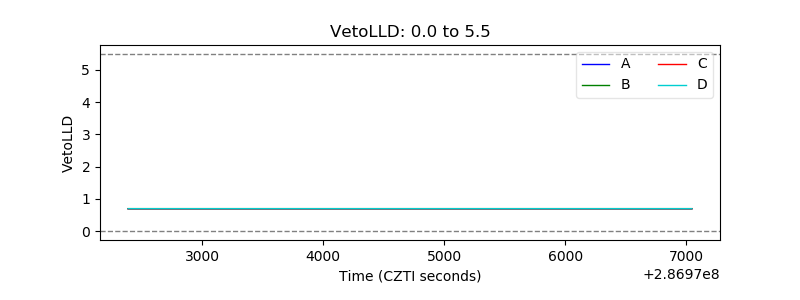 |
| Alpha Counter | 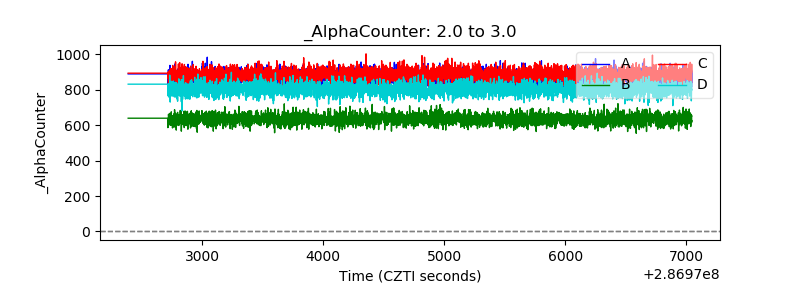 |
| _CPM_Rate | 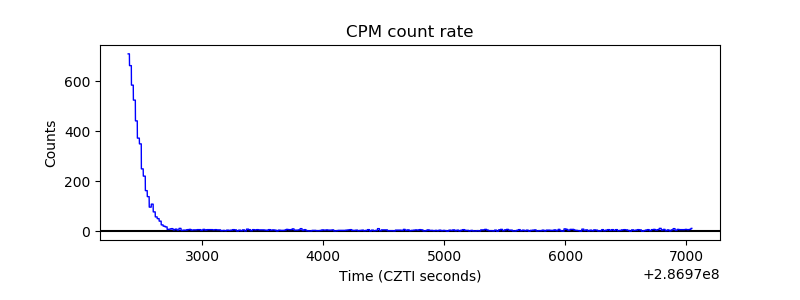 |
| CZT Counter | 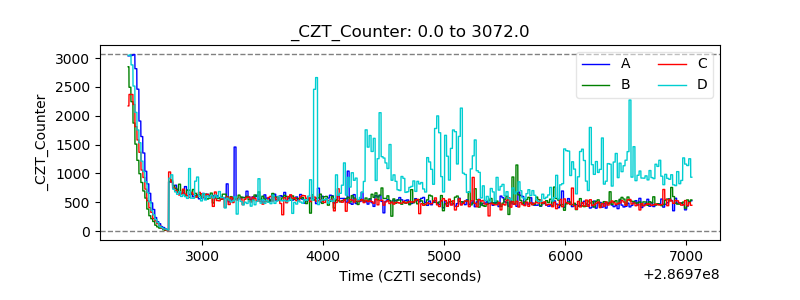 |
| +2.5 Volts monitor |  |
| +5 Volts monitor |  |
| _ROLL_ROT | 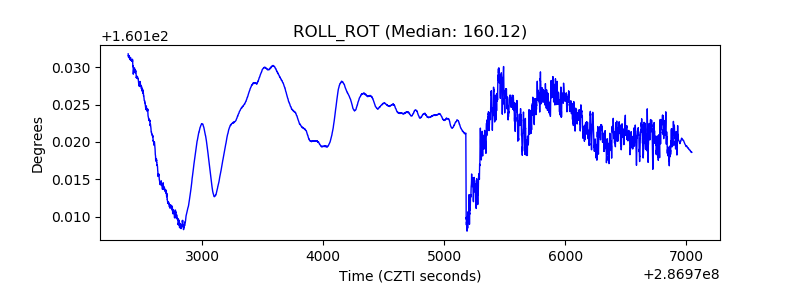 |
| _Roll_DEC | 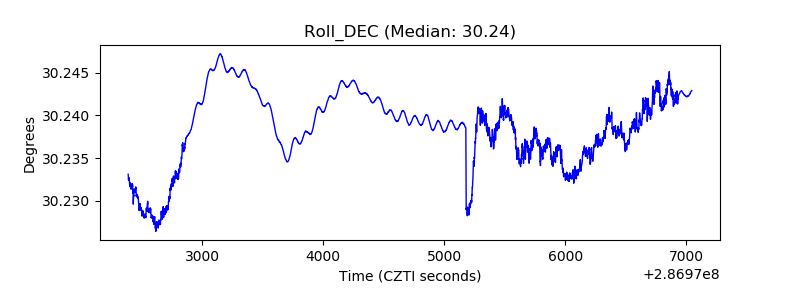 |
| _Roll_RA | 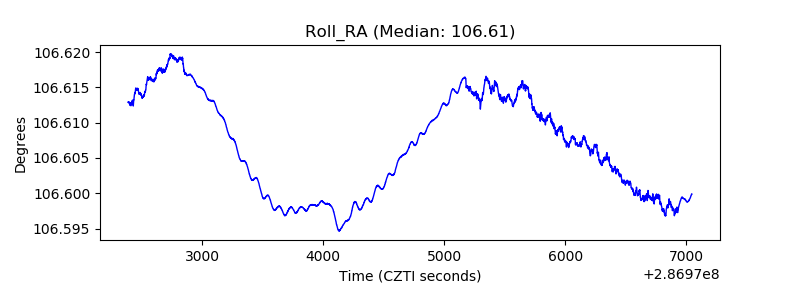 |
| Veto Counter | 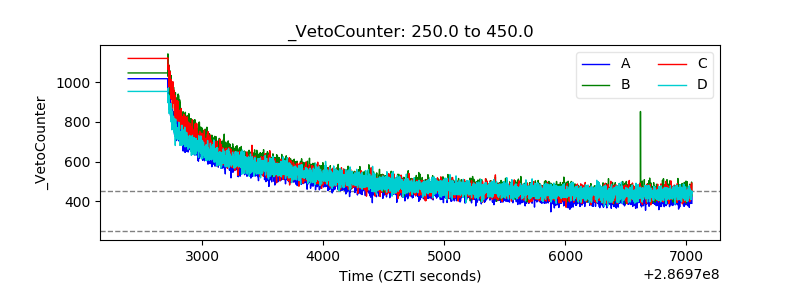 |