| Param | Original file | Final file |
|---|---|---|
| Filename | modeM0/AS1A05_082T08_9000002698cztM0_level2.fits | modeM0/AS1A05_082T08_9000002698cztM0_level2_quad_clean.evt |
| Size (bytes) | 391,305,600 | 304,211,520 |
| Size | 373.2 MB | 290.1 MB |
| Events in quadrant A | 2,416,198 | 1,684,612 |
| Events in quadrant B | 2,307,088 | 1,697,213 |
| Events in quadrant C | 2,346,728 | 1,622,745 |
| Events in quadrant D | 2,013,930 | 1,440,735 |
| Mode M0 | |||
|---|---|---|---|
| Quadrant | BADHDUFLAG | Total packets | Discarded packets |
| A | 0 | 85731 | 0 |
| B | 0 | 86752 | 0 |
| C | 0 | 84119 | 0 |
| D | 0 | 113695 | 0 |
| Mode SS | |||
|---|---|---|---|
| Quadrant | BADHDUFLAG | Total packets | Discarded packets |
| A | 0 | 822 | 0 |
| B | 0 | 822 | 0 |
| C | 0 | 822 | 0 |
| D | 0 | 822 | 0 |
| Mode M9 | |||
|---|---|---|---|
| Quadrant | BADHDUFLAG | Total packets | Discarded packets |
| A | 0 | 58 | 0 |
| B | 0 | 58 | 0 |
| C | 0 | 58 | 0 |
| D | 0 | 58 | 0 |
| Quadrant | Total seconds | Saturated seconds | Saturation percentage |
|---|---|---|---|
| A | 40285 | 415 | 1.030160% |
| B | 40283 | 449 | 1.114614% |
| C | 40279 | 483 | 1.199136% |
| D | 40280 | 2134 | 5.297915% |
Noise dominated data is calculated using 1-second bins in cleaned event files. If a bin has >2000 counts, and if more than 50% of those come from <1% of pixels, then it is considered to be noise-dominated and hence unusable.
| Quadrant | # 1 sec bins | Bins with >0 counts | Bins with >2000 counts | High rate bins dominated by noise | Noise dominated (total time) | Noise dominated (detector-on time) | Marked lightcurve |
|---|---|---|---|---|---|---|---|
| A | 46161 | 40296 | 0 | 0 | 0.00% | 0.00% |  |
| B | 46161 | 40296 | 0 | 0 | 0.00% | 0.00% |  |
| C | 46161 | 40295 | 0 | 0 | 0.00% | 0.00% |  |
| D | 46161 | 40267 | 0 | 0 | 0.00% | 0.00% |  |
Top three noisy pixels from each quadrant. If the there are fewer than three noisy pixels in the level2.evt file, extra rows are filled as -1
| Pixel properties | Quadrant properties | ||||||
|---|---|---|---|---|---|---|---|
| Quadrant | DetID | PixID | Counts | Sigma | Mean | Median | Sigma |
| A | 0 | 29 | 2232 | 10.62 | 629 | 590 | 154.6 |
| A | 7 | 110 | 1933 | 8.68 | 629 | 590 | 154.6 |
| A | 0 | 30 | 1865 | 8.25 | 629 | 590 | 154.6 |
| B | 2 | 9 | 1929 | 11.19 | 608 | 581 | 120.5 |
| B | 2 | 8 | 1667 | 9.02 | 608 | 581 | 120.5 |
| B | 5 | 232 | 1510 | 7.71 | 608 | 581 | 120.5 |
| C | 1 | 80 | 1761 | 7.43 | 618 | 576 | 159.4 |
| C | 1 | 81 | 1685 | 6.96 | 618 | 576 | 159.4 |
| C | 12 | 241 | 1673 | 6.88 | 618 | 576 | 159.4 |
| D | 3 | 14 | 1524 | 6.52 | 574 | 522 | 153.7 |
| D | 10 | 190 | 1519 | 6.49 | 574 | 522 | 153.7 |
| D | 6 | 231 | 1470 | 6.17 | 574 | 522 | 153.7 |
Histogram calculated using DETX and DETY for each event in the final _common_clean file
| Quadrant A | 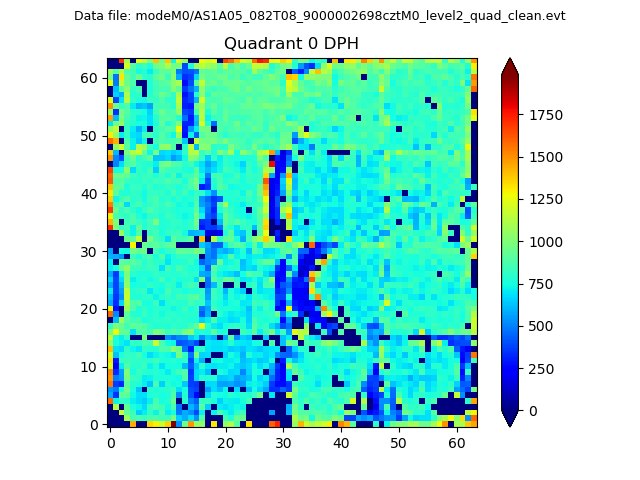 |
 |
Quadrant B |
|---|---|---|---|
| Quadrant D | 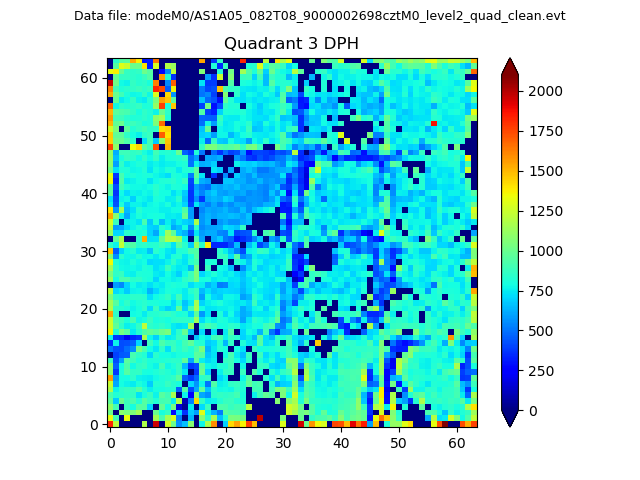 |
 |
Quadrant C |
| Plot type | Count rate plots | Images |
|---|---|---|
| Comparison with Poisson distribution Blue bars denote a histogram of data divided into 1 sec bins. Red curve is a Poisson curve with rate = median count rate of data. |
 |
 |
| Quadrant-wise count rates Data is divided into 100 sec bins |
 |
|
| Module-wise count rates for Quadrant A Data is divided into 100 sec bins |
 |
 |
| Module-wise count rates for Quadrant B Data is divided into 100 sec bins |
 |
 |
| Module-wise count rates for Quadrant C Data is divided into 100 sec bins |
 |
 |
| Module-wise count rates for Quadrant D Data is divided into 100 sec bins |
 |
 |
| Parameter | Plot |
|---|---|
| CZT HV Monitor |  |
| D_VDD |  |
| Temperature 1 |  |
| Veto HV Monitor |  |
| Veto LLD | 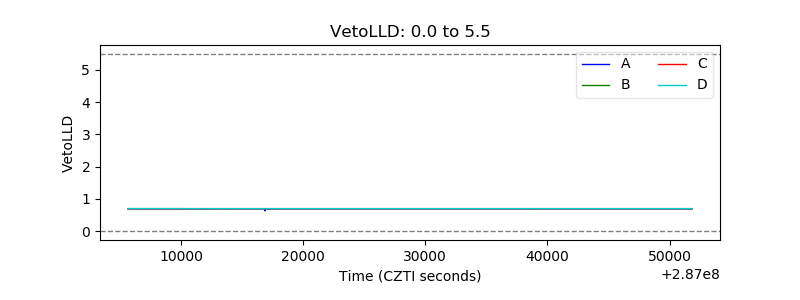 |
| Alpha Counter |  |
| _CPM_Rate |  |
| CZT Counter |  |
| +2.5 Volts monitor |  |
| +5 Volts monitor |  |
| _ROLL_ROT |  |
| _Roll_DEC |  |
| _Roll_RA |  |
| Veto Counter |  |