| Param | Original file | Final file |
|---|---|---|
| Filename | modeM0/AS1A05_082T08_9000002698_18144cztM0_level2.evt | modeM0/AS1A05_082T08_9000002698_18144cztM0_level2_quad_clean.evt |
| Size (bytes) | 587,122,560 | 111,867,840 |
| Size | 559.9 MB | 106.7 MB |
| Events in quadrant A | 4,143,444 | 710,430 |
| Events in quadrant B | 4,022,948 | 722,494 |
| Events in quadrant C | 3,925,267 | 697,365 |
| Events in quadrant D | 5,123,644 | 678,595 |
| Mode M0 | |||
|---|---|---|---|
| Quadrant | BADHDUFLAG | Total packets | Discarded packets |
| A | 0 | 18385 | 180 |
| B | 0 | 17787 | 189 |
| C | 0 | 17499 | 197 |
| D | 0 | 21319 | 246 |
| Mode SS | |||
|---|---|---|---|
| Quadrant | BADHDUFLAG | Total packets | Discarded packets |
| A | 0 | 172 | 2 |
| B | 0 | 172 | 0 |
| C | 0 | 172 | 0 |
| D | 0 | 172 | 0 |
| Mode M9 | |||
|---|---|---|---|
| Quadrant | BADHDUFLAG | Total packets | Discarded packets |
| A | 0 | 8 | 0 |
| B | 0 | 8 | 0 |
| C | 0 | 8 | 0 |
| D | 0 | 8 | 0 |
| Quadrant | Total seconds | Saturated seconds | Saturation percentage |
|---|---|---|---|
| A | 8342 | 150 | 1.798130% |
| B | 8335 | 145 | 1.739652% |
| C | 8332 | 154 | 1.848296% |
| D | 8323 | 216 | 2.595218% |
Noise dominated data is calculated using 1-second bins in cleaned event files. If a bin has >2000 counts, and if more than 50% of those come from <1% of pixels, then it is considered to be noise-dominated and hence unusable.
| Quadrant | # 1 sec bins | Bins with >0 counts | Bins with >2000 counts | High rate bins dominated by noise | Noise dominated (total time) | Noise dominated (detector-on time) | Marked lightcurve |
|---|---|---|---|---|---|---|---|
| A | 9255 | 8418 | 5 | 5 | 0.05% | 0.06% | 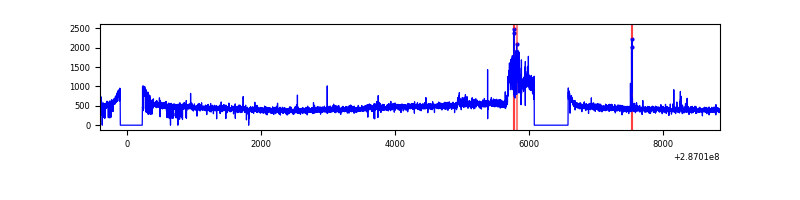 |
| B | 9256 | 8413 | 5 | 5 | 0.05% | 0.06% | 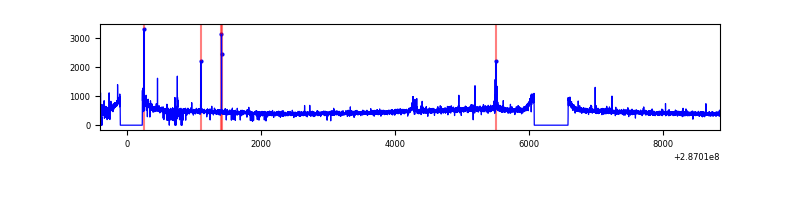 |
| C | 9254 | 8413 | 0 | 0 | 0.00% | 0.00% | 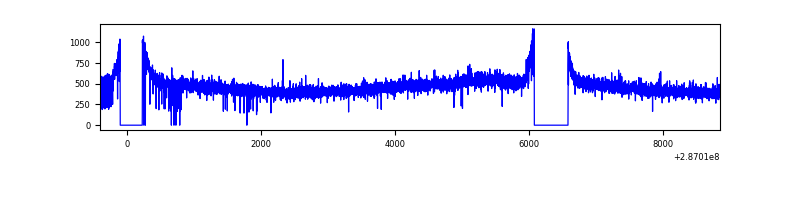 |
| D | 9256 | 8413 | 116 | 116 | 1.25% | 1.38% | 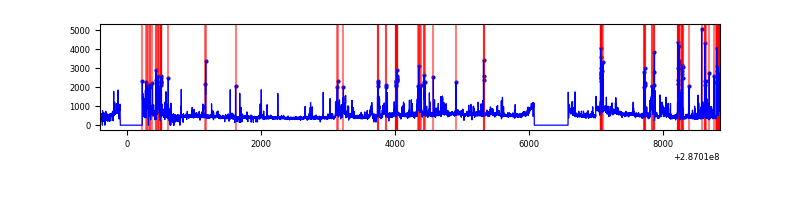 |
Top three noisy pixels from each quadrant. If the there are fewer than three noisy pixels in the level2.evt file, extra rows are filled as -1
| Pixel properties | Quadrant properties | ||||||
|---|---|---|---|---|---|---|---|
| Quadrant | DetID | PixID | Counts | Sigma | Mean | Median | Sigma |
| A | 15 | 174 | 293418 | 1431.71 | 998 | 978 | 204.3 |
| A | 4 | 2 | 12939 | 58.56 | 998 | 978 | 204.3 |
| A | 0 | 226 | 8720 | 37.9 | 998 | 978 | 204.3 |
| B | 3 | 64 | 24381 | 120.57 | 1003 | 973 | 194.1 |
| B | 0 | 230 | 23962 | 118.41 | 1003 | 973 | 194.1 |
| B | 12 | 111 | 23681 | 116.96 | 1003 | 973 | 194.1 |
| C | 14 | 238 | 147212 | 641.62 | 960 | 965 | 227.9 |
| C | 3 | 233 | 25864 | 109.24 | 960 | 965 | 227.9 |
| C | 13 | 61 | 7041 | 26.66 | 960 | 965 | 227.9 |
| D | 11 | 176 | 422217 | 1765.09 | 962 | 933 | 238.7 |
| D | 10 | 70 | 418777 | 1750.68 | 962 | 933 | 238.7 |
| D | 7 | 238 | 389015 | 1625.98 | 962 | 933 | 238.7 |
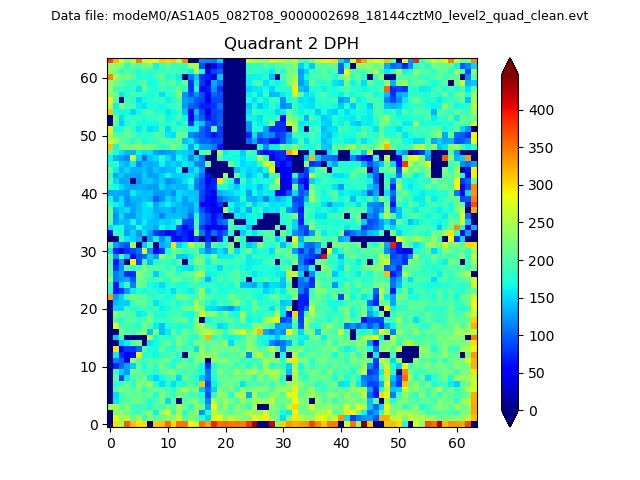
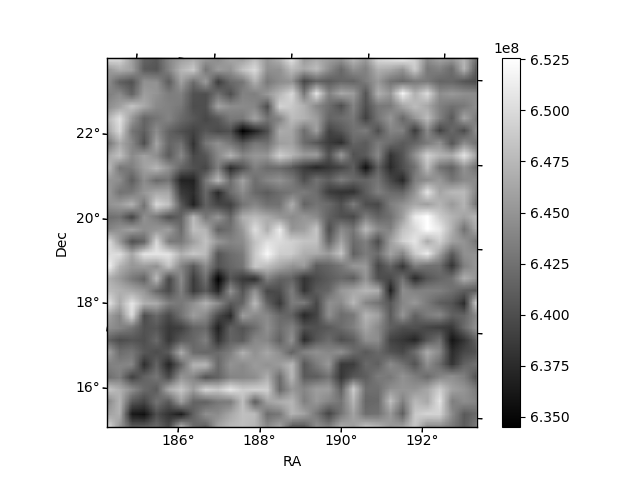
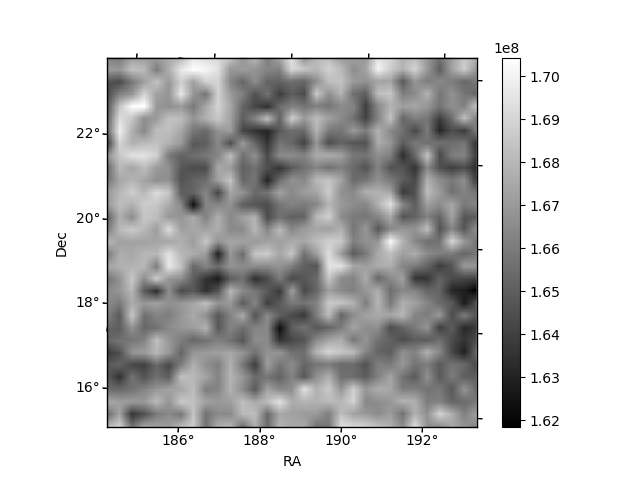
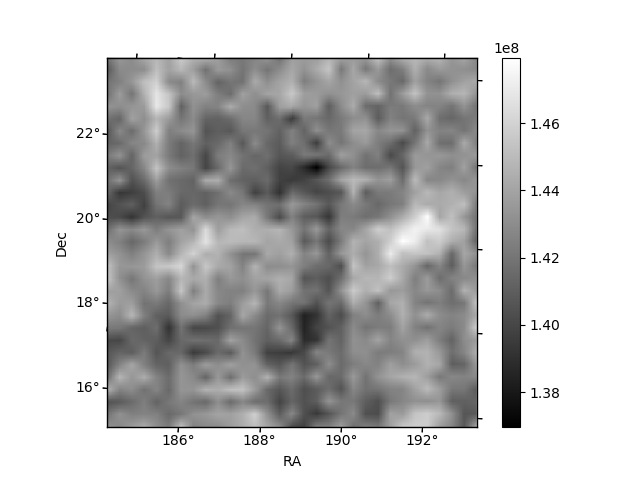
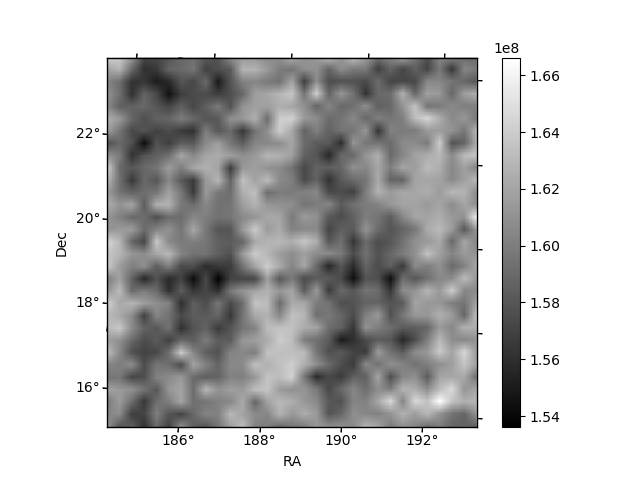
Histogram calculated using DETX and DETY for each event in the final _common_clean file
| Quadrant A | 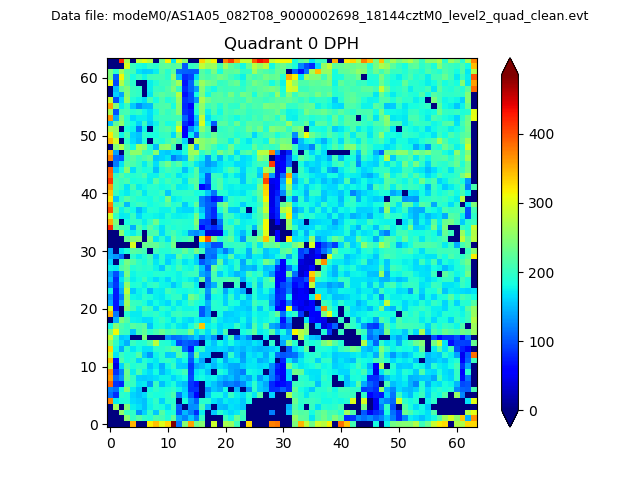 |
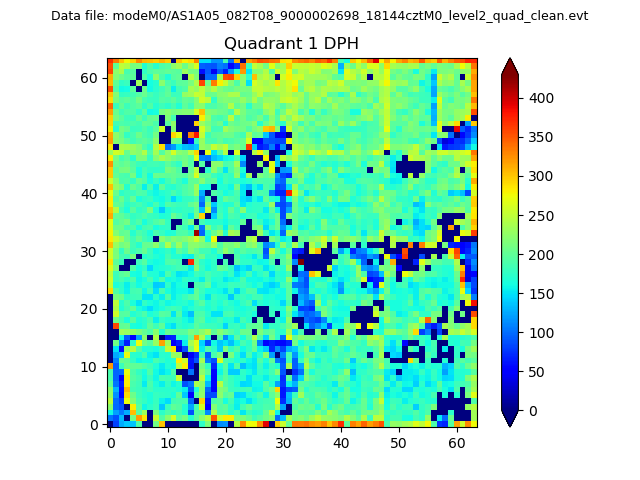 |
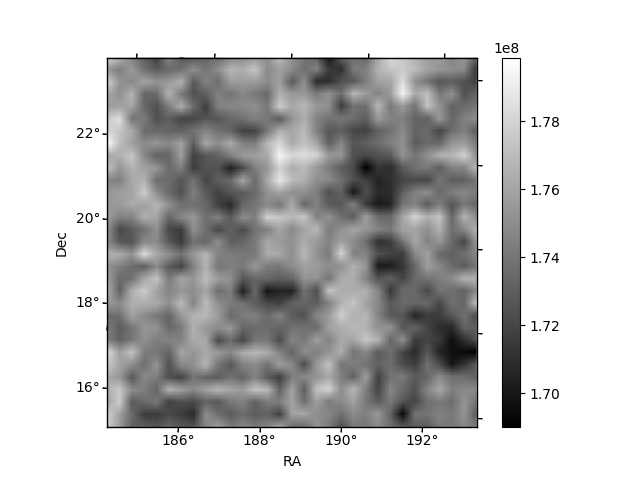
Quadrant B |
|---|---|---|---|
| Quadrant D | 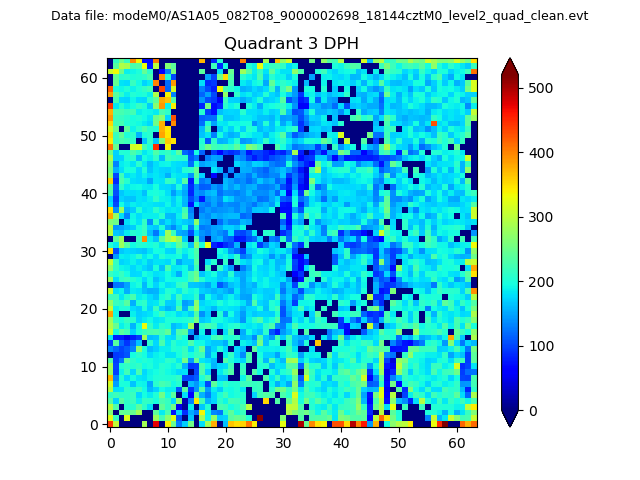 |
 |
Quadrant C |
| Plot type | Count rate plots | Images |
|---|---|---|
| Comparison with Poisson distribution Blue bars denote a histogram of data divided into 1 sec bins. Red curve is a Poisson curve with rate = median count rate of data. |
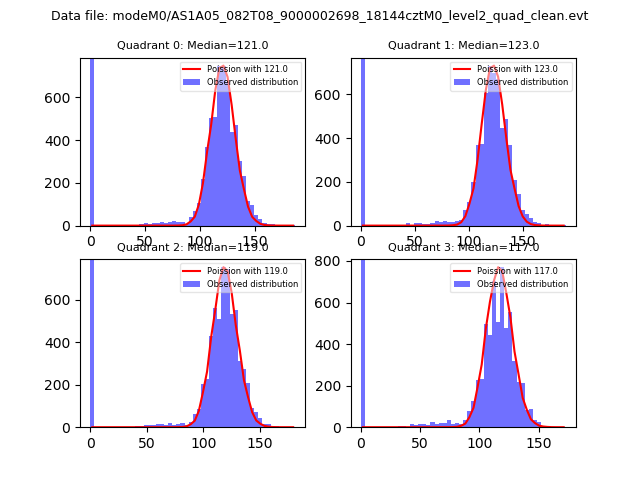 |
 |
| Quadrant-wise count rates Data is divided into 100 sec bins |
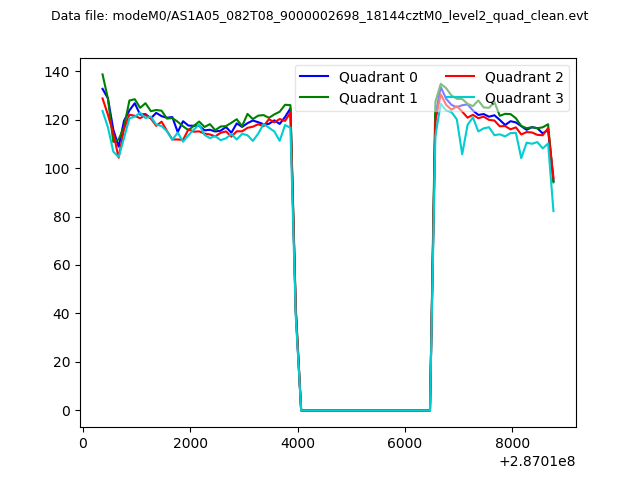 |
|
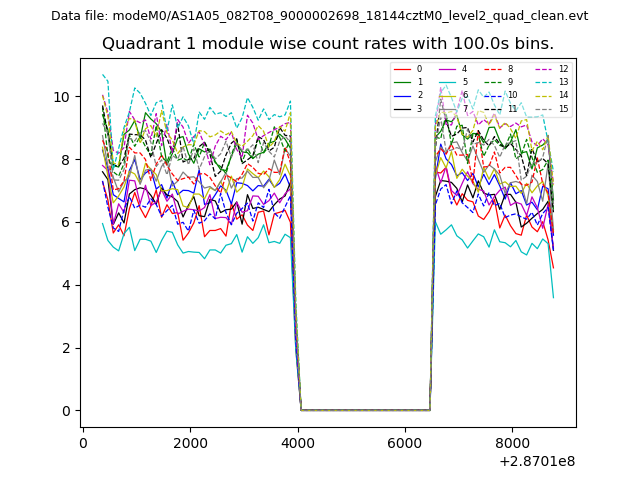
| Module-wise count rates for Quadrant A Data is divided into 100 sec bins |
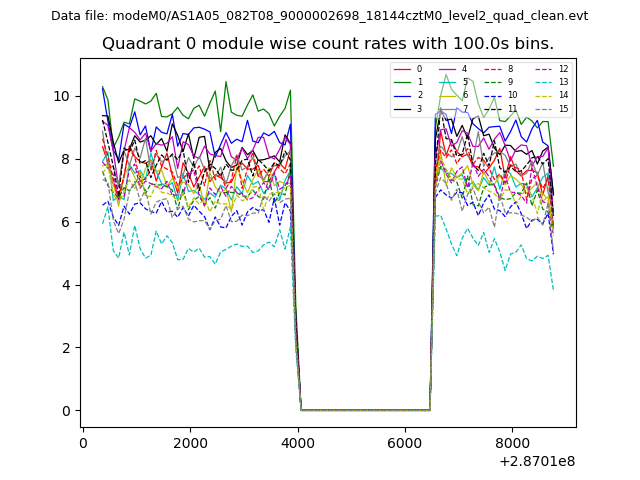 |
 |
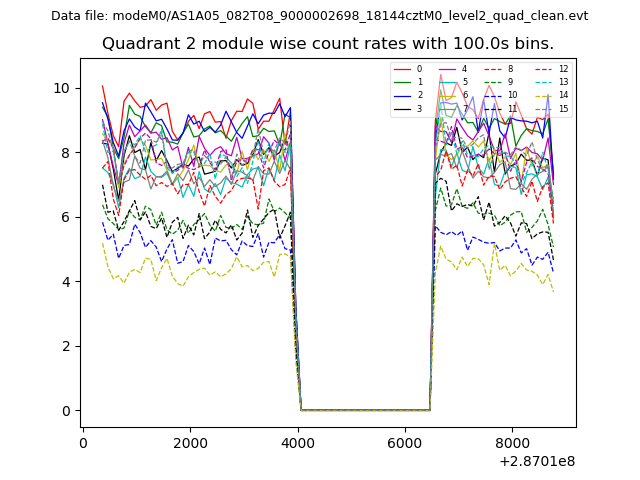
| Module-wise count rates for Quadrant B Data is divided into 100 sec bins |
 |
 |
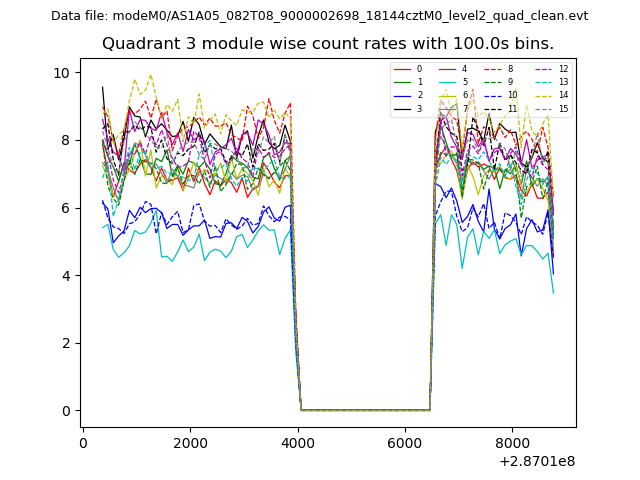
| Module-wise count rates for Quadrant C Data is divided into 100 sec bins |
 |
 |
| Module-wise count rates for Quadrant D Data is divided into 100 sec bins |
 |
 |
| Parameter | Plot |
|---|---|
| CZT HV Monitor | 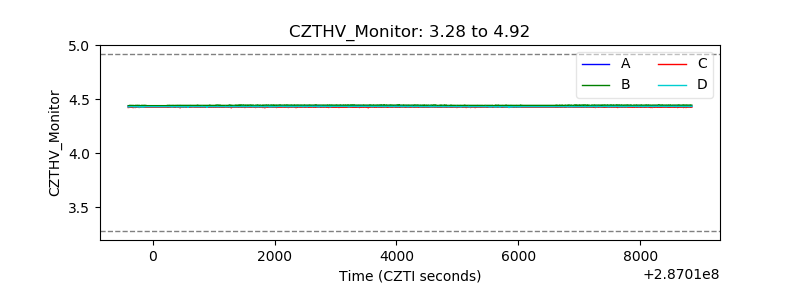 |
| D_VDD | 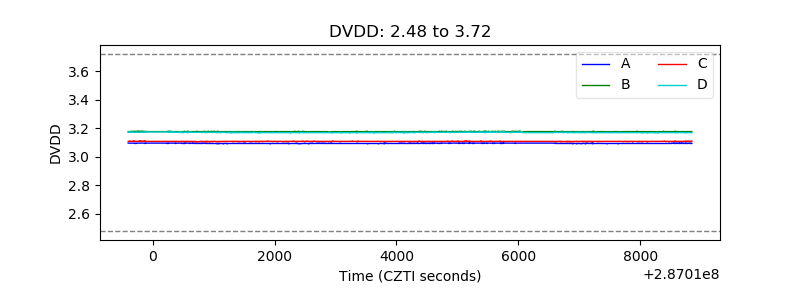 |
| Temperature 1 | 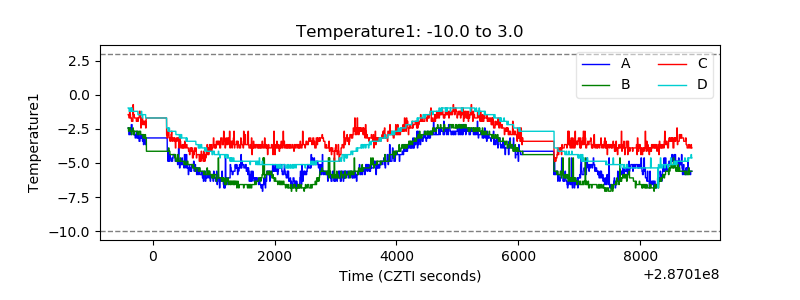 |
| Veto HV Monitor | 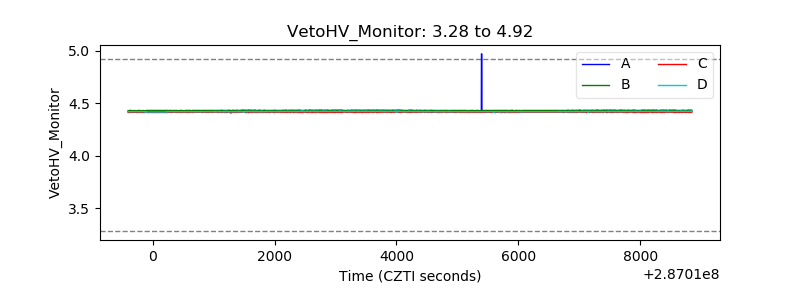 |
| Veto LLD | 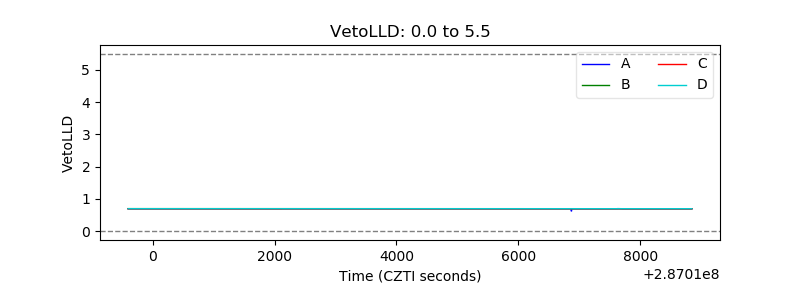 |
| Alpha Counter |  |
| _CPM_Rate | 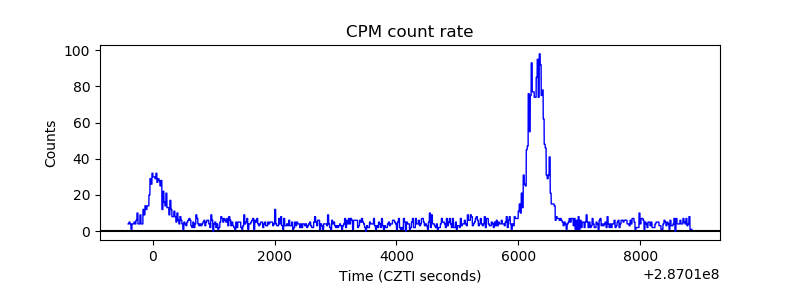 |
| CZT Counter | 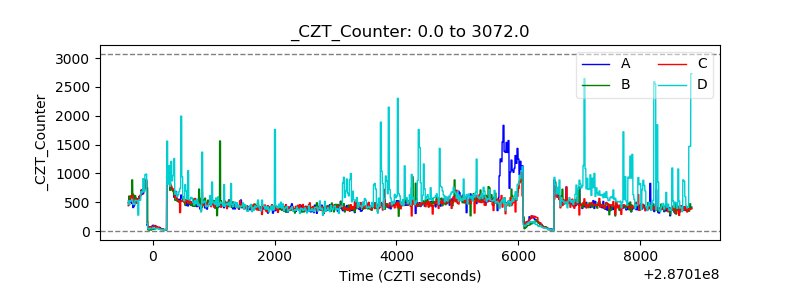 |
| +2.5 Volts monitor |  |
| +5 Volts monitor |  |
| _ROLL_ROT | 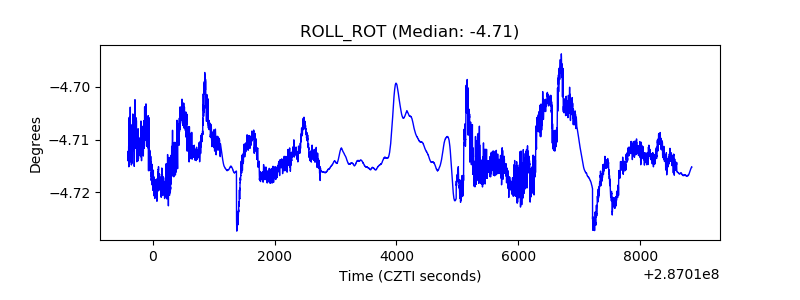 |
| _Roll_DEC | 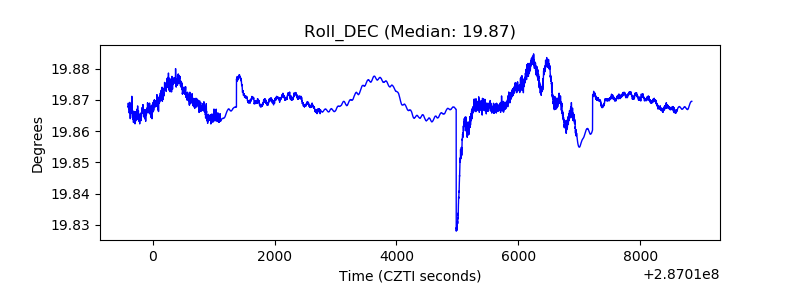 |
| _Roll_RA | 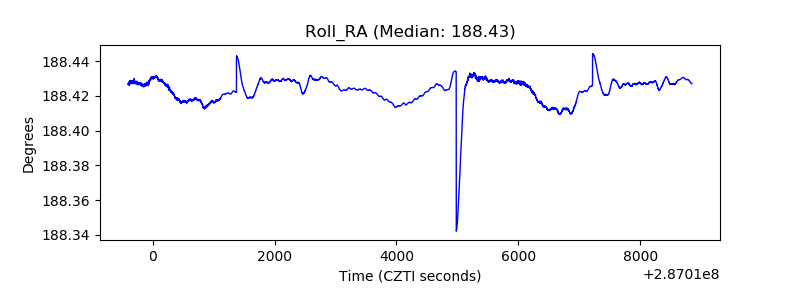 |
| Veto Counter | 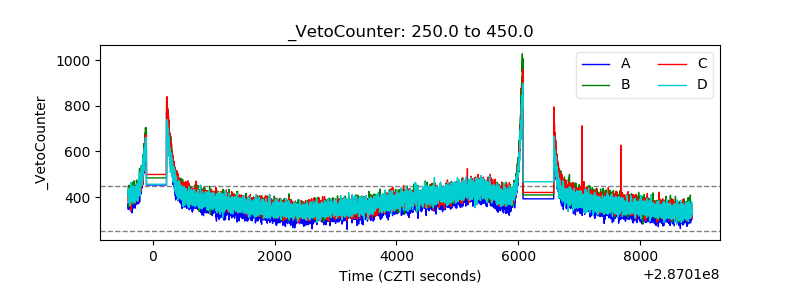 |