| Param | Original file | Final file |
|---|---|---|
| Filename | modeM0/AS1A05_082T08_9000002698_18145cztM0_level2.evt | modeM0/AS1A05_082T08_9000002698_18145cztM0_level2_quad_clean.evt |
| Size (bytes) | 907,715,520 | 138,985,920 |
| Size | 865.7 MB | 132.5 MB |
| Events in quadrant A | 5,687,876 | 869,508 |
| Events in quadrant B | 5,603,404 | 885,870 |
| Events in quadrant C | 5,568,113 | 857,771 |
| Events in quadrant D | 9,851,383 | 798,596 |
| Mode M0 | |||
|---|---|---|---|
| Quadrant | BADHDUFLAG | Total packets | Discarded packets |
| A | 0 | 24828 | 2 |
| B | 0 | 24291 | 2 |
| C | 0 | 24356 | 2 |
| D | 0 | 37119 | 2 |
| Mode SS | |||
|---|---|---|---|
| Quadrant | BADHDUFLAG | Total packets | Discarded packets |
| A | 0 | 236 | 0 |
| B | 0 | 236 | 0 |
| C | 0 | 236 | 0 |
| D | 0 | 236 | 0 |
| Mode M9 | |||
|---|---|---|---|
| Quadrant | BADHDUFLAG | Total packets | Discarded packets |
| A | 0 | 15 | 0 |
| B | 0 | 15 | 0 |
| C | 0 | 15 | 0 |
| D | 0 | 15 | 0 |
| Quadrant | Total seconds | Saturated seconds | Saturation percentage |
|---|---|---|---|
| A | 11516 | 126 | 1.094130% |
| B | 11516 | 119 | 1.033345% |
| C | 11516 | 119 | 1.033345% |
| D | 11516 | 1302 | 11.306009% |
Noise dominated data is calculated using 1-second bins in cleaned event files. If a bin has >2000 counts, and if more than 50% of those come from <1% of pixels, then it is considered to be noise-dominated and hence unusable.
| Quadrant | # 1 sec bins | Bins with >0 counts | Bins with >2000 counts | High rate bins dominated by noise | Noise dominated (total time) | Noise dominated (detector-on time) | Marked lightcurve |
|---|---|---|---|---|---|---|---|
| A | 13101 | 11518 | 31 | 31 | 0.24% | 0.27% | 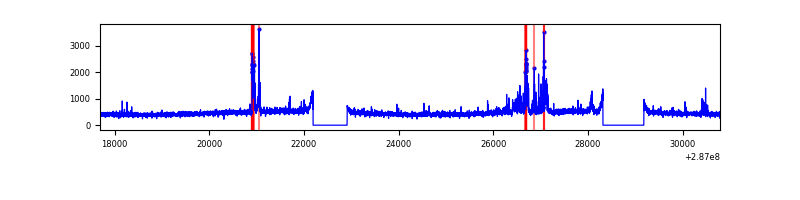 |
| B | 13101 | 11518 | 16 | 16 | 0.12% | 0.14% | 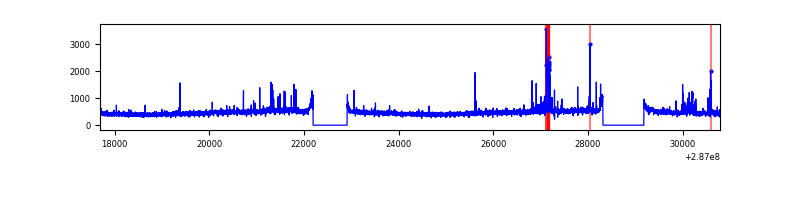 |
| C | 13101 | 11518 | 2 | 2 | 0.02% | 0.02% | 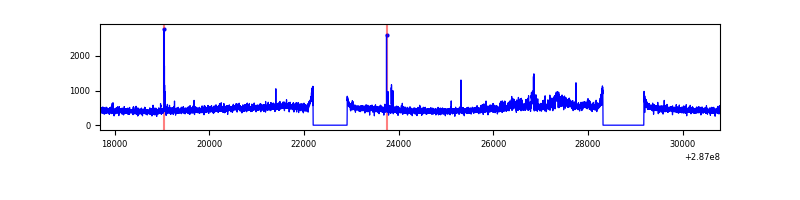 |
| D | 13101 | 11517 | 1072 | 1072 | 8.18% | 9.31% | 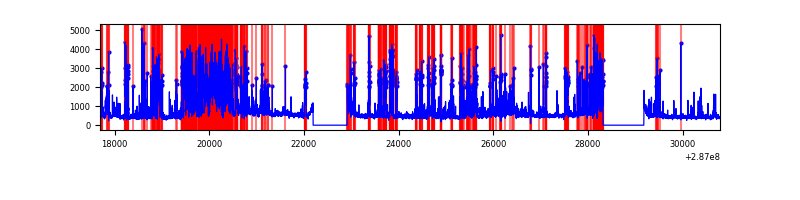 |
Top three noisy pixels from each quadrant. If the there are fewer than three noisy pixels in the level2.evt file, extra rows are filled as -1
| Pixel properties | Quadrant properties | ||||||
|---|---|---|---|---|---|---|---|
| Quadrant | DetID | PixID | Counts | Sigma | Mean | Median | Sigma |
| A | 15 | 174 | 449792 | 1624.68 | 1362 | 1334 | 276.0 |
| A | 0 | 226 | 11714 | 37.6 | 1362 | 1334 | 276.0 |
| A | 3 | 137 | 10306 | 32.5 | 1362 | 1334 | 276.0 |
| B | 4 | 171 | 91773 | 347.42 | 1361 | 1325 | 260.3 |
| B | 7 | 220 | 77137 | 291.2 | 1361 | 1325 | 260.3 |
| B | 3 | 64 | 45709 | 170.48 | 1361 | 1325 | 260.3 |
| C | 0 | 207 | 214013 | 693.19 | 1302 | 1309 | 306.8 |
| C | 14 | 238 | 201183 | 651.38 | 1302 | 1309 | 306.8 |
| C | 3 | 233 | 67216 | 214.79 | 1302 | 1309 | 306.8 |
| D | 11 | 176 | 2139151 | 6924.85 | 1265 | 1230 | 308.7 |
| D | 12 | 110 | 1836306 | 5943.92 | 1265 | 1230 | 308.7 |
| D | 7 | 238 | 393404 | 1270.27 | 1265 | 1230 | 308.7 |
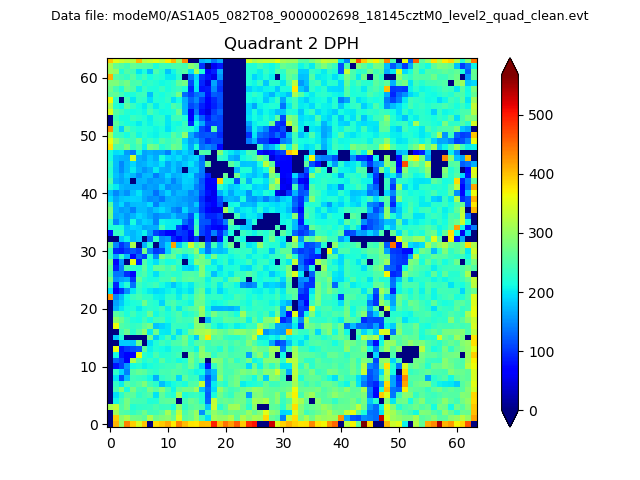
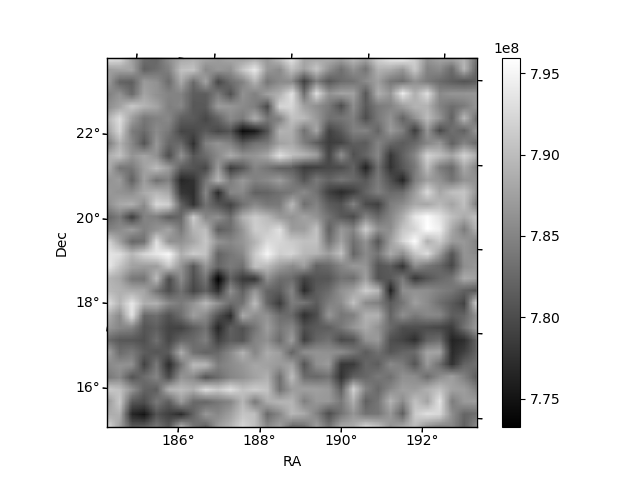
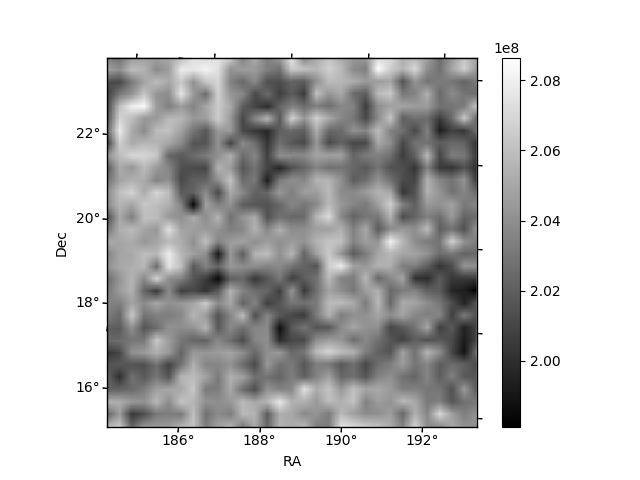
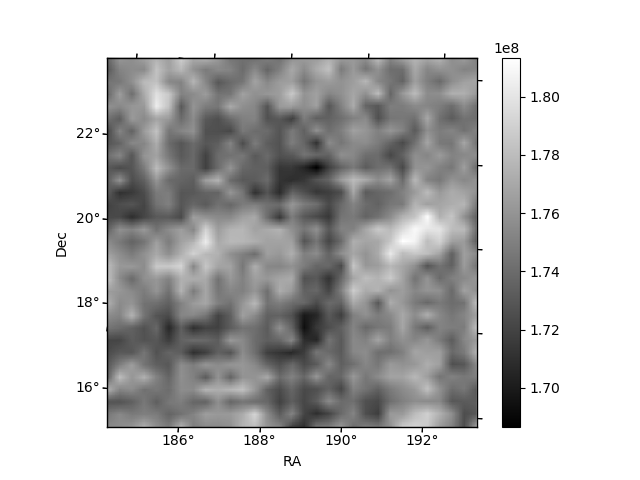
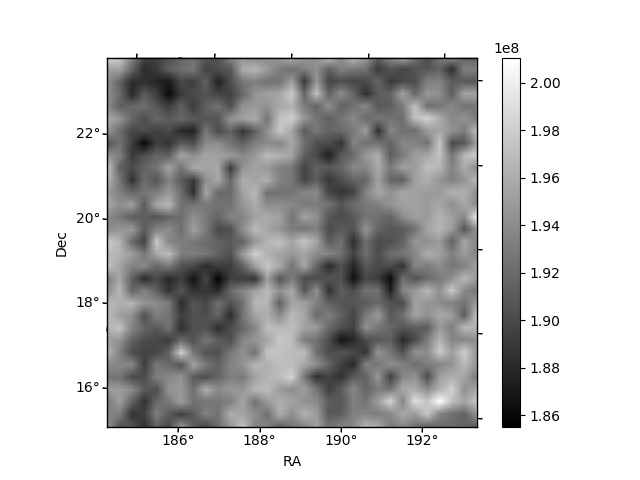
Histogram calculated using DETX and DETY for each event in the final _common_clean file
| Quadrant A | 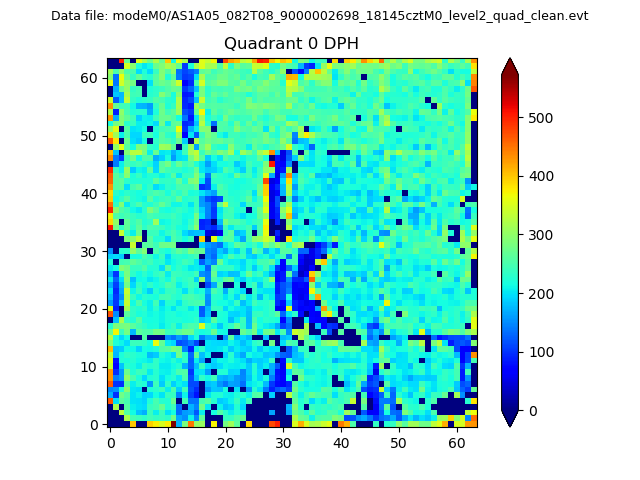 |
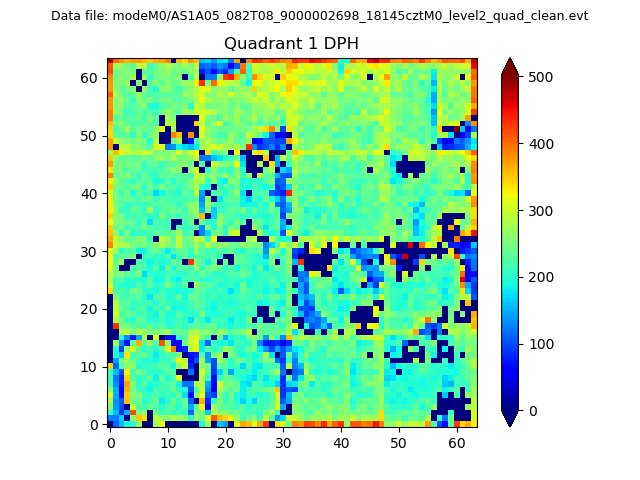 |
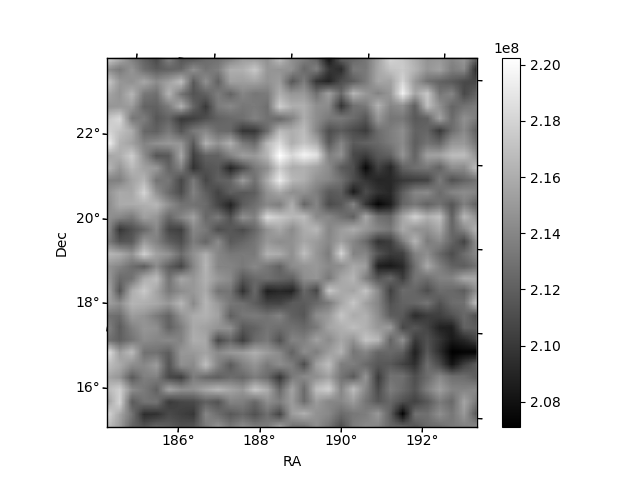
Quadrant B |
|---|---|---|---|
| Quadrant D | 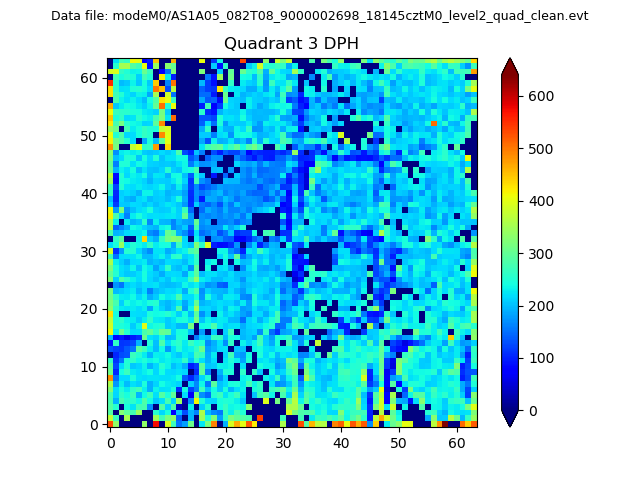 |
 |
Quadrant C |
| Plot type | Count rate plots | Images |
|---|---|---|
| Comparison with Poisson distribution Blue bars denote a histogram of data divided into 1 sec bins. Red curve is a Poisson curve with rate = median count rate of data. |
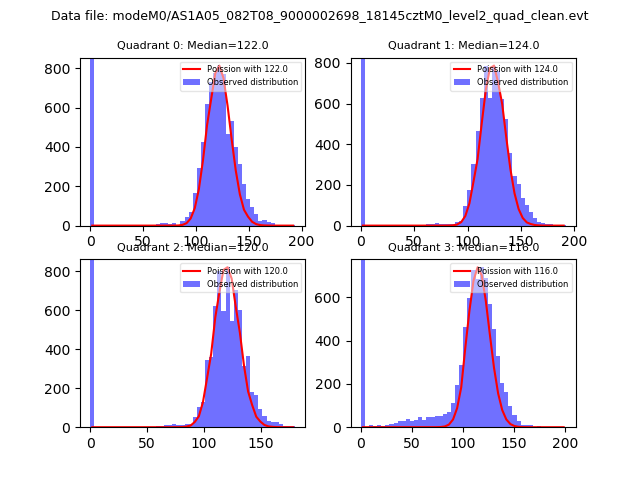 |
 |
| Quadrant-wise count rates Data is divided into 100 sec bins |
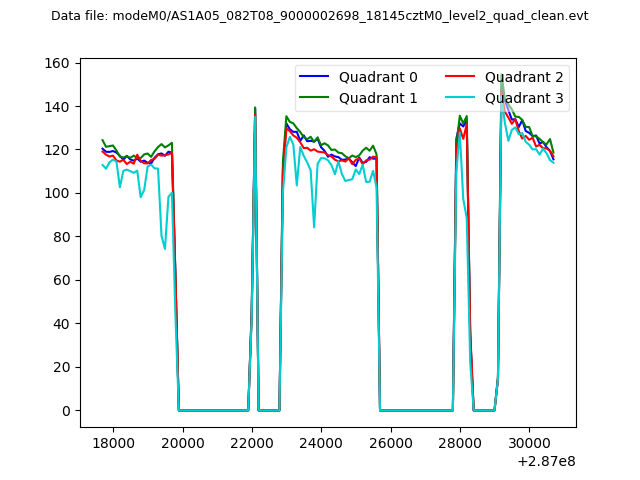 |
|
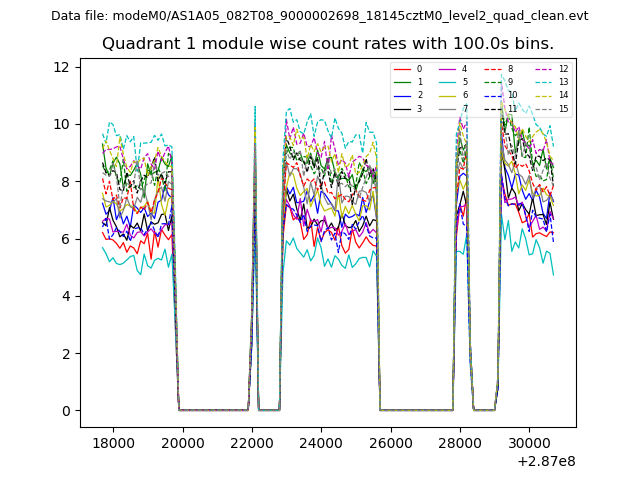
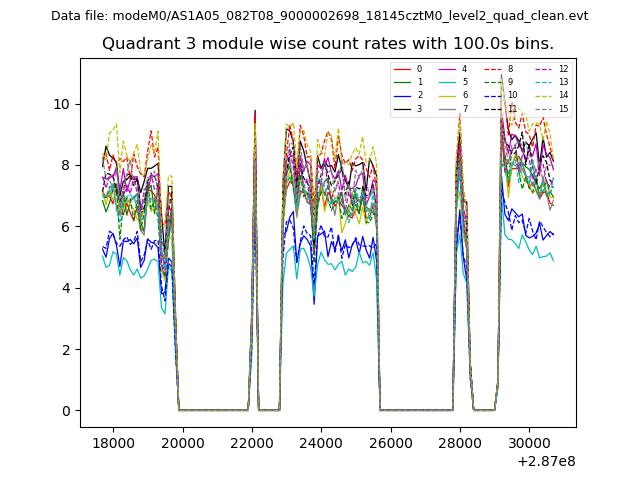
| Module-wise count rates for Quadrant A Data is divided into 100 sec bins |
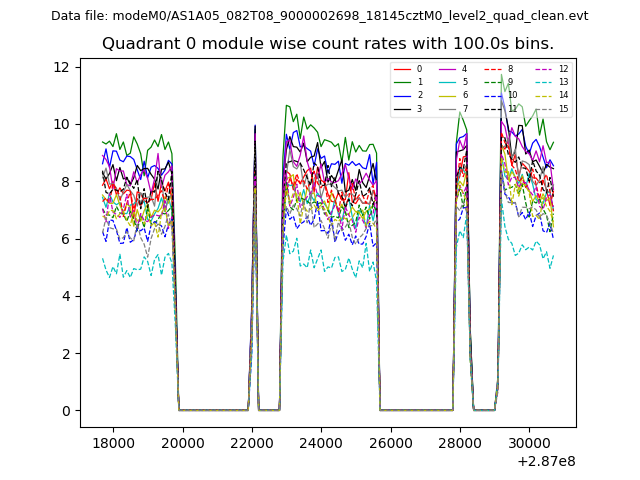 |
 |
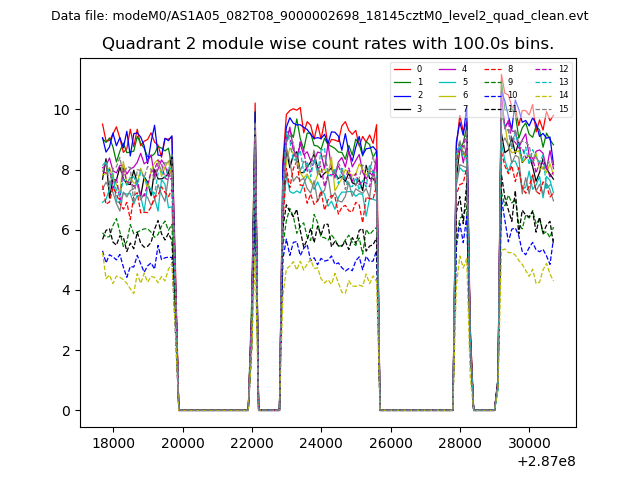
| Module-wise count rates for Quadrant B Data is divided into 100 sec bins |
 |
 |
| Module-wise count rates for Quadrant C Data is divided into 100 sec bins |
 |
 |
| Module-wise count rates for Quadrant D Data is divided into 100 sec bins |
 |
 |
| Parameter | Plot |
|---|---|
| CZT HV Monitor | 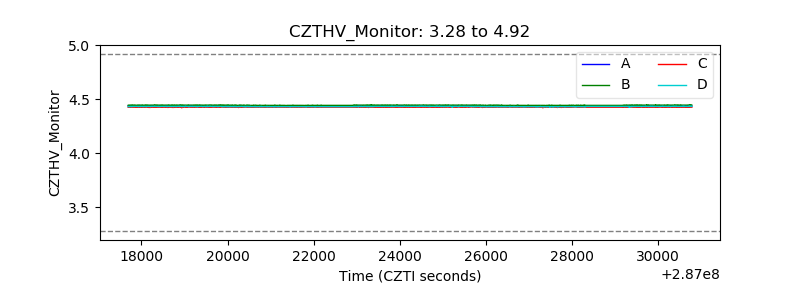 |
| D_VDD |  |
| Temperature 1 | 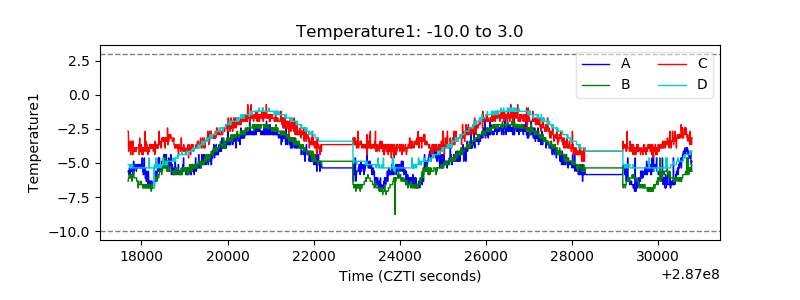 |
| Veto HV Monitor |  |
| Veto LLD | 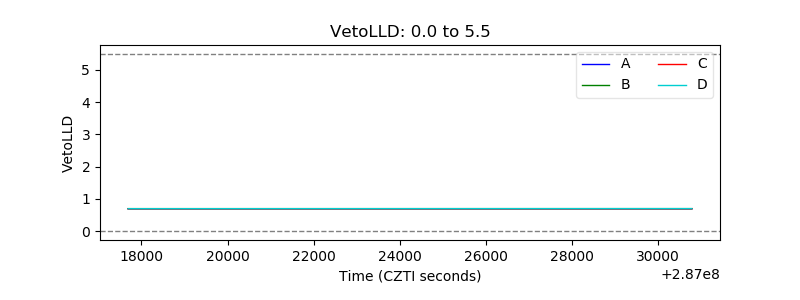 |
| Alpha Counter | 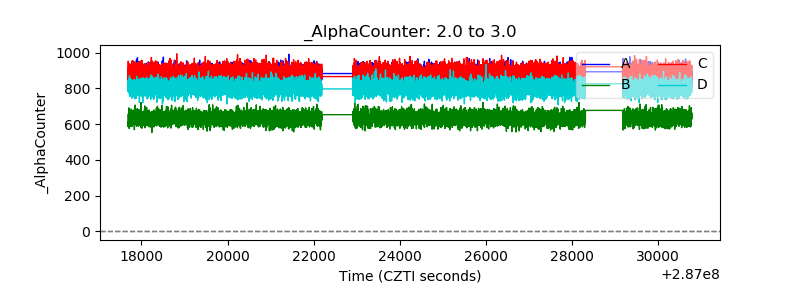 |
| _CPM_Rate | 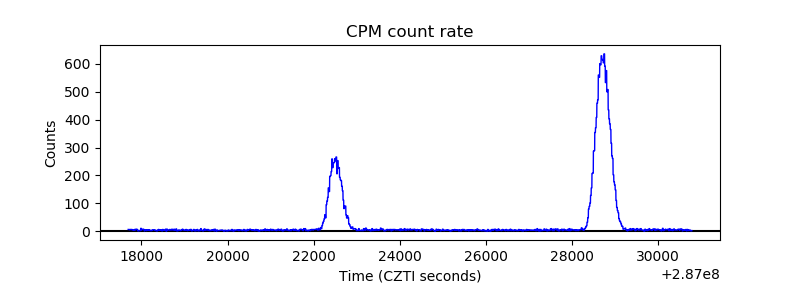 |
| CZT Counter | 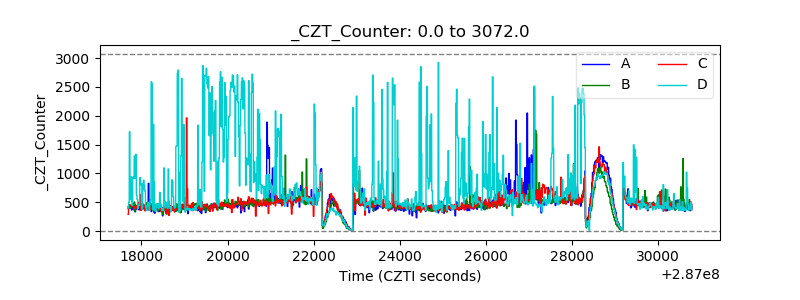 |
| +2.5 Volts monitor | 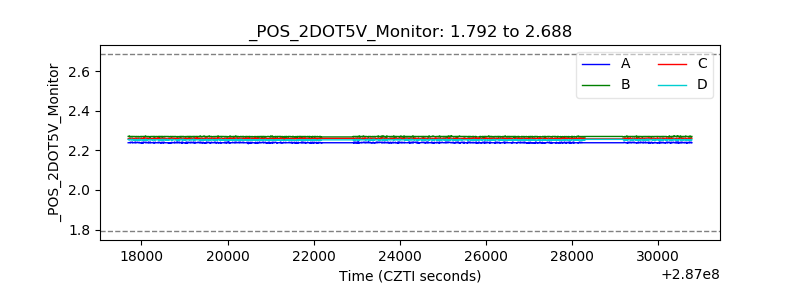 |
| +5 Volts monitor |  |
| _ROLL_ROT | 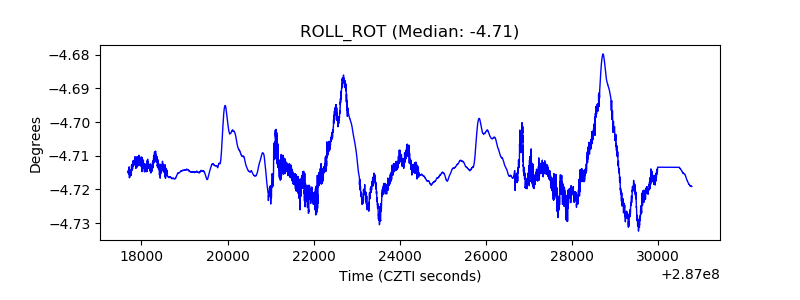 |
| _Roll_DEC | 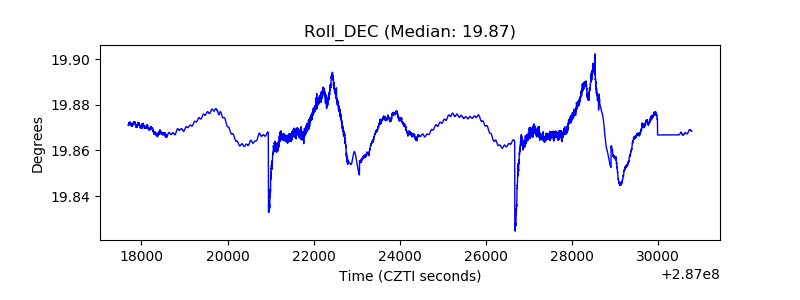 |
| _Roll_RA | 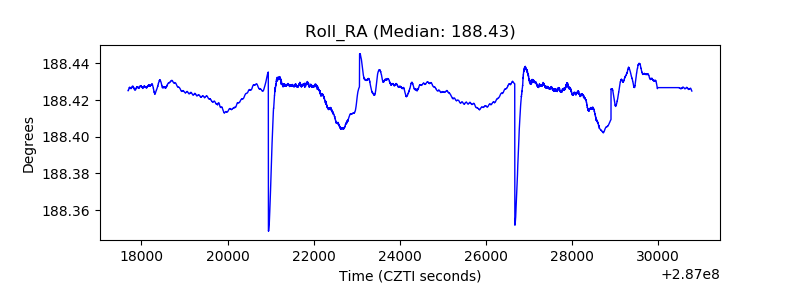 |
| Veto Counter | 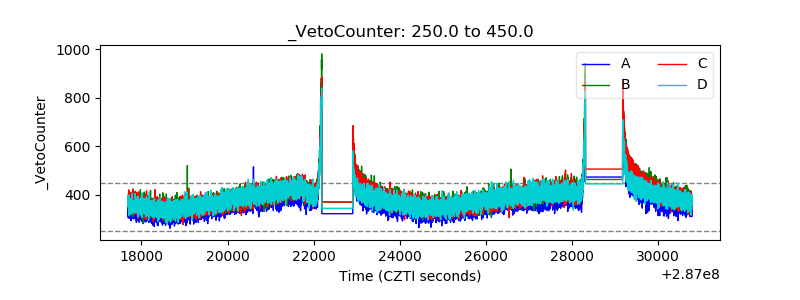 |