| Param | Original file | Final file |
|---|---|---|
| Filename | modeM0/AS1A05_082T08_9000002698_18146cztM0_level2.evt | modeM0/AS1A05_082T08_9000002698_18146cztM0_level2_quad_clean.evt |
| Size (bytes) | 492,238,080 | 95,495,040 |
| Size | 469.4 MB | 91.1 MB |
| Events in quadrant A | 3,220,339 | 611,606 |
| Events in quadrant B | 3,854,879 | 619,456 |
| Events in quadrant C | 3,257,509 | 598,031 |
| Events in quadrant D | 4,111,635 | 587,535 |
| Mode M0 | |||
|---|---|---|---|
| Quadrant | BADHDUFLAG | Total packets | Discarded packets |
| A | 0 | 13968 | 2 |
| B | 0 | 16040 | 2 |
| C | 0 | 13996 | 2 |
| D | 0 | 16995 | 2 |
| Mode SS | |||
|---|---|---|---|
| Quadrant | BADHDUFLAG | Total packets | Discarded packets |
| A | 0 | 138 | 0 |
| B | 0 | 138 | 0 |
| C | 0 | 138 | 0 |
| D | 0 | 138 | 0 |
| Mode M9 | |||
|---|---|---|---|
| Quadrant | BADHDUFLAG | Total packets | Discarded packets |
| A | 0 | 14 | 0 |
| B | 0 | 15 | 0 |
| C | 0 | 15 | 0 |
| D | 0 | 15 | 0 |
| Quadrant | Total seconds | Saturated seconds | Saturation percentage |
|---|---|---|---|
| A | 6824 | 39 | 0.571512% |
| B | 6824 | 55 | 0.805979% |
| C | 6824 | 67 | 0.981829% |
| D | 6824 | 128 | 1.875733% |
Noise dominated data is calculated using 1-second bins in cleaned event files. If a bin has >2000 counts, and if more than 50% of those come from <1% of pixels, then it is considered to be noise-dominated and hence unusable.
| Quadrant | # 1 sec bins | Bins with >0 counts | Bins with >2000 counts | High rate bins dominated by noise | Noise dominated (total time) | Noise dominated (detector-on time) | Marked lightcurve |
|---|---|---|---|---|---|---|---|
| A | 7859 | 6825 | 2 | 2 | 0.03% | 0.03% | 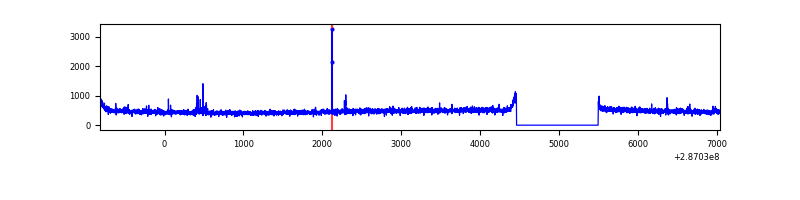 |
| B | 7859 | 6825 | 15 | 15 | 0.19% | 0.22% | 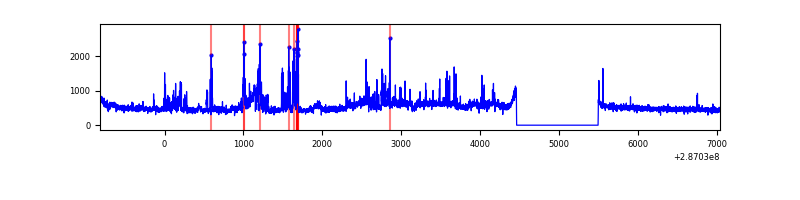 |
| C | 7859 | 6825 | 1 | 1 | 0.01% | 0.01% | 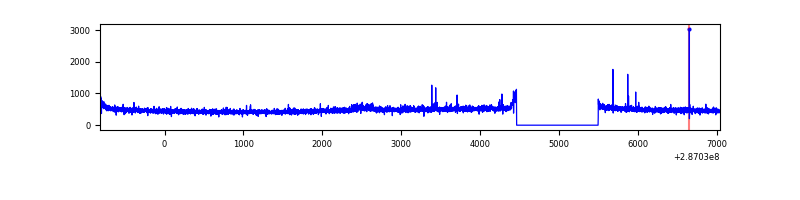 |
| D | 7859 | 6825 | 79 | 79 | 1.01% | 1.16% | 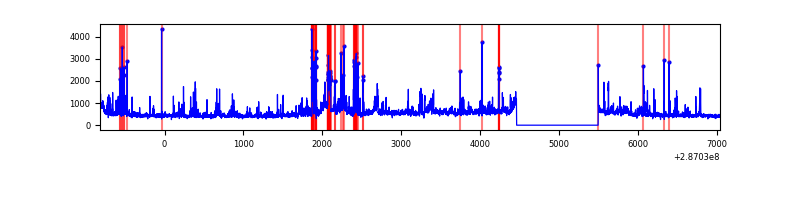 |
Top three noisy pixels from each quadrant. If the there are fewer than three noisy pixels in the level2.evt file, extra rows are filled as -1
| Pixel properties | Quadrant properties | ||||||
|---|---|---|---|---|---|---|---|
| Quadrant | DetID | PixID | Counts | Sigma | Mean | Median | Sigma |
| A | 15 | 174 | 21201 | 121.42 | 829 | 811 | 167.9 |
| A | 3 | 15 | 8415 | 45.28 | 829 | 811 | 167.9 |
| A | 4 | 2 | 7804 | 41.64 | 829 | 811 | 167.9 |
| B | 4 | 171 | 342745 | 2161.1 | 824 | 803 | 158.2 |
| B | 5 | 143 | 186410 | 1173.05 | 824 | 803 | 158.2 |
| B | 7 | 220 | 64658 | 403.57 | 824 | 803 | 158.2 |
| C | 14 | 238 | 122242 | 656.08 | 789 | 795 | 185.1 |
| C | 3 | 233 | 52674 | 280.26 | 789 | 795 | 185.1 |
| C | 13 | 61 | 5619 | 26.06 | 789 | 795 | 185.1 |
| D | 7 | 238 | 385566 | 1966.82 | 798 | 776 | 195.6 |
| D | 11 | 176 | 340422 | 1736.07 | 798 | 776 | 195.6 |
| D | 10 | 70 | 149212 | 758.72 | 798 | 776 | 195.6 |
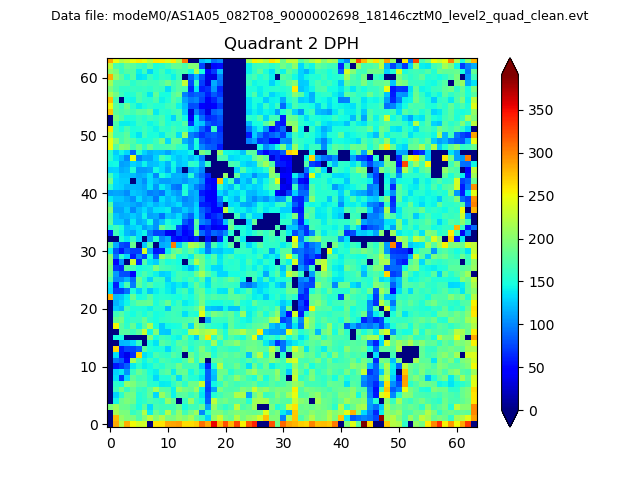
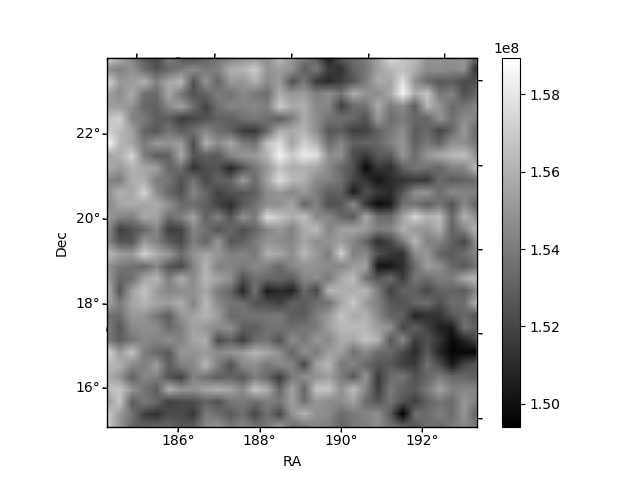
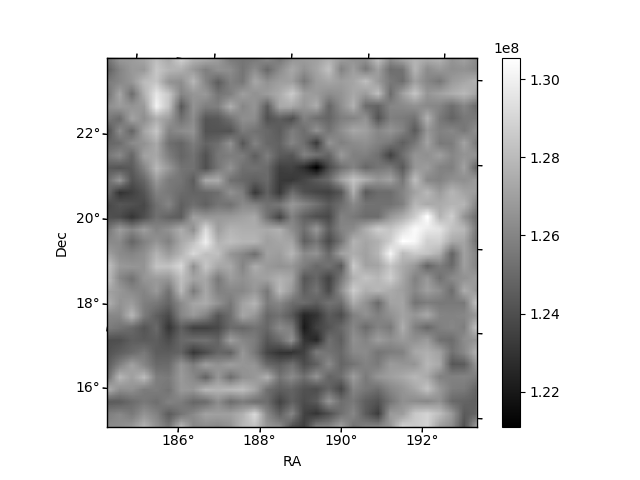
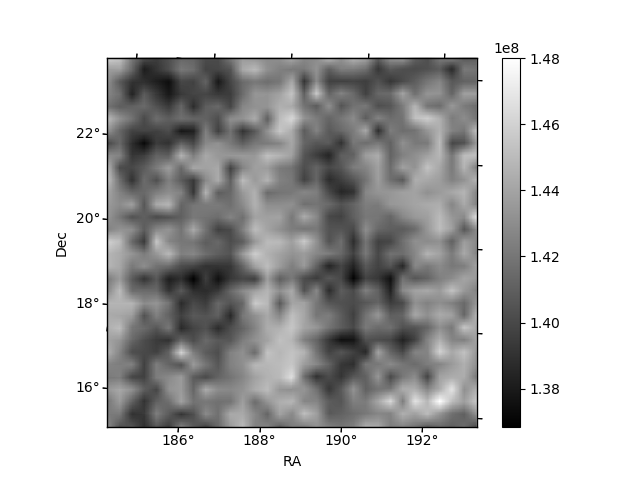
Histogram calculated using DETX and DETY for each event in the final _common_clean file
| Quadrant A | 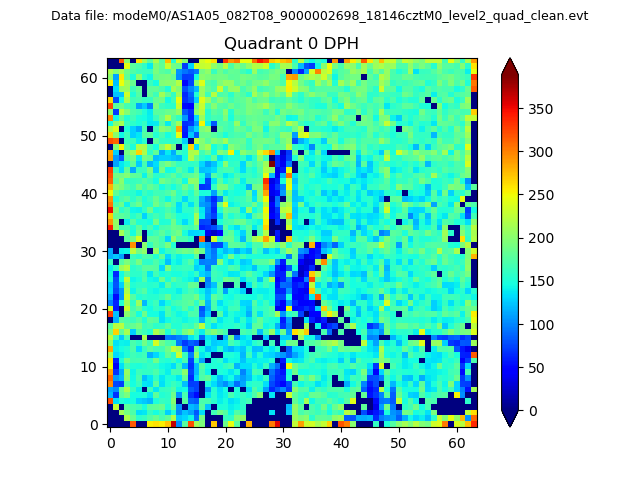 |
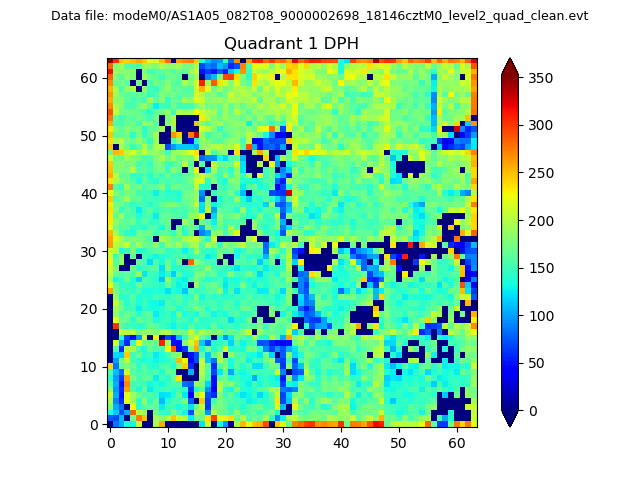 |
Quadrant B |
|---|---|---|---|
| Quadrant D | 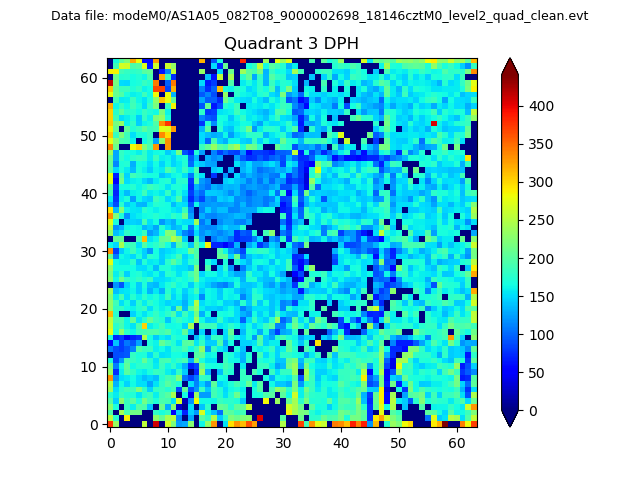 |
 |
Quadrant C |
| Plot type | Count rate plots | Images |
|---|---|---|
| Comparison with Poisson distribution Blue bars denote a histogram of data divided into 1 sec bins. Red curve is a Poisson curve with rate = median count rate of data. |
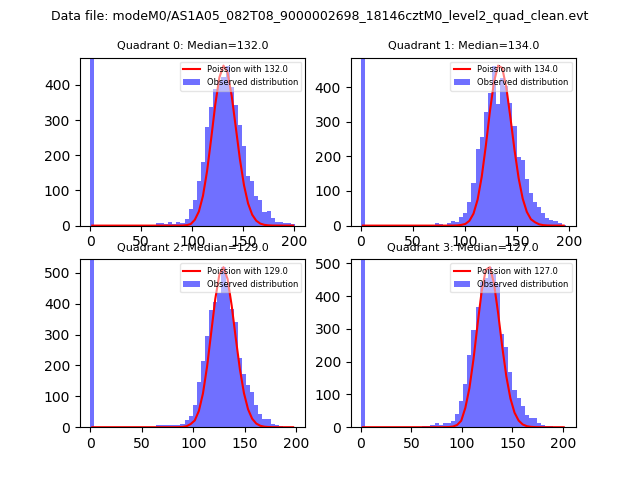 |
 |
| Quadrant-wise count rates Data is divided into 100 sec bins |
 |
|
| Module-wise count rates for Quadrant A Data is divided into 100 sec bins |
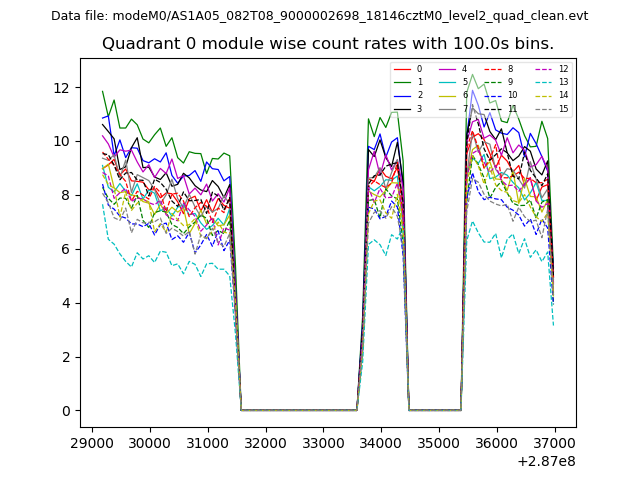 |
 |
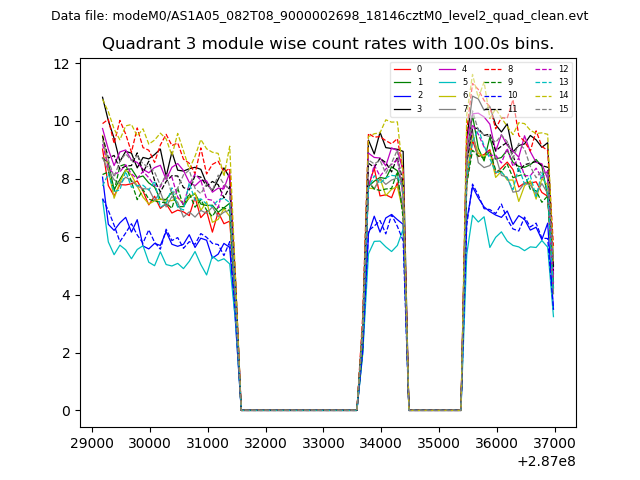
| Module-wise count rates for Quadrant B Data is divided into 100 sec bins |
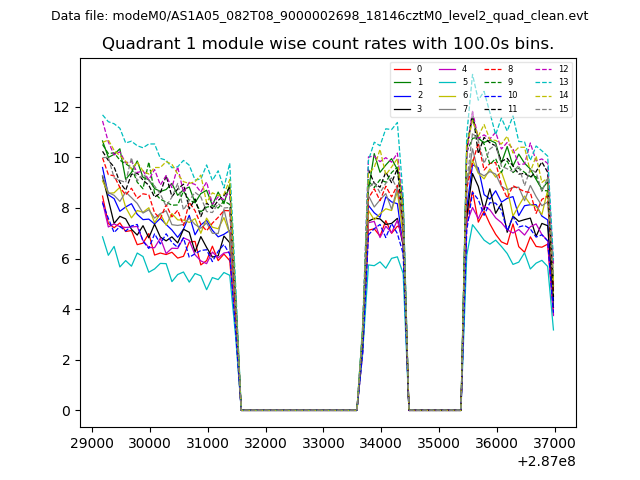 |
 |
| Module-wise count rates for Quadrant C Data is divided into 100 sec bins |
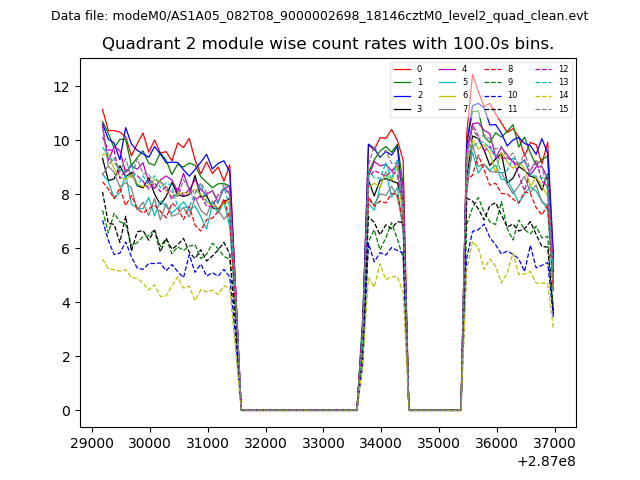 |
 |
| Module-wise count rates for Quadrant D Data is divided into 100 sec bins |
 |
 |
| Parameter | Plot |
|---|---|
| CZT HV Monitor | 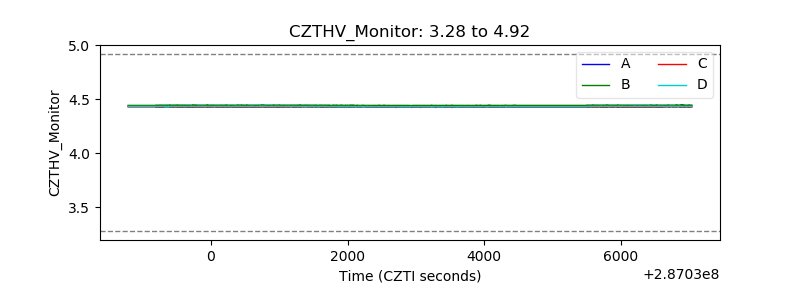 |
| D_VDD | 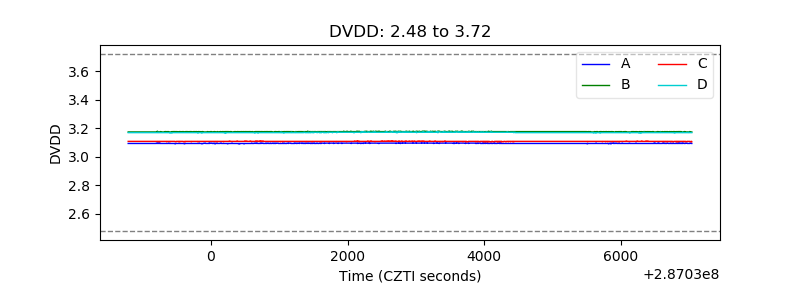 |
| Temperature 1 | 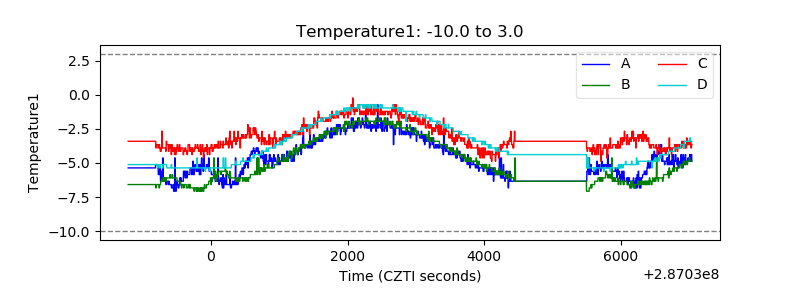 |
| Veto HV Monitor | 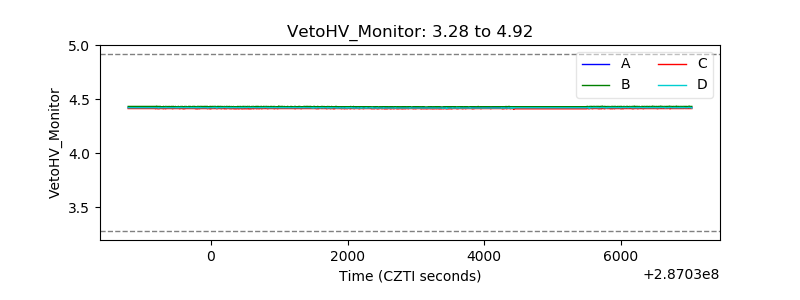 |
| Veto LLD |  |
| Alpha Counter |  |
| _CPM_Rate | 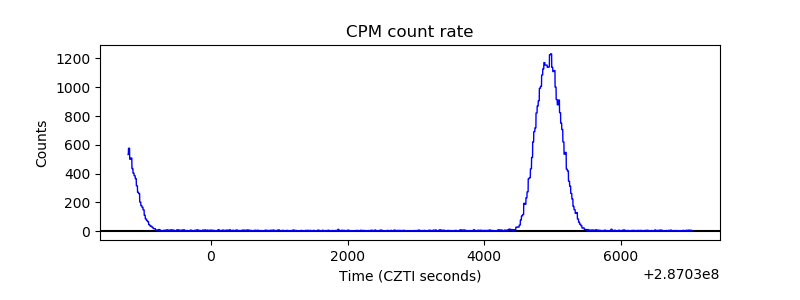 |
| CZT Counter | 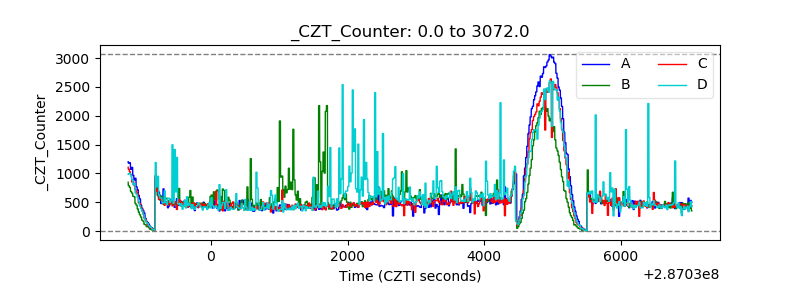 |
| +2.5 Volts monitor |  |
| +5 Volts monitor |  |
| _ROLL_ROT | 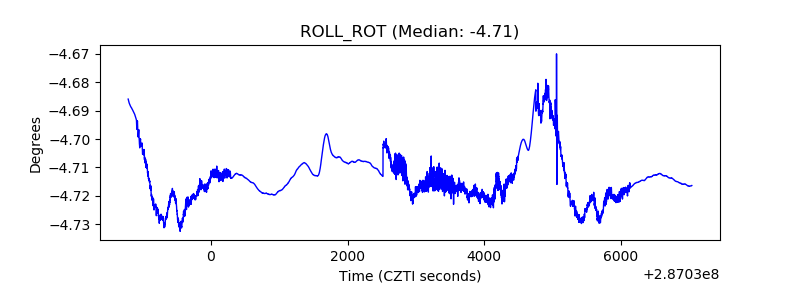 |
| _Roll_DEC | 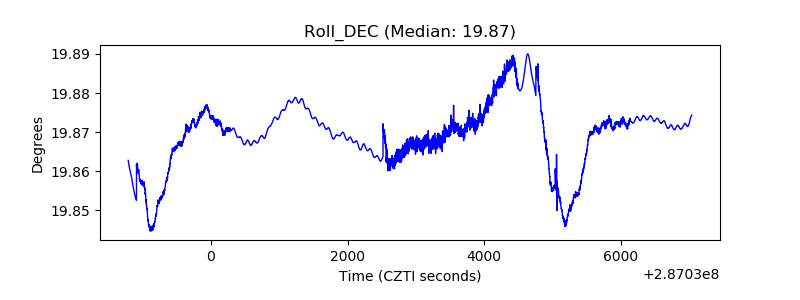 |
| _Roll_RA | 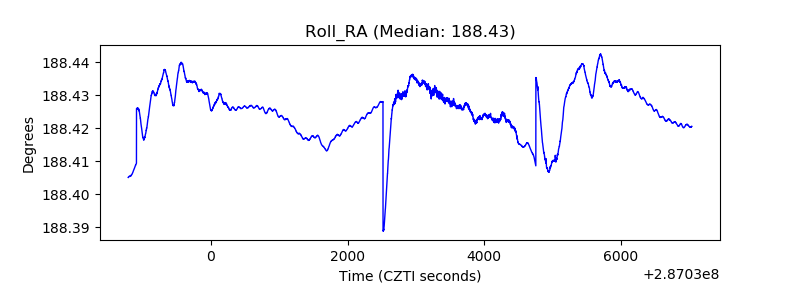 |
| Veto Counter | 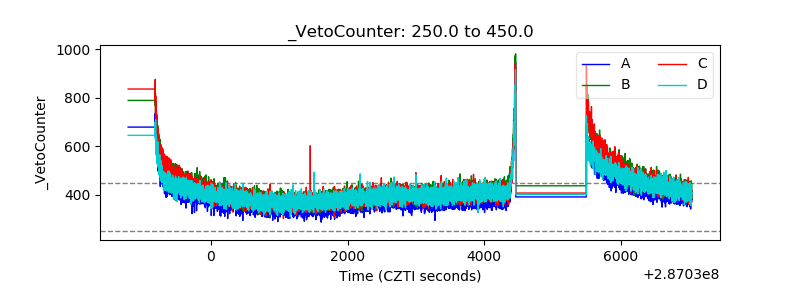 |