| Param | Original file | Final file |
|---|---|---|
| Filename | modeM0/AS1A05_082T08_9000002698_18148cztM0_level2.evt | modeM0/AS1A05_082T08_9000002698_18148cztM0_level2_quad_clean.evt |
| Size (bytes) | 499,939,200 | 96,816,960 |
| Size | 476.8 MB | 92.3 MB |
| Events in quadrant A | 3,278,763 | 630,144 |
| Events in quadrant B | 3,321,498 | 638,474 |
| Events in quadrant C | 3,317,107 | 610,655 |
| Events in quadrant D | 4,778,217 | 595,330 |
| Mode M0 | |||
|---|---|---|---|
| Quadrant | BADHDUFLAG | Total packets | Discarded packets |
| A | 0 | 13723 | 2 |
| B | 0 | 13762 | 2 |
| C | 0 | 13702 | 2 |
| D | 0 | 18648 | 2 |
| Mode SS | |||
|---|---|---|---|
| Quadrant | BADHDUFLAG | Total packets | Discarded packets |
| A | 0 | 134 | 0 |
| B | 0 | 134 | 0 |
| C | 0 | 134 | 0 |
| D | 0 | 134 | 0 |
| Mode M9 | |||
|---|---|---|---|
| Quadrant | BADHDUFLAG | Total packets | Discarded packets |
| A | 0 | 15 | 0 |
| B | 0 | 16 | 0 |
| C | 0 | 16 | 0 |
| D | 0 | 16 | 0 |
| Quadrant | Total seconds | Saturated seconds | Saturation percentage |
|---|---|---|---|
| A | 6557 | 34 | 0.518530% |
| B | 6557 | 47 | 0.716791% |
| C | 6557 | 63 | 0.960805% |
| D | 6557 | 269 | 4.102486% |
Noise dominated data is calculated using 1-second bins in cleaned event files. If a bin has >2000 counts, and if more than 50% of those come from <1% of pixels, then it is considered to be noise-dominated and hence unusable.
| Quadrant | # 1 sec bins | Bins with >0 counts | Bins with >2000 counts | High rate bins dominated by noise | Noise dominated (total time) | Noise dominated (detector-on time) | Marked lightcurve |
|---|---|---|---|---|---|---|---|
| A | 7717 | 6558 | 0 | 0 | 0.00% | 0.00% | 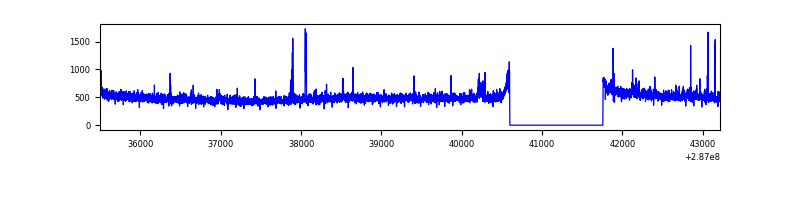 |
| B | 7717 | 6558 | 8 | 8 | 0.10% | 0.12% | 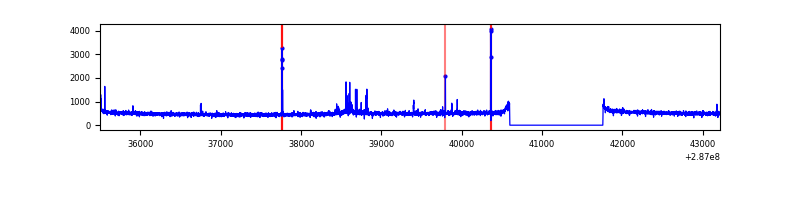 |
| C | 7717 | 6558 | 11 | 11 | 0.14% | 0.17% | 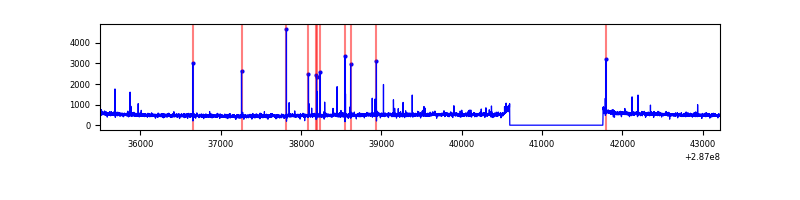 |
| D | 7717 | 6558 | 195 | 195 | 2.53% | 2.97% | 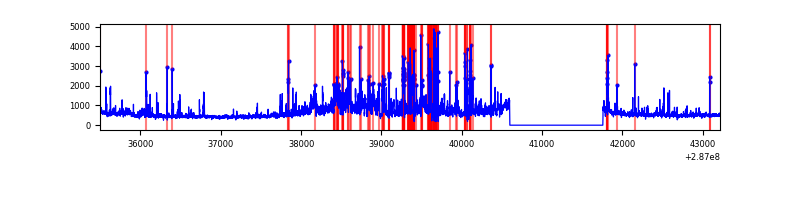 |
Top three noisy pixels from each quadrant. If the there are fewer than three noisy pixels in the level2.evt file, extra rows are filled as -1
| Pixel properties | Quadrant properties | ||||||
|---|---|---|---|---|---|---|---|
| Quadrant | DetID | PixID | Counts | Sigma | Mean | Median | Sigma |
| A | 4 | 2 | 30379 | 175.71 | 833 | 818 | 168.2 |
| A | 15 | 174 | 25643 | 147.56 | 833 | 818 | 168.2 |
| A | 15 | 9 | 16018 | 90.35 | 833 | 818 | 168.2 |
| B | 7 | 220 | 33507 | 210.87 | 822 | 802 | 155.1 |
| B | 0 | 189 | 26220 | 163.88 | 822 | 802 | 155.1 |
| B | 3 | 64 | 25369 | 158.4 | 822 | 802 | 155.1 |
| C | 14 | 238 | 122202 | 660.83 | 787 | 792 | 183.7 |
| C | 3 | 233 | 120362 | 650.81 | 787 | 792 | 183.7 |
| C | 13 | 61 | 5505 | 25.65 | 787 | 792 | 183.7 |
| D | 7 | 238 | 1357409 | 6972.49 | 789 | 764 | 194.6 |
| D | 11 | 176 | 170507 | 872.39 | 789 | 764 | 194.6 |
| D | 12 | 110 | 89742 | 457.3 | 789 | 764 | 194.6 |
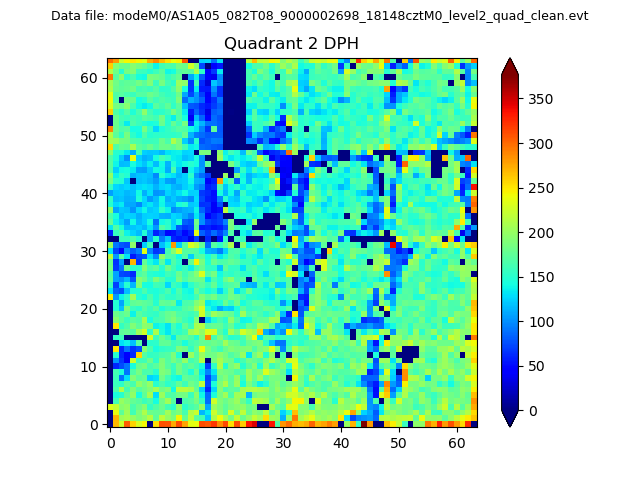
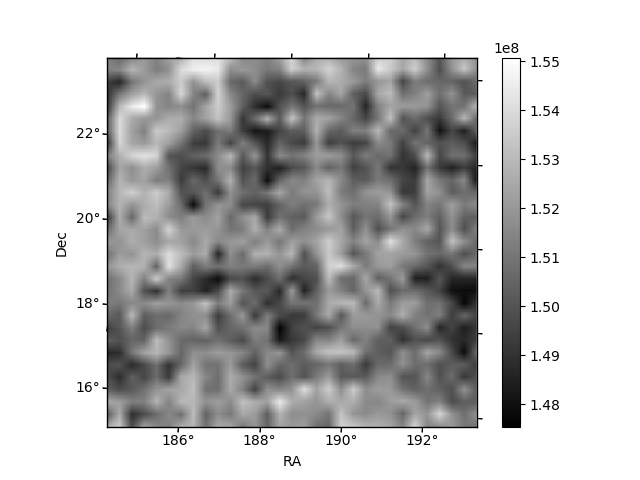
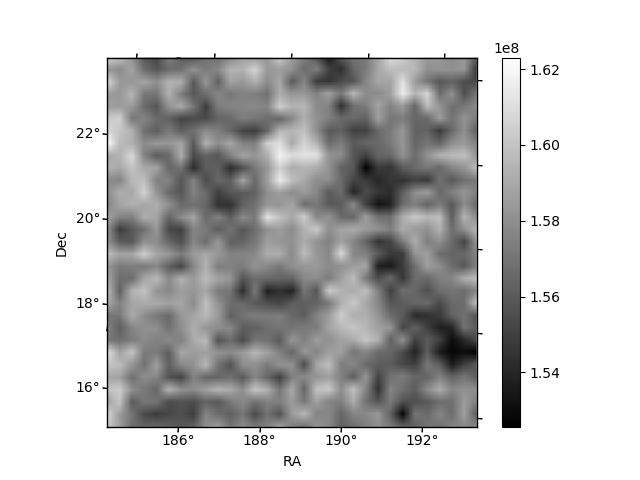
Histogram calculated using DETX and DETY for each event in the final _common_clean file
| Quadrant A |  |
 |
Quadrant B |
|---|---|---|---|
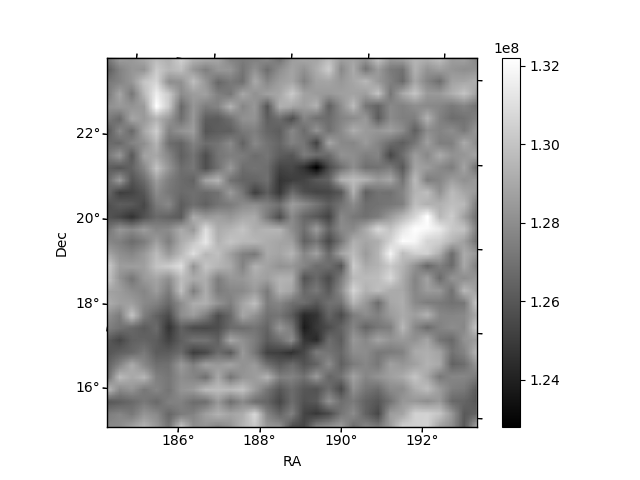
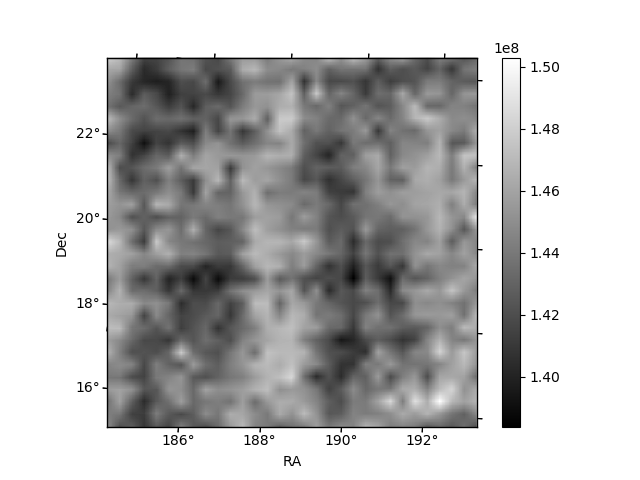
| Quadrant D | 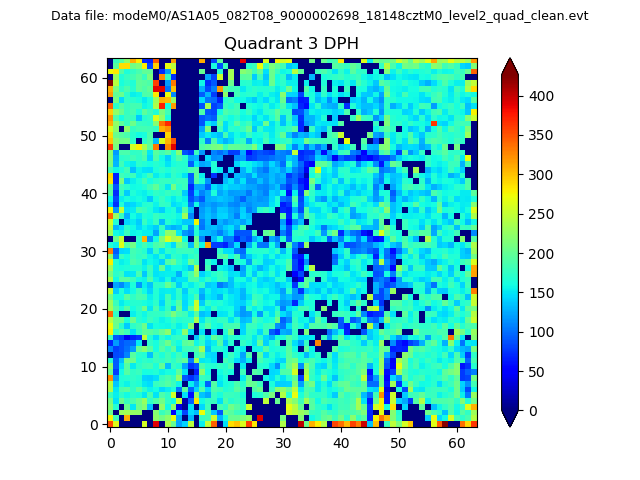 |
 |
Quadrant C |
| Plot type | Count rate plots | Images |
|---|---|---|
| Comparison with Poisson distribution Blue bars denote a histogram of data divided into 1 sec bins. Red curve is a Poisson curve with rate = median count rate of data. |
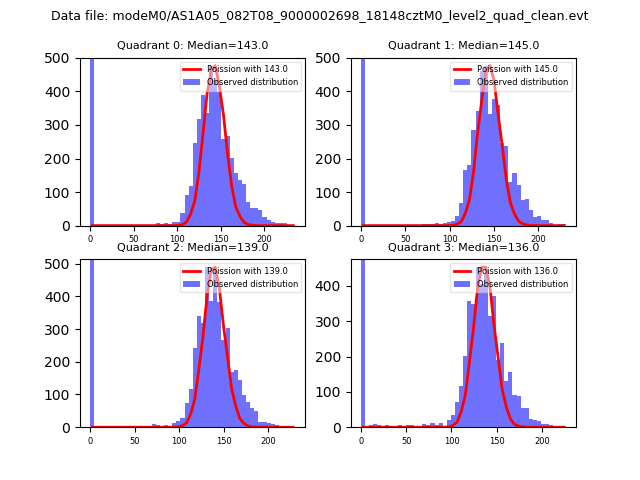 |
 |
| Quadrant-wise count rates Data is divided into 100 sec bins |
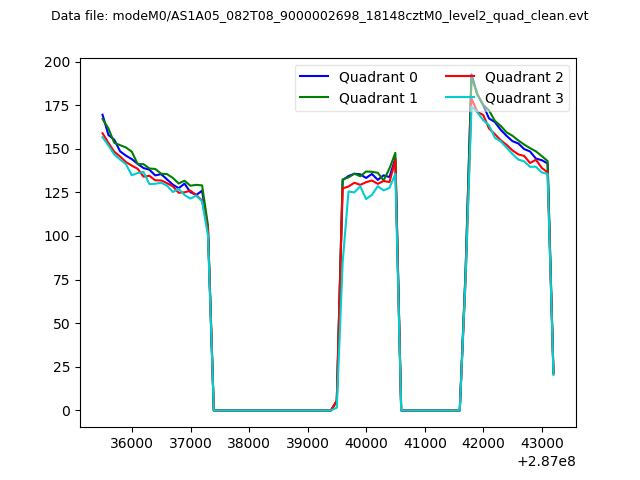 |
|
| Module-wise count rates for Quadrant A Data is divided into 100 sec bins |
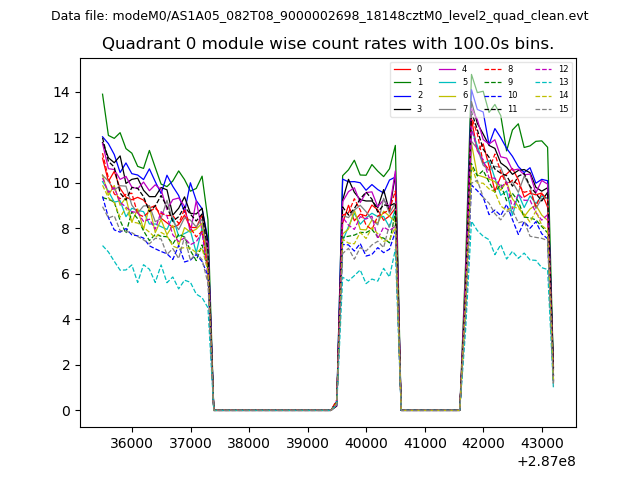 |
 |
| Module-wise count rates for Quadrant B Data is divided into 100 sec bins |
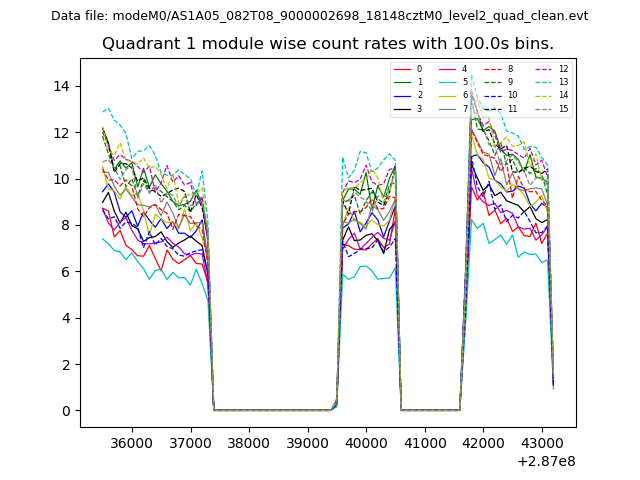 |
 |
| Module-wise count rates for Quadrant C Data is divided into 100 sec bins |
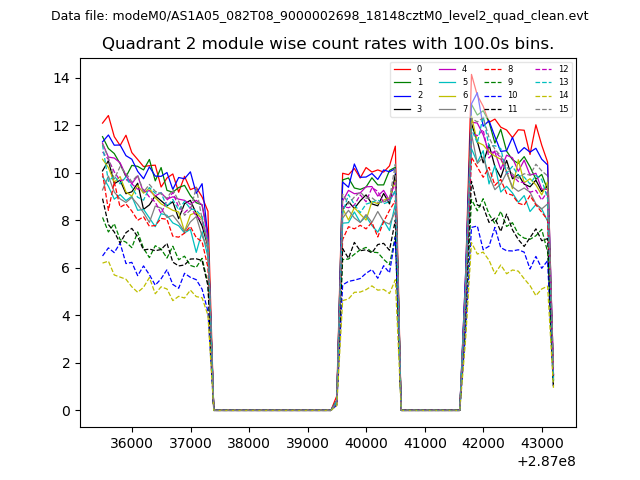 |
 |
| Module-wise count rates for Quadrant D Data is divided into 100 sec bins |
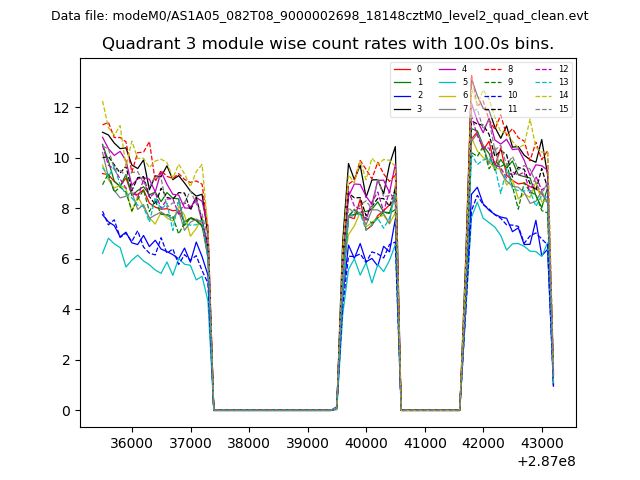 |
 |
| Parameter | Plot |
|---|---|
| CZT HV Monitor | 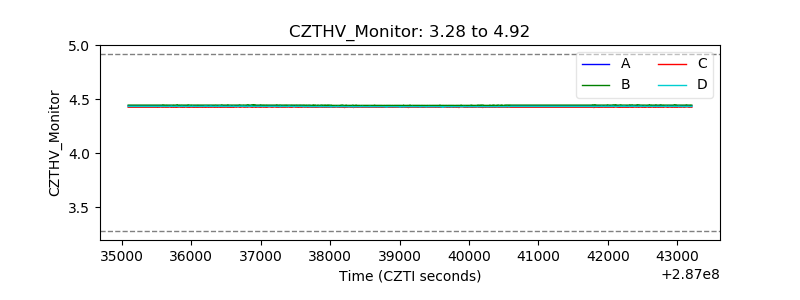 |
| D_VDD | 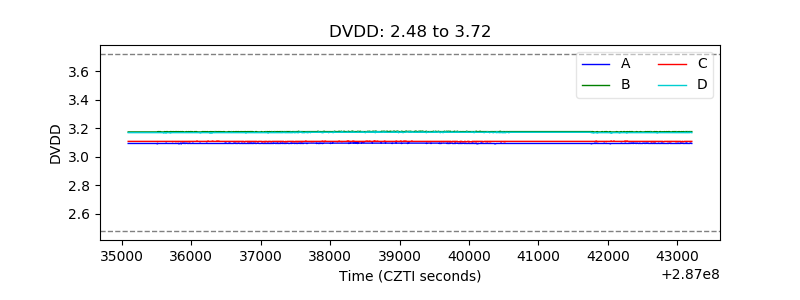 |
| Temperature 1 | 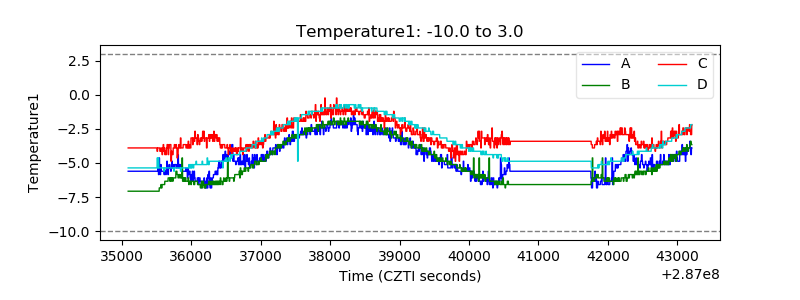 |
| Veto HV Monitor | 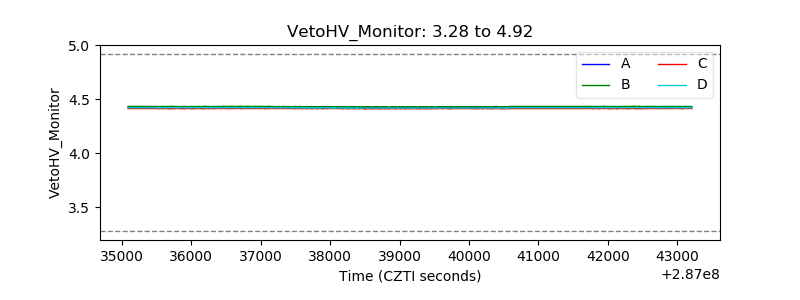 |
| Veto LLD |  |
| Alpha Counter |  |
| _CPM_Rate | 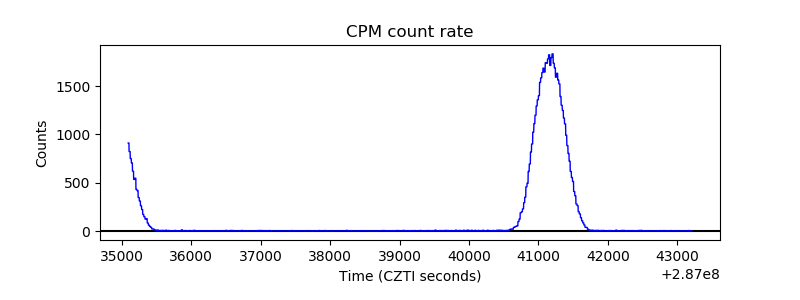 |
| CZT Counter | 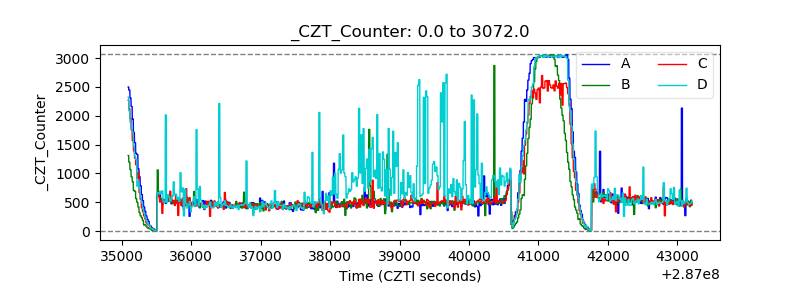 |
| +2.5 Volts monitor |  |
| +5 Volts monitor |  |
| _ROLL_ROT | 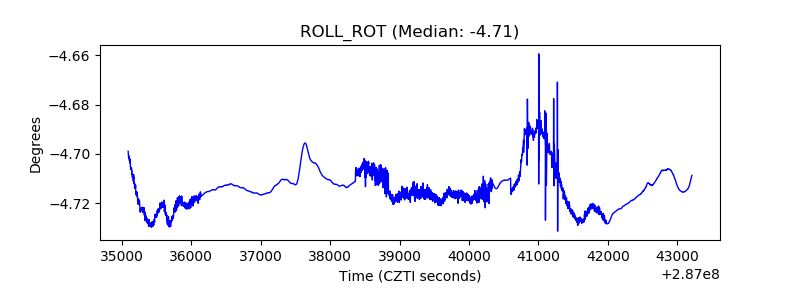 |
| _Roll_DEC | 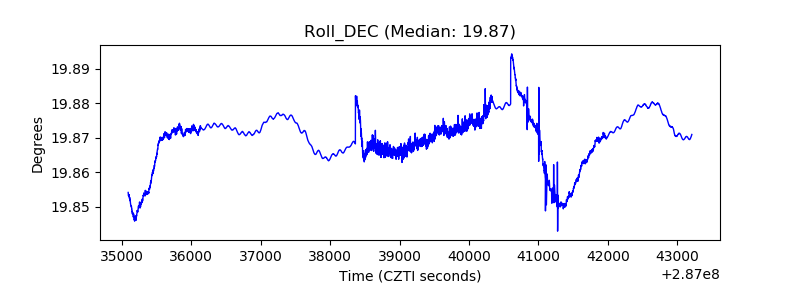 |
| _Roll_RA | 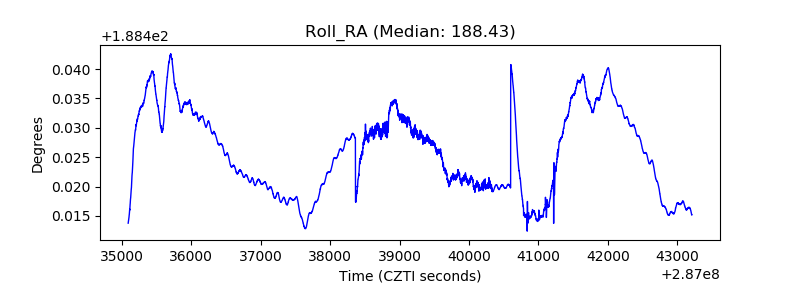 |
| Veto Counter | 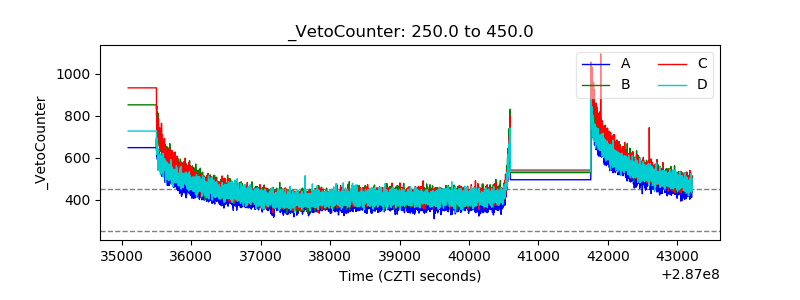 |