| Param | Original file | Final file |
|---|---|---|
| Filename | modeM0/AS1A05_082T08_9000002698_18149cztM0_level2.evt | modeM0/AS1A05_082T08_9000002698_18149cztM0_level2_quad_clean.evt |
| Size (bytes) | 425,689,920 | 76,910,400 |
| Size | 406.0 MB | 73.3 MB |
| Events in quadrant A | 2,951,411 | 493,951 |
| Events in quadrant B | 2,984,202 | 499,516 |
| Events in quadrant C | 2,919,637 | 475,488 |
| Events in quadrant D | 3,655,300 | 467,192 |
| Mode M0 | |||
|---|---|---|---|
| Quadrant | BADHDUFLAG | Total packets | Discarded packets |
| A | 0 | 12113 | 1 |
| B | 0 | 12125 | 1 |
| C | 0 | 11905 | 1 |
| D | 0 | 14501 | 1 |
| Mode SS | |||
|---|---|---|---|
| Quadrant | BADHDUFLAG | Total packets | Discarded packets |
| A | 0 | 114 | 0 |
| B | 0 | 114 | 0 |
| C | 0 | 114 | 0 |
| D | 0 | 114 | 0 |
| Mode M9 | |||
|---|---|---|---|
| Quadrant | BADHDUFLAG | Total packets | Discarded packets |
| A | 0 | 13 | 0 |
| B | 0 | 13 | 0 |
| C | 0 | 13 | 0 |
| D | 0 | 13 | 0 |
| Quadrant | Total seconds | Saturated seconds | Saturation percentage |
|---|---|---|---|
| A | 5617 | 64 | 1.139398% |
| B | 5616 | 73 | 1.299858% |
| C | 5616 | 63 | 1.121795% |
| D | 5617 | 77 | 1.370839% |
Noise dominated data is calculated using 1-second bins in cleaned event files. If a bin has >2000 counts, and if more than 50% of those come from <1% of pixels, then it is considered to be noise-dominated and hence unusable.
| Quadrant | # 1 sec bins | Bins with >0 counts | Bins with >2000 counts | High rate bins dominated by noise | Noise dominated (total time) | Noise dominated (detector-on time) | Marked lightcurve |
|---|---|---|---|---|---|---|---|
| A | 6867 | 5619 | 2 | 2 | 0.03% | 0.04% | 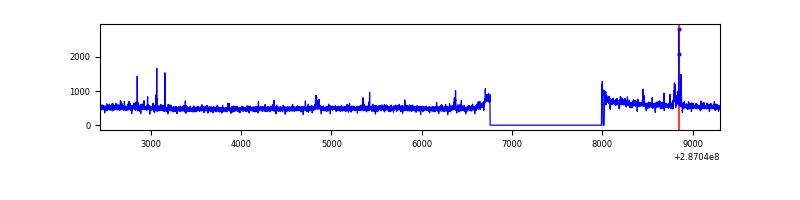 |
| B | 6866 | 5618 | 8 | 8 | 0.12% | 0.14% | 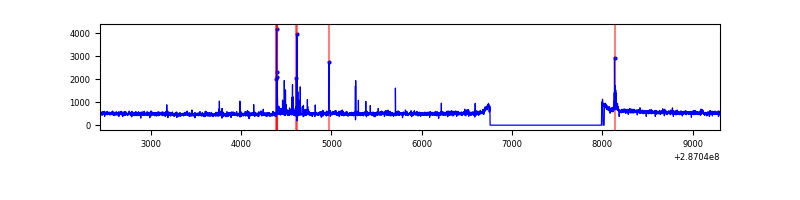 |
| C | 6866 | 5618 | 1 | 1 | 0.01% | 0.02% | 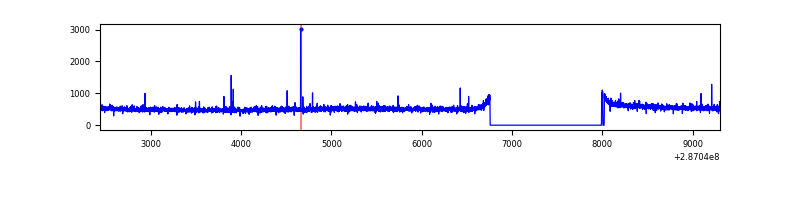 |
| D | 6867 | 5619 | 35 | 35 | 0.51% | 0.62% | 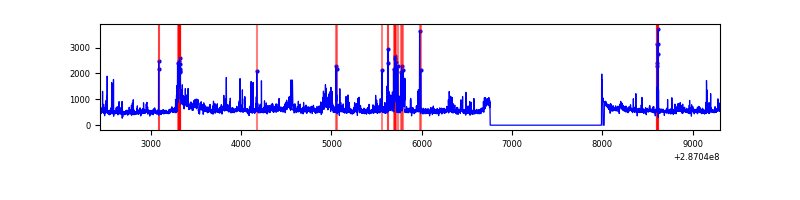 |
Top three noisy pixels from each quadrant. If the there are fewer than three noisy pixels in the level2.evt file, extra rows are filled as -1
| Pixel properties | Quadrant properties | ||||||
|---|---|---|---|---|---|---|---|
| Quadrant | DetID | PixID | Counts | Sigma | Mean | Median | Sigma |
| A | 4 | 2 | 49113 | 320.88 | 749 | 737 | 150.8 |
| A | 15 | 174 | 24234 | 155.86 | 749 | 737 | 150.8 |
| A | 0 | 226 | 6721 | 39.69 | 749 | 737 | 150.8 |
| B | 7 | 220 | 69238 | 487.5 | 735 | 718 | 140.6 |
| B | 4 | 173 | 17489 | 119.32 | 735 | 718 | 140.6 |
| B | 12 | 111 | 16046 | 109.06 | 735 | 718 | 140.6 |
| C | 14 | 238 | 110695 | 672.4 | 706 | 712 | 163.6 |
| C | 3 | 233 | 48801 | 294.0 | 706 | 712 | 163.6 |
| C | 13 | 61 | 4925 | 25.76 | 706 | 712 | 163.6 |
| D | 7 | 238 | 621755 | 3519.24 | 724 | 705 | 176.5 |
| D | 10 | 70 | 109478 | 616.37 | 724 | 705 | 176.5 |
| D | 11 | 176 | 57641 | 322.63 | 724 | 705 | 176.5 |
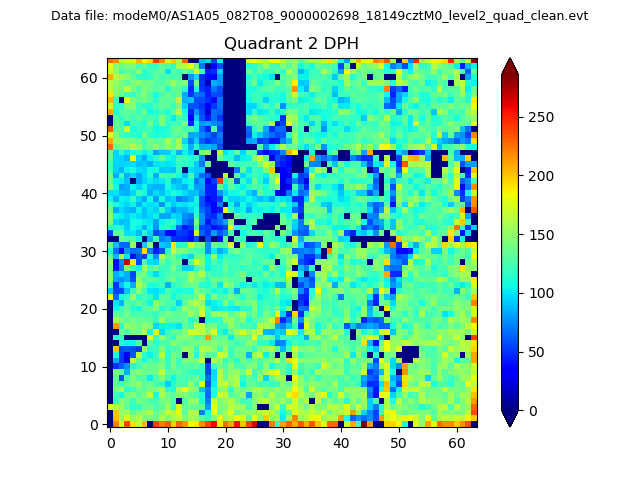
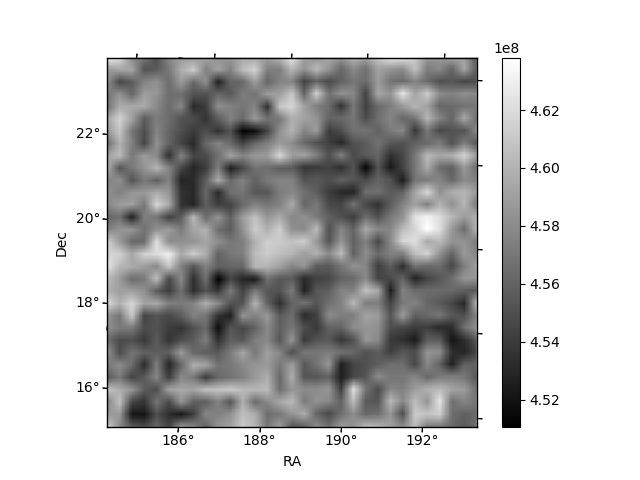
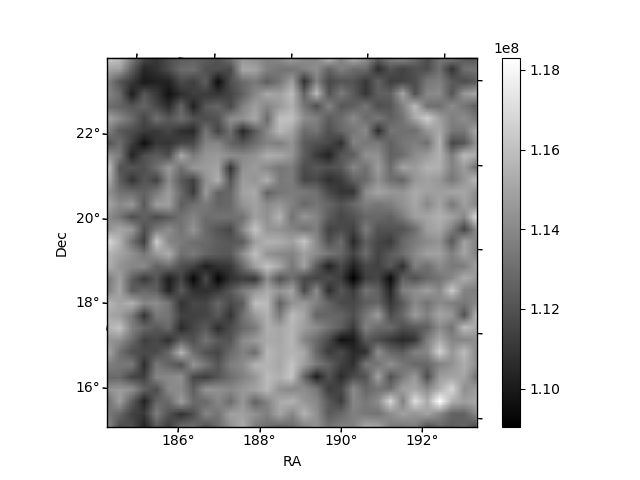
Histogram calculated using DETX and DETY for each event in the final _common_clean file
| Quadrant A | 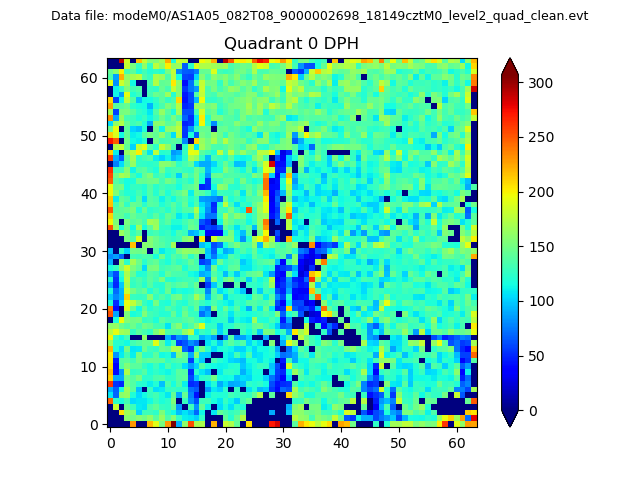 |
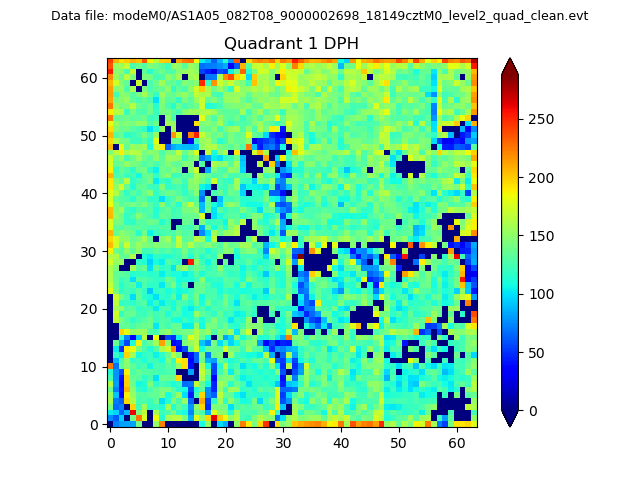 |
Quadrant B |
|---|---|---|---|
| Quadrant D | 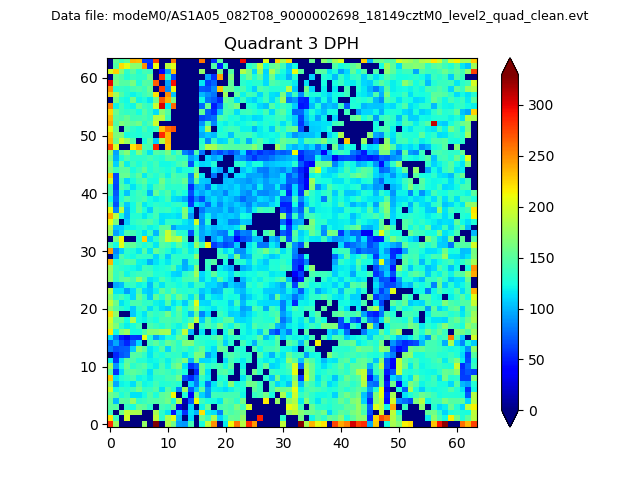 |
 |
Quadrant C |
| Plot type | Count rate plots | Images |
|---|---|---|
| Comparison with Poisson distribution Blue bars denote a histogram of data divided into 1 sec bins. Red curve is a Poisson curve with rate = median count rate of data. |
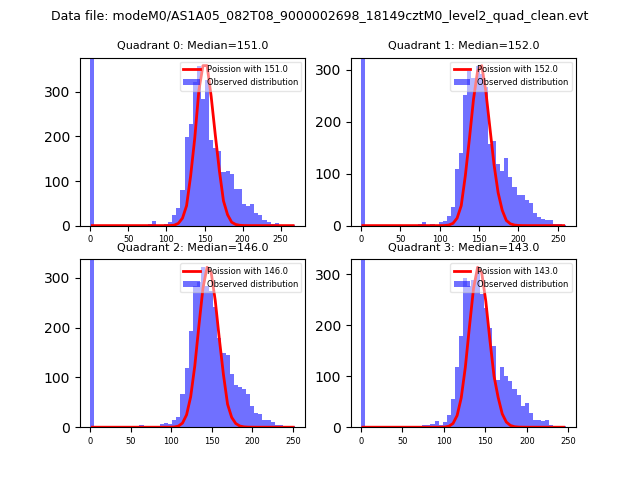 |
 |
| Quadrant-wise count rates Data is divided into 100 sec bins |
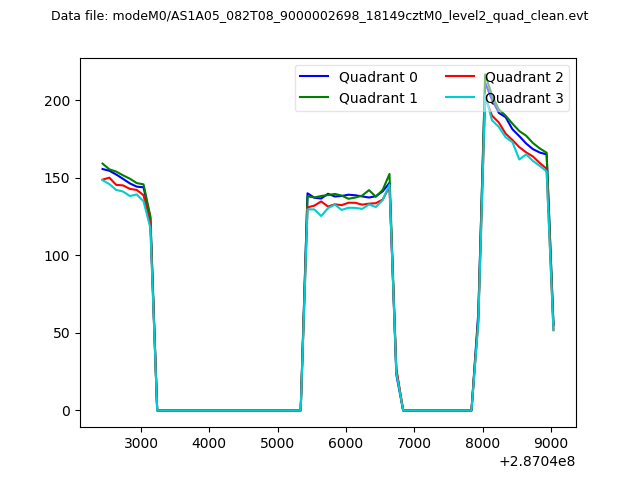 |
|
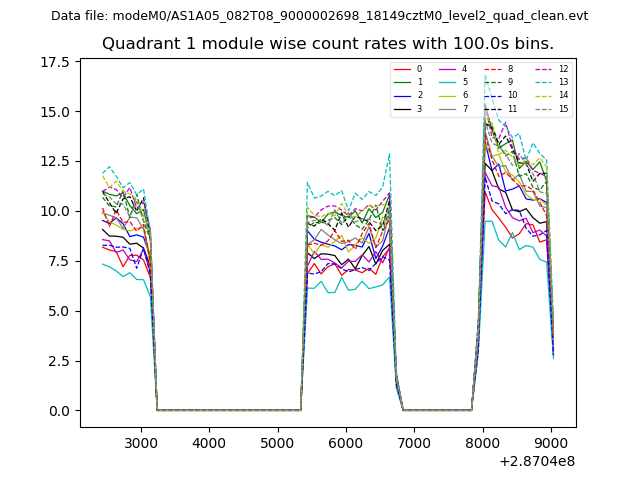
| Module-wise count rates for Quadrant A Data is divided into 100 sec bins |
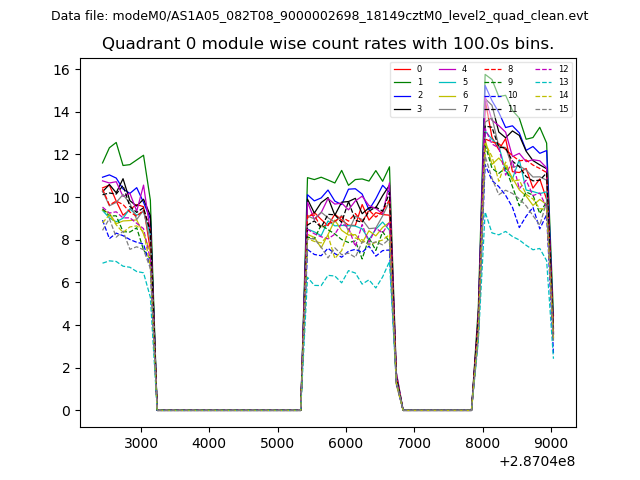 |
 |
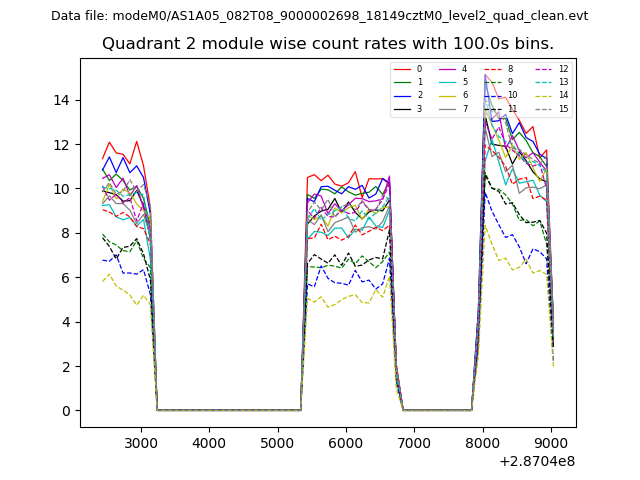
| Module-wise count rates for Quadrant B Data is divided into 100 sec bins |
 |
 |
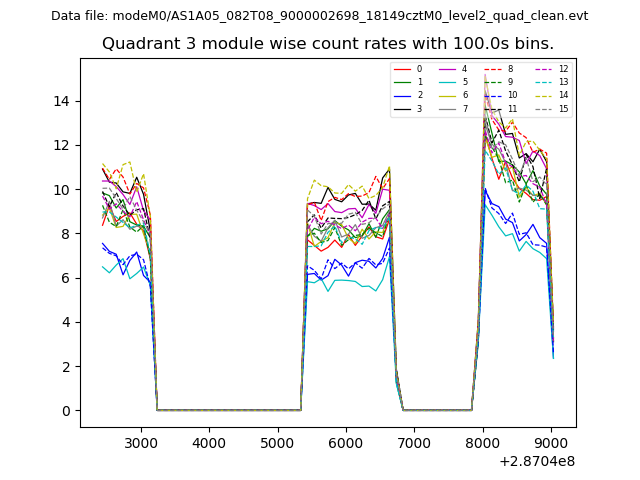
| Module-wise count rates for Quadrant C Data is divided into 100 sec bins |
 |
 |
| Module-wise count rates for Quadrant D Data is divided into 100 sec bins |
 |
 |
| Parameter | Plot |
|---|---|
| CZT HV Monitor | 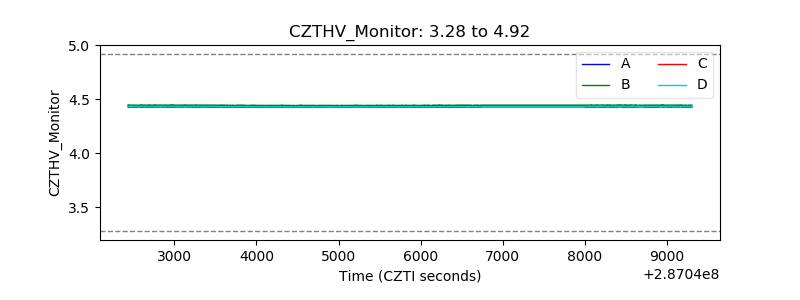 |
| D_VDD | 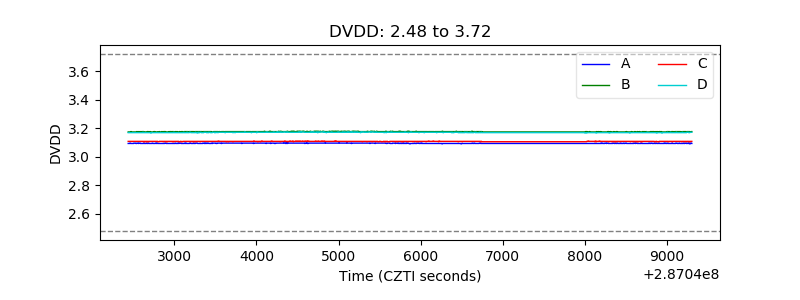 |
| Temperature 1 | 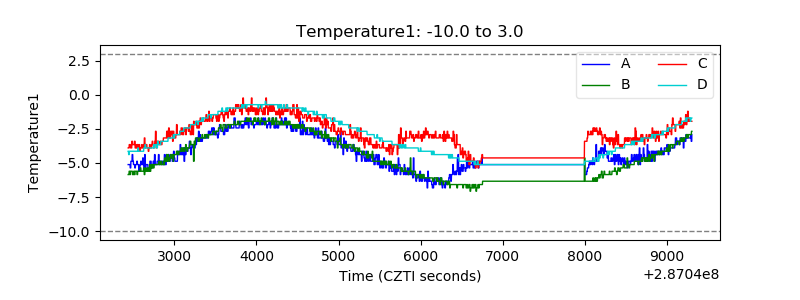 |
| Veto HV Monitor | 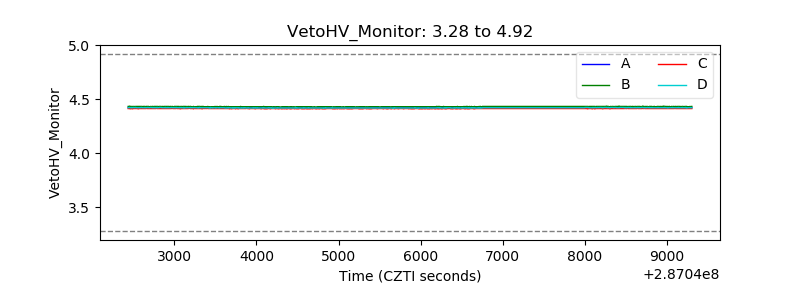 |
| Veto LLD | 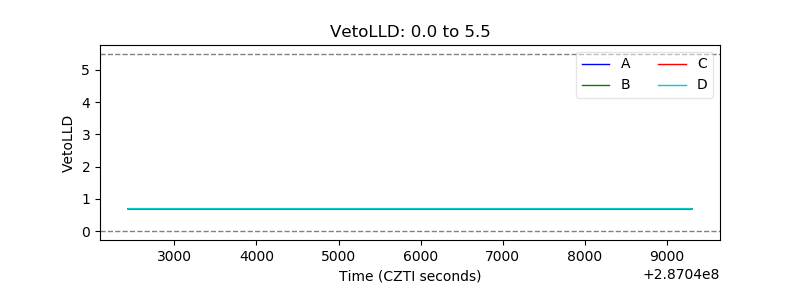 |
| Alpha Counter | 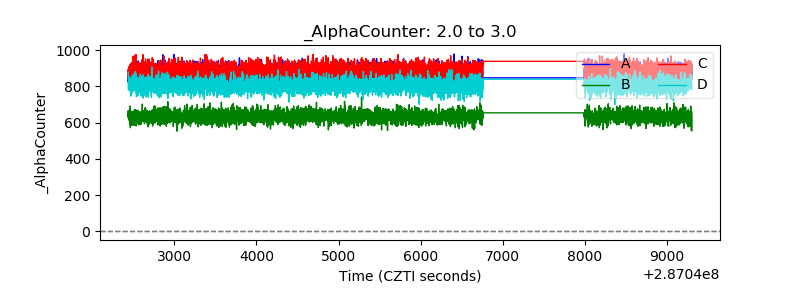 |
| _CPM_Rate | 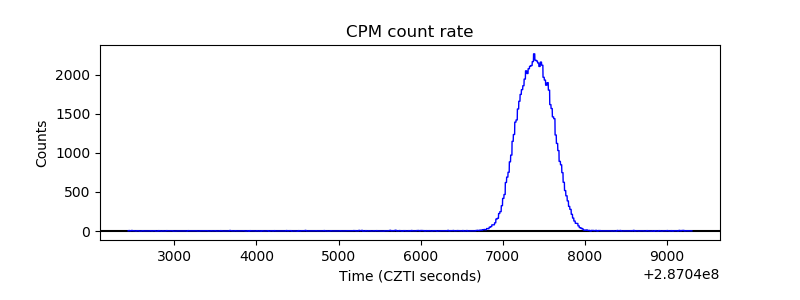 |
| CZT Counter | 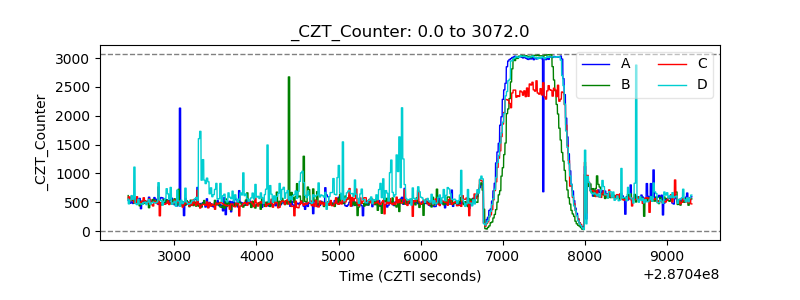 |
| +2.5 Volts monitor |  |
| +5 Volts monitor |  |
| _ROLL_ROT | 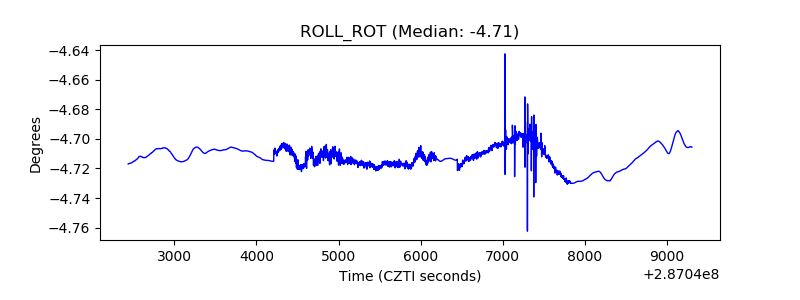 |
| _Roll_DEC | 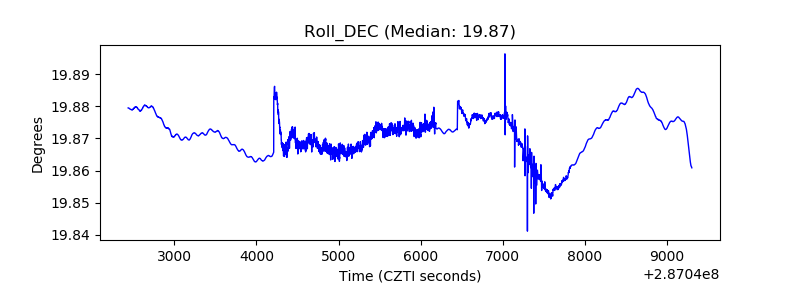 |
| _Roll_RA | 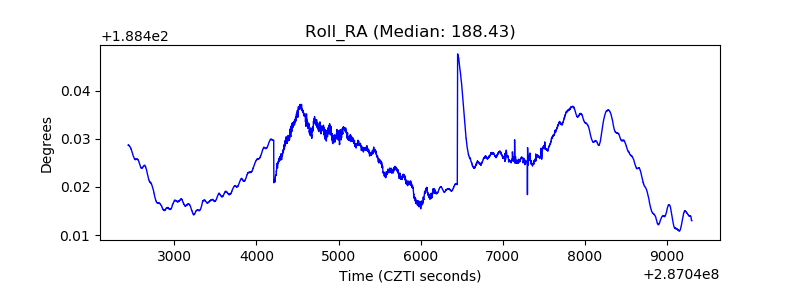 |
| Veto Counter | 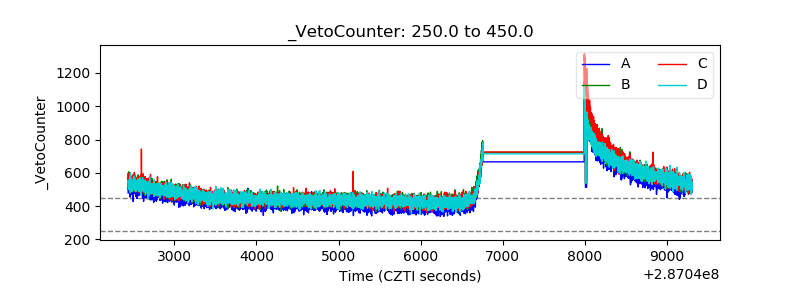 |