| Param | Original file | Final file |
|---|---|---|
| Filename | modeM0/AS1A05_082T08_9000002698_18150cztM0_level2.evt | modeM0/AS1A05_082T08_9000002698_18150cztM0_level2_quad_clean.evt |
| Size (bytes) | 260,409,600 | 31,749,120 |
| Size | 248.3 MB | 30.3 MB |
| Events in quadrant A | 1,780,798 | 184,478 |
| Events in quadrant B | 1,792,506 | 186,596 |
| Events in quadrant C | 1,743,631 | 176,450 |
| Events in quadrant D | 2,338,255 | 173,288 |
| Mode M0 | |||
|---|---|---|---|
| Quadrant | BADHDUFLAG | Total packets | Discarded packets |
| A | 0 | 7141 | 0 |
| B | 0 | 7143 | 0 |
| C | 0 | 6983 | 0 |
| D | 0 | 8957 | 0 |
| Mode SS | |||
|---|---|---|---|
| Quadrant | BADHDUFLAG | Total packets | Discarded packets |
| A | 0 | 68 | 0 |
| B | 0 | 68 | 0 |
| C | 0 | 68 | 0 |
| D | 0 | 68 | 0 |
| Quadrant | Total seconds | Saturated seconds | Saturation percentage |
|---|---|---|---|
| A | 3381 | 4 | 0.118308% |
| B | 3382 | 9 | 0.266115% |
| C | 3382 | 10 | 0.295683% |
| D | 3382 | 144 | 4.257836% |
Noise dominated data is calculated using 1-second bins in cleaned event files. If a bin has >2000 counts, and if more than 50% of those come from <1% of pixels, then it is considered to be noise-dominated and hence unusable.
| Quadrant | # 1 sec bins | Bins with >0 counts | Bins with >2000 counts | High rate bins dominated by noise | Noise dominated (total time) | Noise dominated (detector-on time) | Marked lightcurve |
|---|---|---|---|---|---|---|---|
| A | 3381 | 3381 | 2 | 2 | 0.06% | 0.06% | 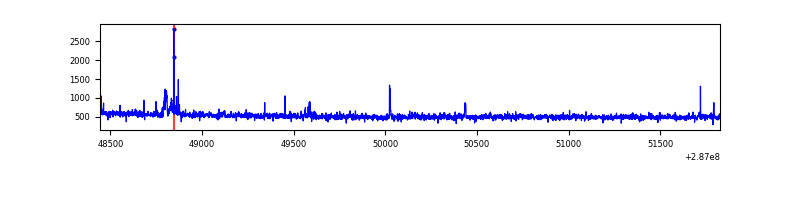 |
| B | 3382 | 3382 | 5 | 5 | 0.15% | 0.15% | 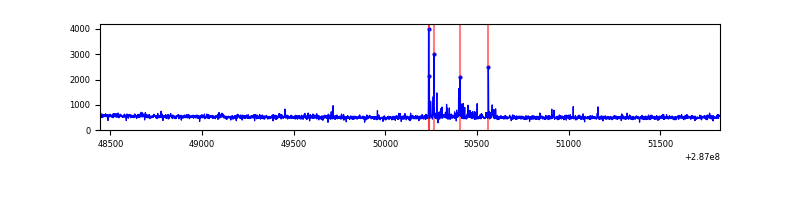 |
| C | 3382 | 3382 | 0 | 0 | 0.00% | 0.00% | 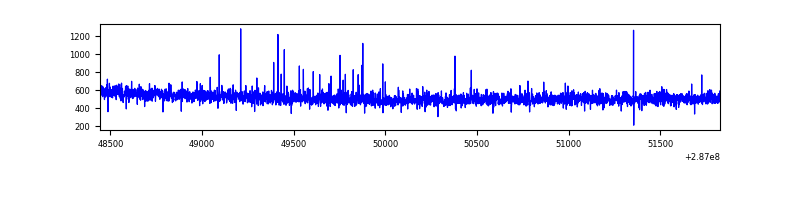 |
| D | 3382 | 3382 | 108 | 108 | 3.19% | 3.19% | 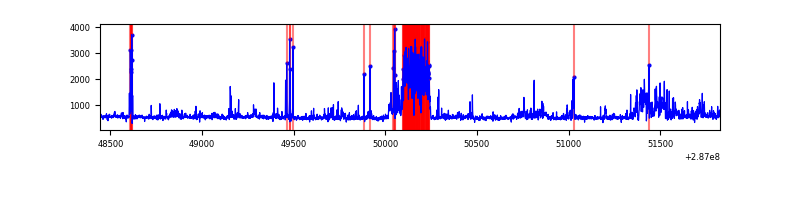 |
Top three noisy pixels from each quadrant. If the there are fewer than three noisy pixels in the level2.evt file, extra rows are filled as -1
| Pixel properties | Quadrant properties | ||||||
|---|---|---|---|---|---|---|---|
| Quadrant | DetID | PixID | Counts | Sigma | Mean | Median | Sigma |
| A | 4 | 2 | 29224 | 315.52 | 451 | 442 | 91.2 |
| A | 15 | 174 | 17002 | 181.54 | 451 | 442 | 91.2 |
| A | 0 | 226 | 3973 | 38.71 | 451 | 442 | 91.2 |
| B | 7 | 220 | 53450 | 637.1 | 439 | 431 | 83.2 |
| B | 0 | 229 | 14748 | 172.04 | 439 | 431 | 83.2 |
| B | 12 | 111 | 9083 | 103.97 | 439 | 431 | 83.2 |
| C | 14 | 238 | 67478 | 682.77 | 422 | 426 | 98.2 |
| C | 3 | 233 | 24914 | 249.35 | 422 | 426 | 98.2 |
| C | 13 | 61 | 2957 | 25.77 | 422 | 426 | 98.2 |
| D | 13 | 187 | 340887 | 3259.57 | 429 | 418 | 104.5 |
| D | 12 | 110 | 133690 | 1275.91 | 429 | 418 | 104.5 |
| D | 11 | 176 | 60502 | 575.23 | 429 | 418 | 104.5 |
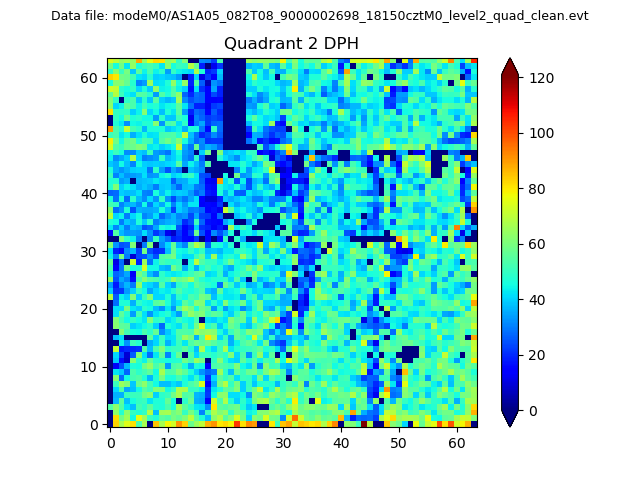
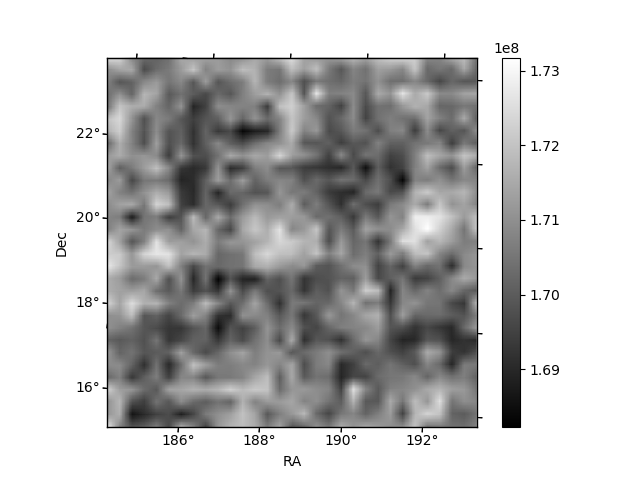
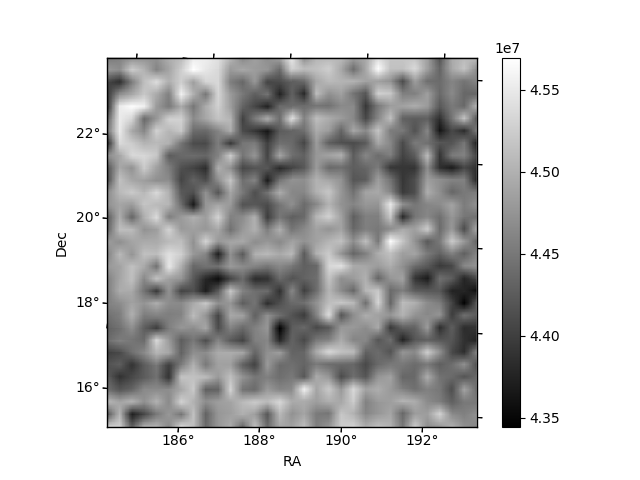
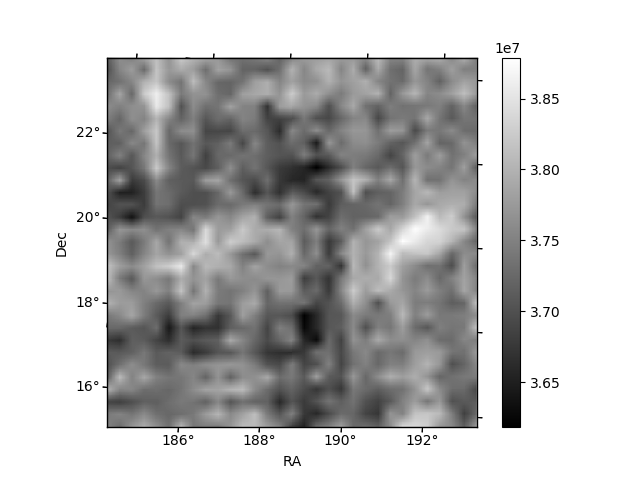
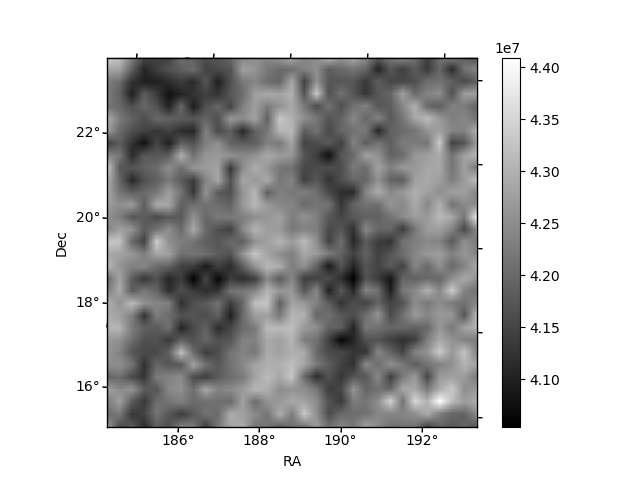
Histogram calculated using DETX and DETY for each event in the final _common_clean file
| Quadrant A | 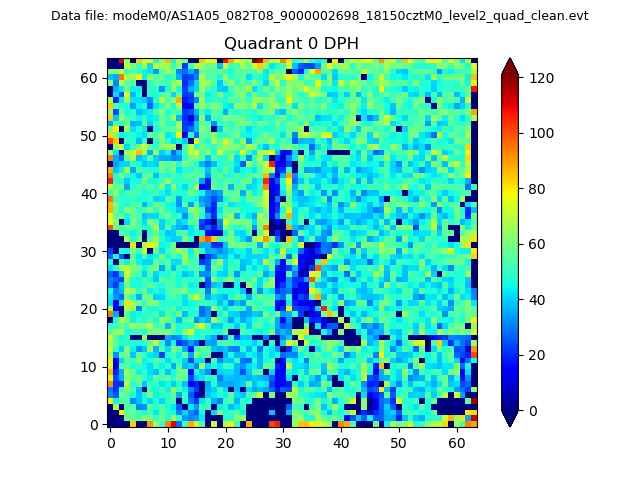 |
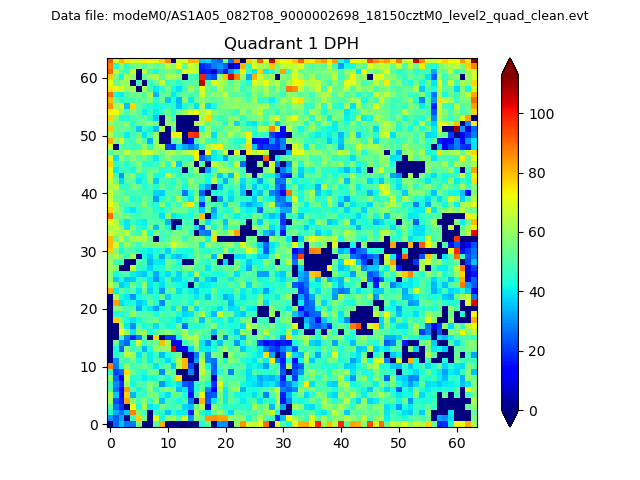 |
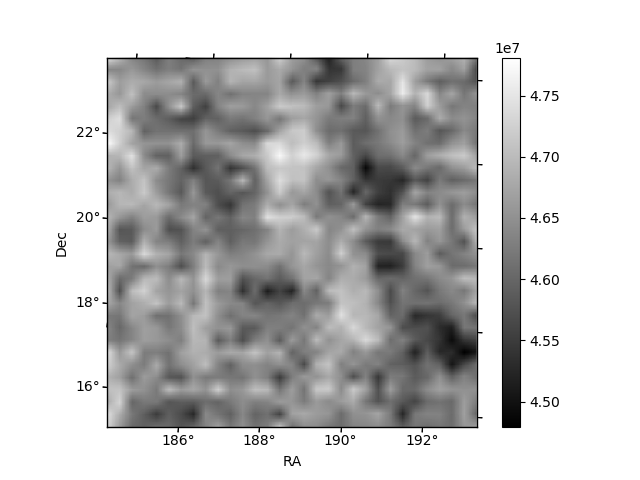
Quadrant B |
|---|---|---|---|
| Quadrant D | 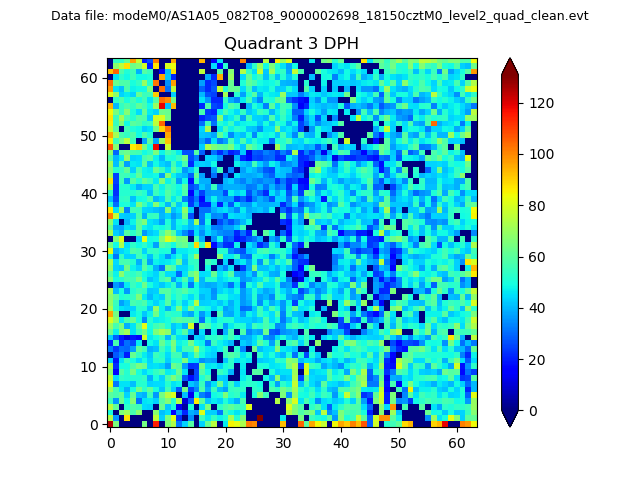 |
 |
Quadrant C |
| Plot type | Count rate plots | Images |
|---|---|---|
| Comparison with Poisson distribution Blue bars denote a histogram of data divided into 1 sec bins. Red curve is a Poisson curve with rate = median count rate of data. |
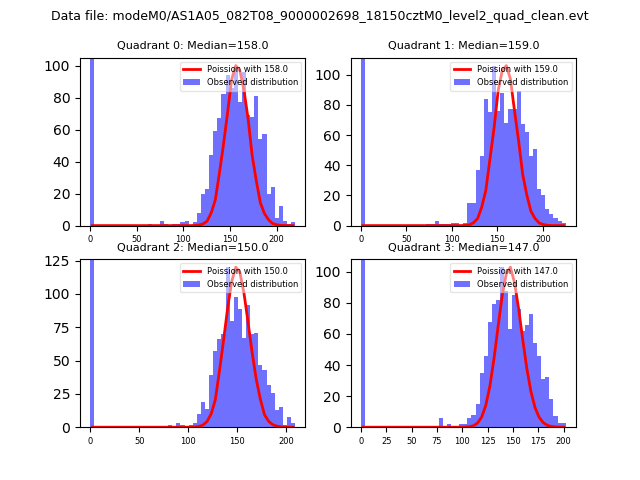 |
 |
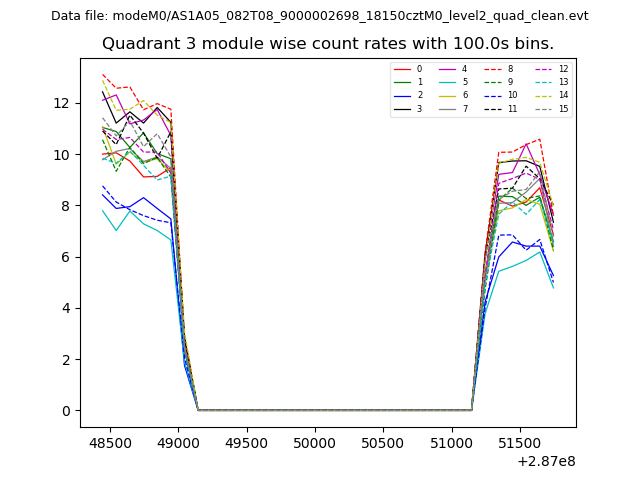
| Quadrant-wise count rates Data is divided into 100 sec bins |
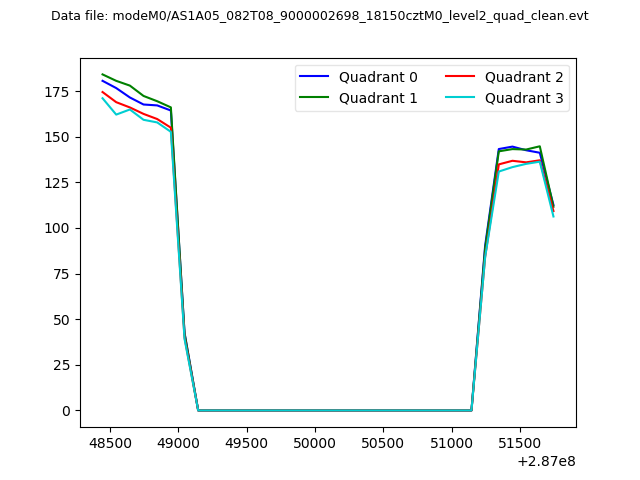 |
|
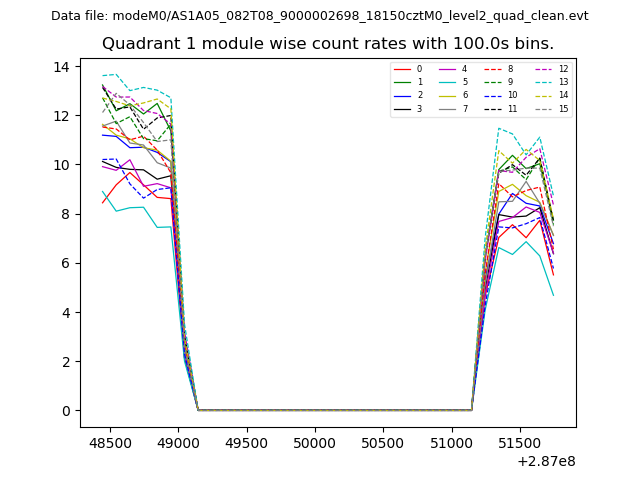
| Module-wise count rates for Quadrant A Data is divided into 100 sec bins |
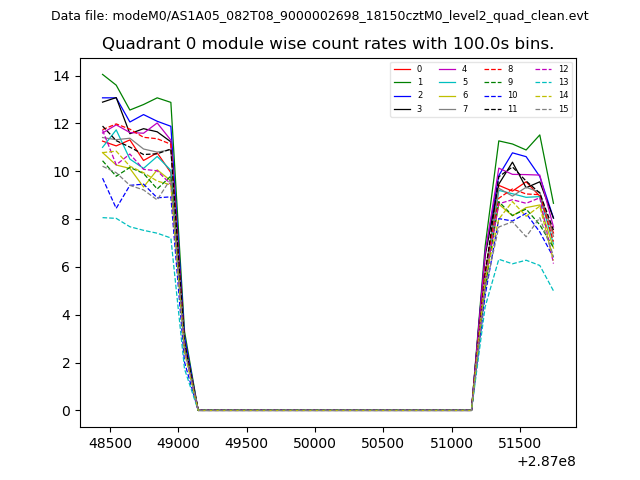 |
 |
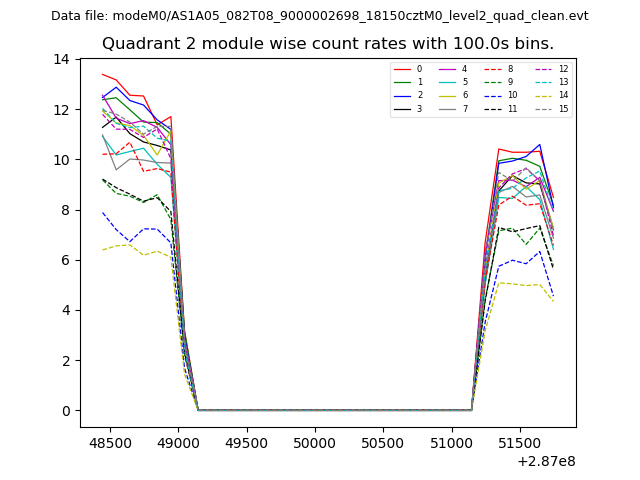
| Module-wise count rates for Quadrant B Data is divided into 100 sec bins |
 |
 |
| Module-wise count rates for Quadrant C Data is divided into 100 sec bins |
 |
 |
| Module-wise count rates for Quadrant D Data is divided into 100 sec bins |
 |
 |
| Parameter | Plot |
|---|---|
| CZT HV Monitor | 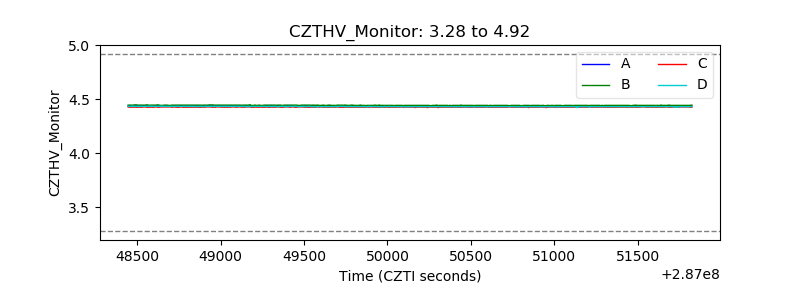 |
| D_VDD | 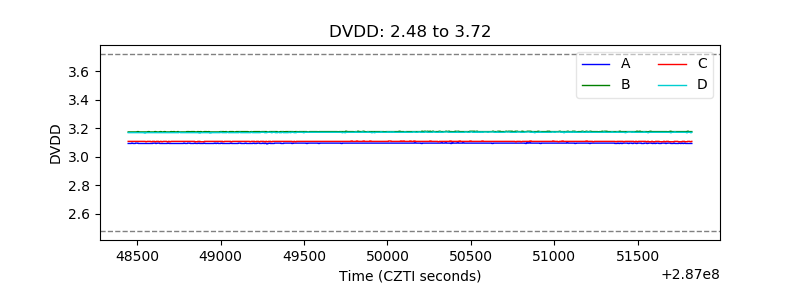 |
| Temperature 1 | 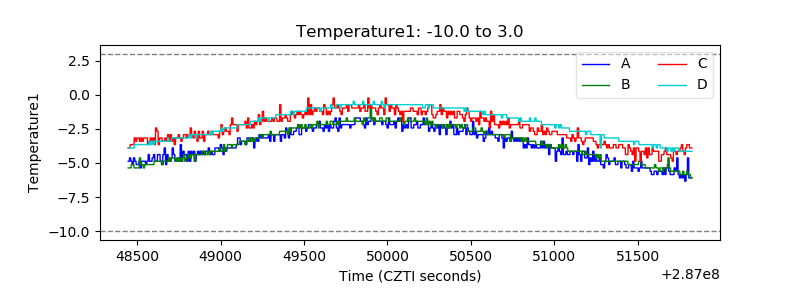 |
| Veto HV Monitor | 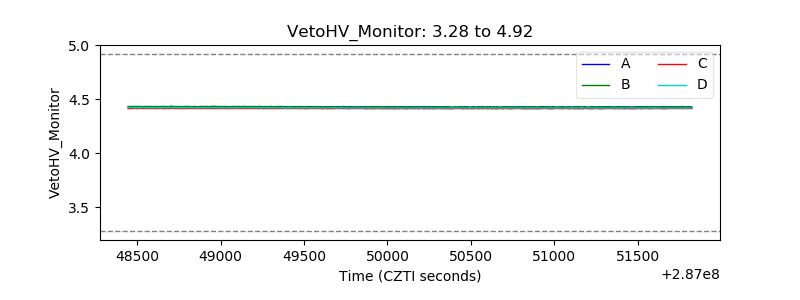 |
| Veto LLD |  |
| Alpha Counter | 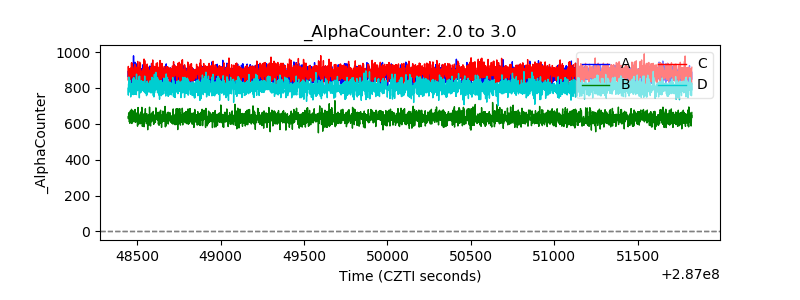 |
| _CPM_Rate | 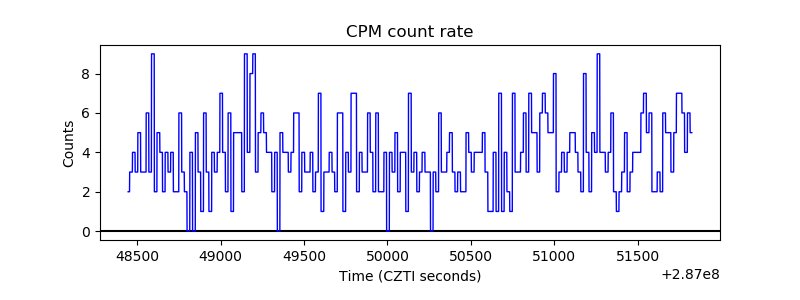 |
| CZT Counter | 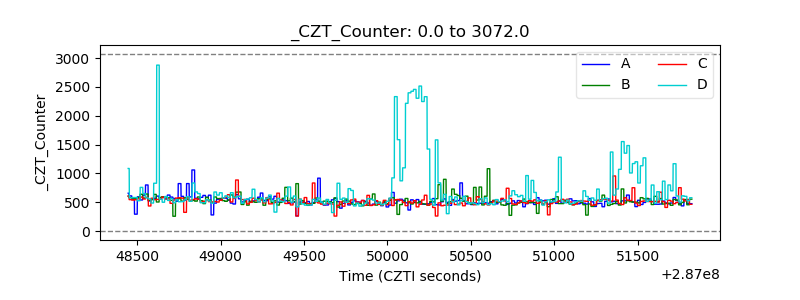 |
| +2.5 Volts monitor |  |
| +5 Volts monitor |  |
| _ROLL_ROT | 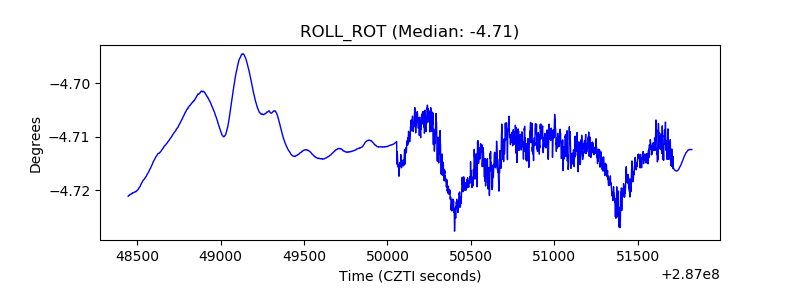 |
| _Roll_DEC | 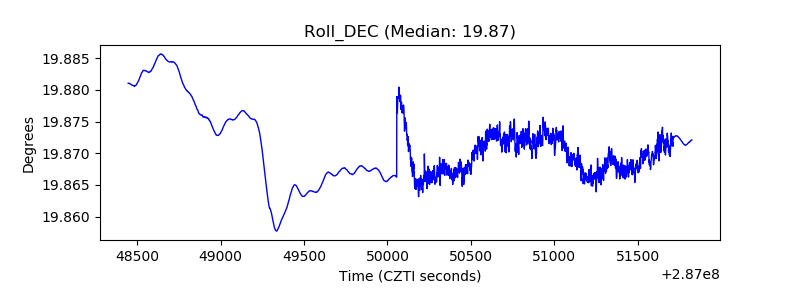 |
| _Roll_RA | 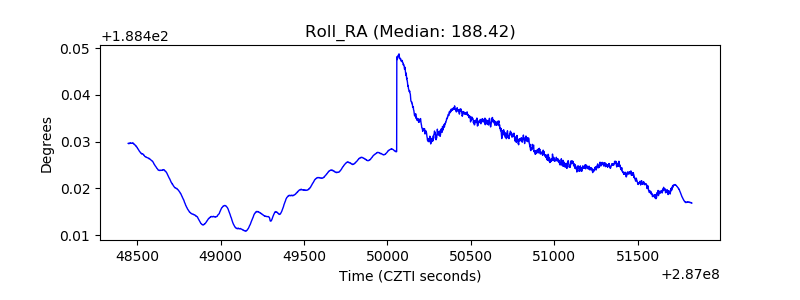 |
| Veto Counter | 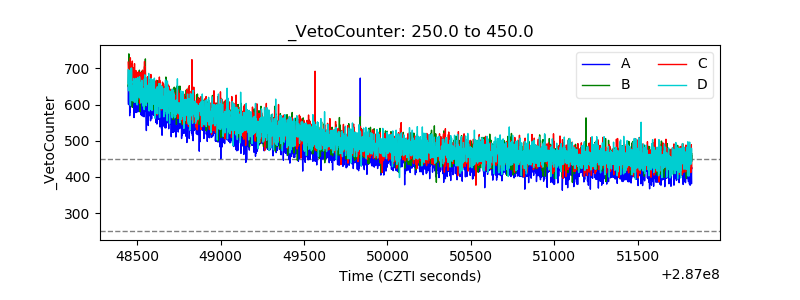 |