| Param | Original file | Final file |
|---|---|---|
| Filename | modeM0/AS1A05_084T04_9000002694_18138cztM0_level2.evt | modeM0/AS1A05_084T04_9000002694_18138cztM0_level2_quad_clean.evt |
| Size (bytes) | 547,931,520 | 106,188,480 |
| Size | 522.5 MB | 101.3 MB |
| Events in quadrant A | 3,262,845 | 723,485 |
| Events in quadrant B | 3,503,276 | 717,093 |
| Events in quadrant C | 3,244,003 | 683,025 |
| Events in quadrant D | 6,141,669 | 636,960 |
| Mode SS | |||
|---|---|---|---|
| Quadrant | BADHDUFLAG | Total packets | Discarded packets |
| A | 0 | 132 | 0 |
| B | 0 | 132 | 0 |
| C | 0 | 132 | 0 |
| D | 0 | 132 | 0 |
| Mode M0 | |||
|---|---|---|---|
| Quadrant | BADHDUFLAG | Total packets | Discarded packets |
| A | 0 | 13745 | 1 |
| B | 0 | 14454 | 1 |
| C | 0 | 13742 | 1 |
| D | 0 | 22787 | 1 |
| Mode M9 | |||
|---|---|---|---|
| Quadrant | BADHDUFLAG | Total packets | Discarded packets |
| A | 0 | 12 | 0 |
| B | 0 | 12 | 0 |
| C | 0 | 12 | 0 |
| D | 0 | 12 | 0 |
| Quadrant | Total seconds | Saturated seconds | Saturation percentage |
|---|---|---|---|
| A | 6529 | 67 | 1.026191% |
| B | 6529 | 97 | 1.485679% |
| C | 6530 | 67 | 1.026034% |
| D | 6530 | 606 | 9.280245% |
Noise dominated data is calculated using 1-second bins in cleaned event files. If a bin has >2000 counts, and if more than 50% of those come from <1% of pixels, then it is considered to be noise-dominated and hence unusable.
| Quadrant | # 1 sec bins | Bins with >0 counts | Bins with >2000 counts | High rate bins dominated by noise | Noise dominated (total time) | Noise dominated (detector-on time) | Marked lightcurve |
|---|---|---|---|---|---|---|---|
| A | 7679 | 6530 | 0 | 0 | 0.00% | 0.00% | 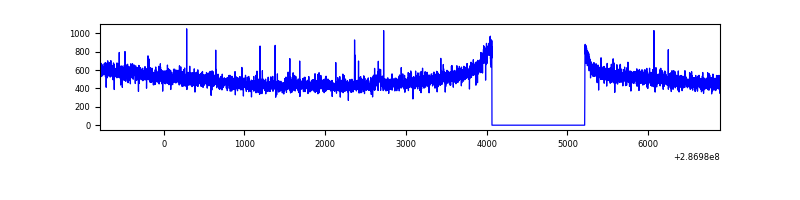 |
| B | 7679 | 6530 | 15 | 15 | 0.20% | 0.23% | 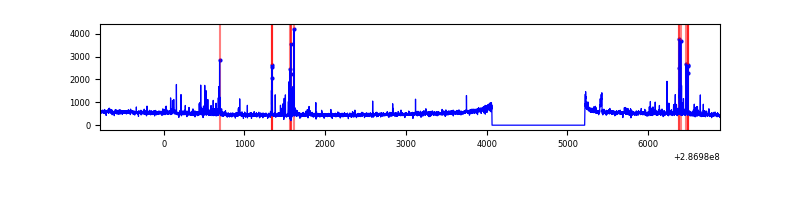 |
| C | 7680 | 6531 | 0 | 0 | 0.00% | 0.00% | 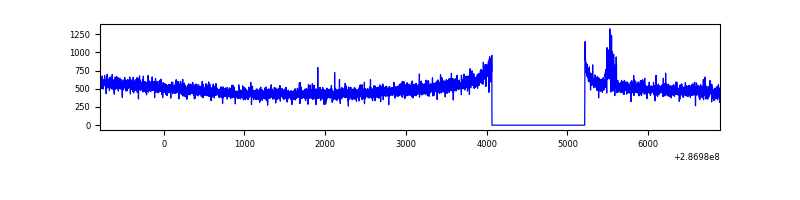 |
| D | 7680 | 6531 | 516 | 516 | 6.72% | 7.90% | 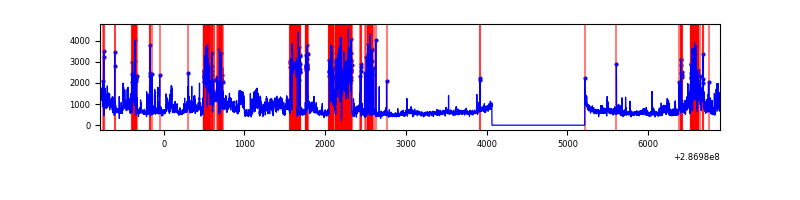 |
Top three noisy pixels from each quadrant. If the there are fewer than three noisy pixels in the level2.evt file, extra rows are filled as -1
| Pixel properties | Quadrant properties | ||||||
|---|---|---|---|---|---|---|---|
| Quadrant | DetID | PixID | Counts | Sigma | Mean | Median | Sigma |
| A | 0 | 226 | 7644 | 40.17 | 843 | 826 | 169.7 |
| A | 15 | 174 | 7057 | 36.71 | 843 | 826 | 169.7 |
| A | 12 | 194 | 6371 | 32.67 | 843 | 826 | 169.7 |
| B | 7 | 220 | 106469 | 671.28 | 832 | 815 | 157.4 |
| B | 0 | 197 | 37688 | 234.28 | 832 | 815 | 157.4 |
| B | 5 | 172 | 32008 | 198.19 | 832 | 815 | 157.4 |
| C | 14 | 238 | 122871 | 663.58 | 787 | 792 | 184.0 |
| C | 3 | 233 | 36097 | 191.91 | 787 | 792 | 184.0 |
| C | 5 | 218 | 10386 | 52.15 | 787 | 792 | 184.0 |
| D | 7 | 238 | 1297528 | 6767.54 | 782 | 761 | 191.6 |
| D | 12 | 110 | 1259573 | 6569.47 | 782 | 761 | 191.6 |
| D | 11 | 176 | 296756 | 1544.73 | 782 | 761 | 191.6 |
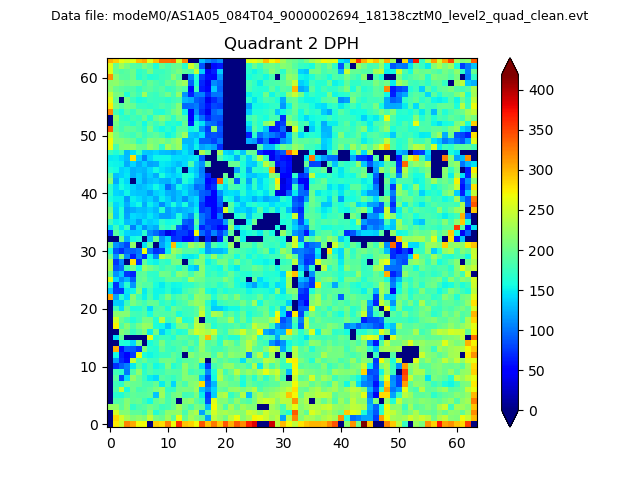
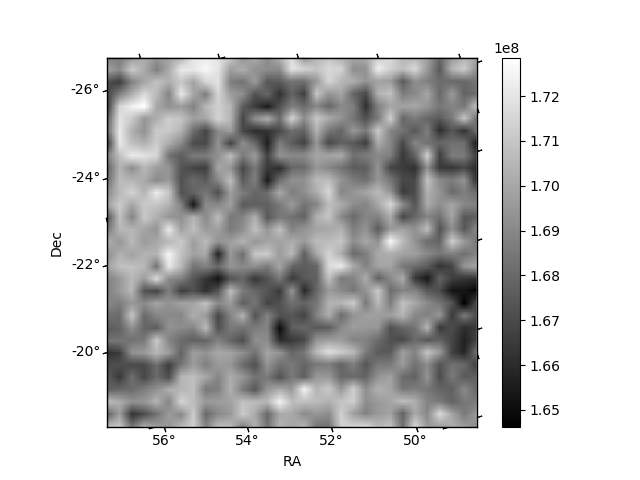
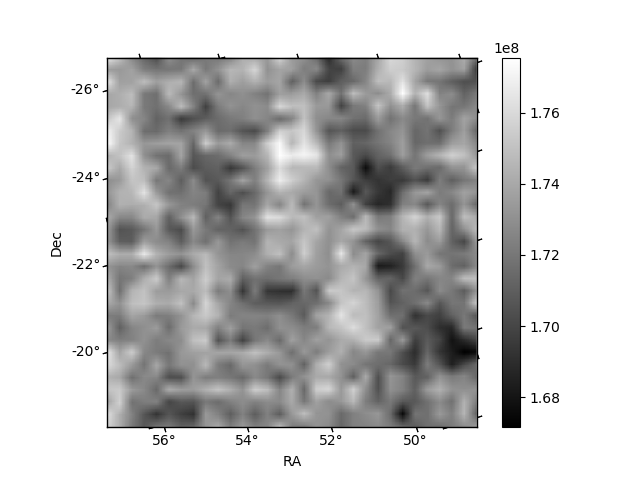
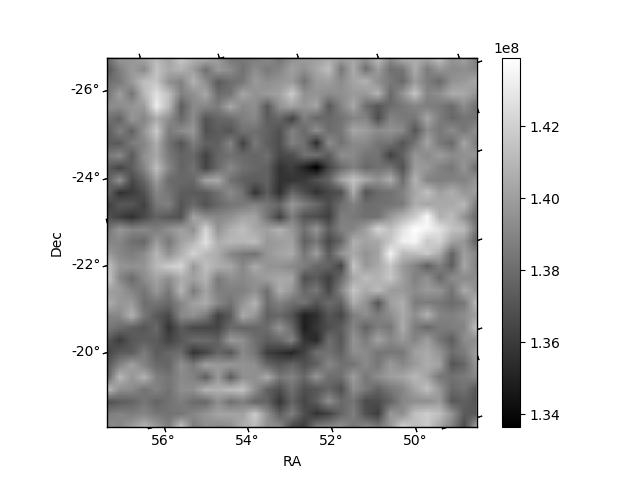
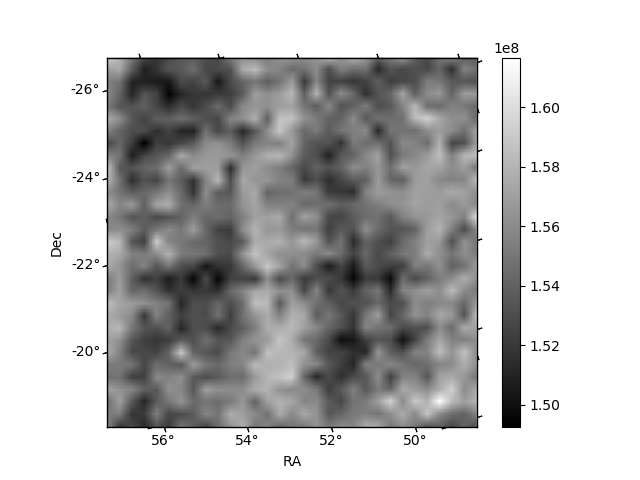
Histogram calculated using DETX and DETY for each event in the final _common_clean file
| Quadrant A | 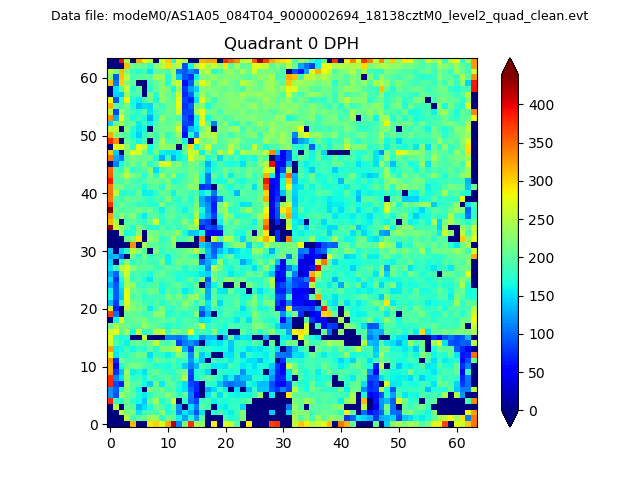 |
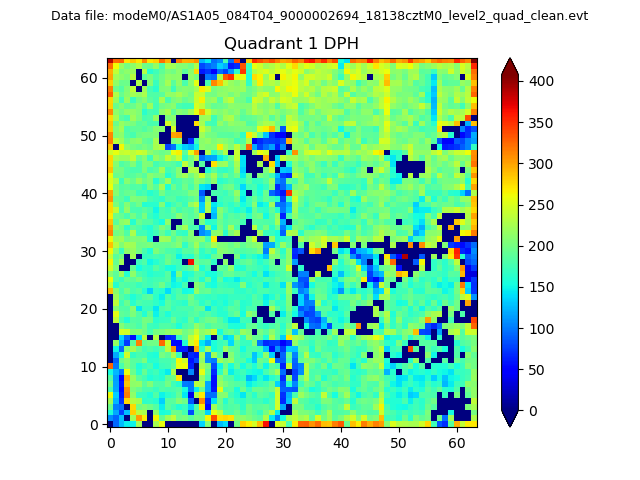 |
Quadrant B |
|---|---|---|---|
| Quadrant D | 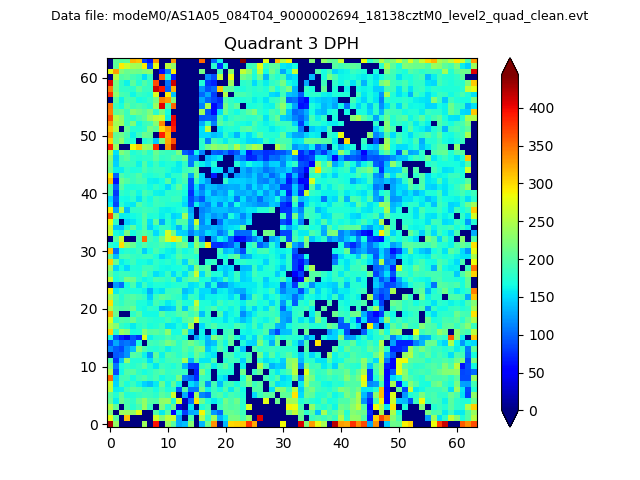 |
 |
Quadrant C |
| Plot type | Count rate plots | Images |
|---|---|---|
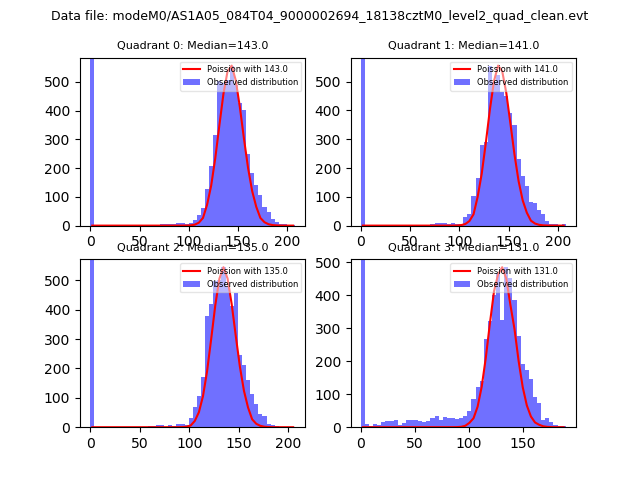
| Comparison with Poisson distribution Blue bars denote a histogram of data divided into 1 sec bins. Red curve is a Poisson curve with rate = median count rate of data. |
 |
 |
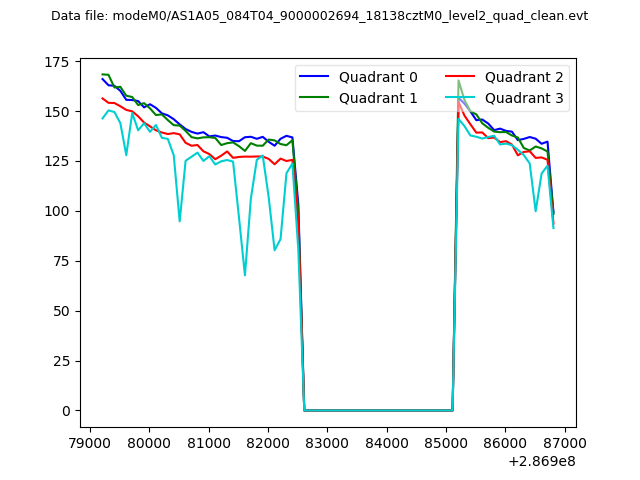
| Quadrant-wise count rates Data is divided into 100 sec bins |
 |
|
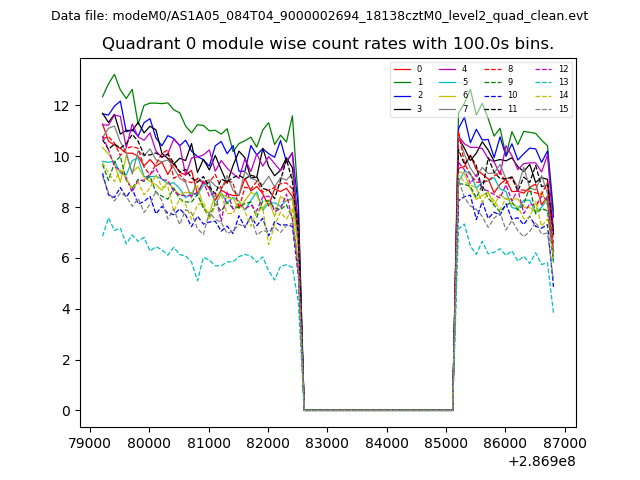
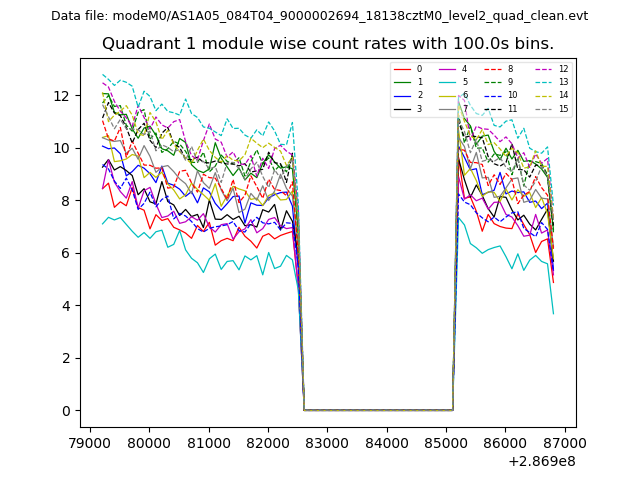
| Module-wise count rates for Quadrant A Data is divided into 100 sec bins |
 |
 |
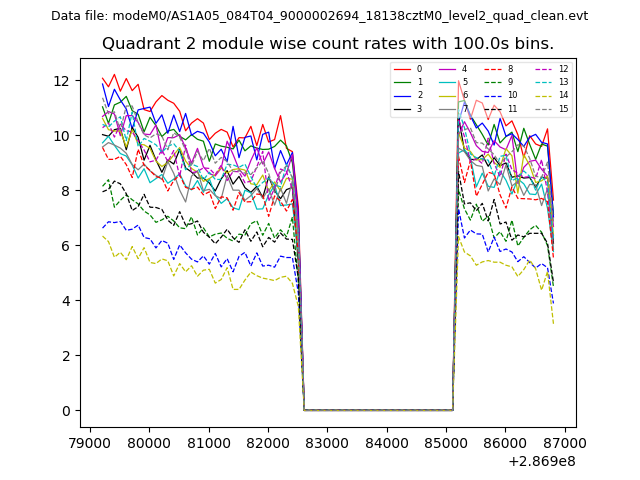
| Module-wise count rates for Quadrant B Data is divided into 100 sec bins |
 |
 |
| Module-wise count rates for Quadrant C Data is divided into 100 sec bins |
 |
 |
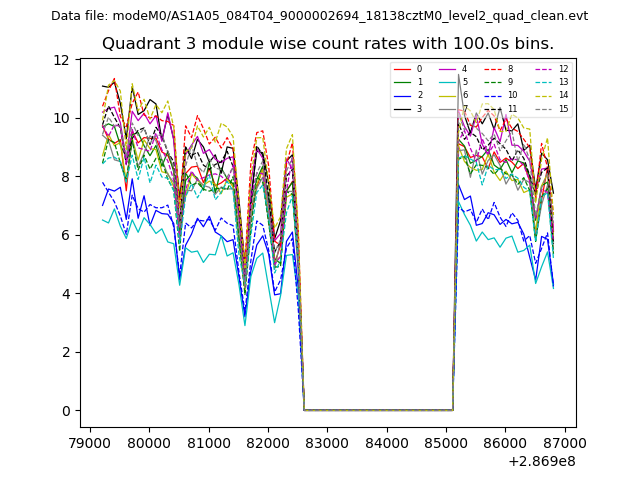
| Module-wise count rates for Quadrant D Data is divided into 100 sec bins |
 |
 |
| Parameter | Plot |
|---|---|
| CZT HV Monitor | 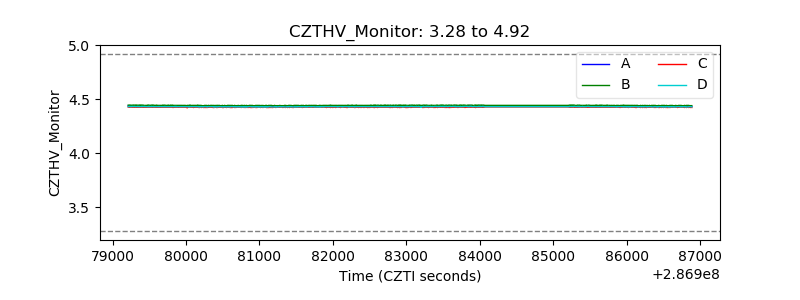 |
| D_VDD | 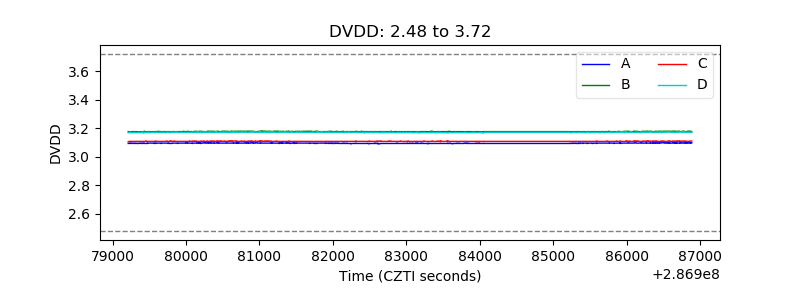 |
| Temperature 1 | 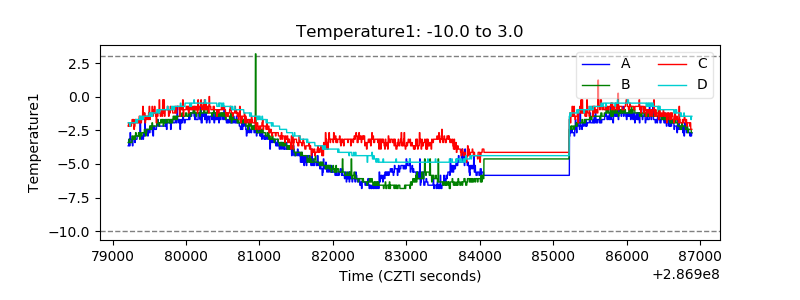 |
| Veto HV Monitor |  |
| Veto LLD | 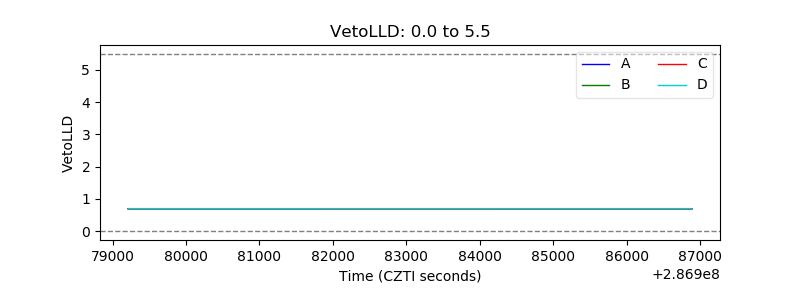 |
| Alpha Counter | 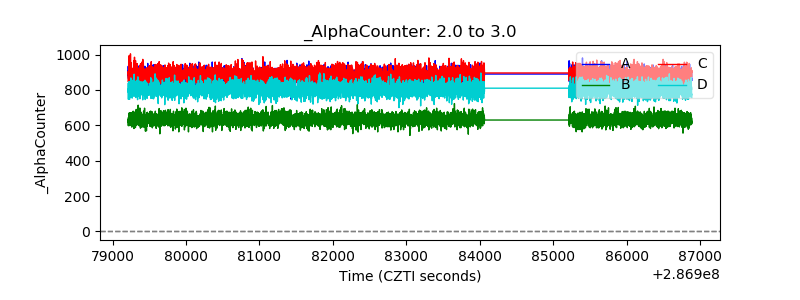 |
| _CPM_Rate | 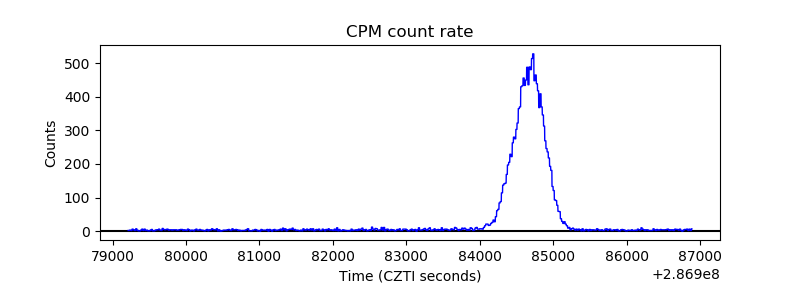 |
| CZT Counter | 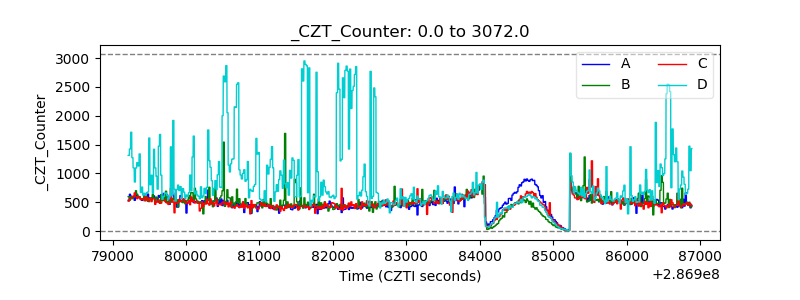 |
| +2.5 Volts monitor |  |
| +5 Volts monitor |  |
| _ROLL_ROT | 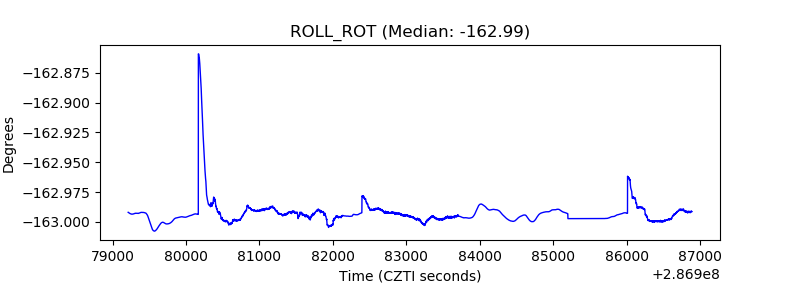 |
| _Roll_DEC | 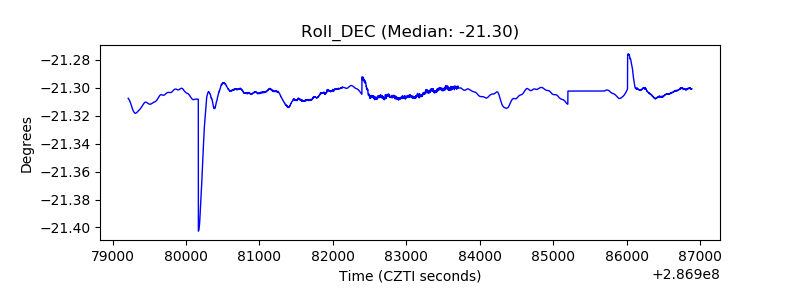 |
| _Roll_RA | 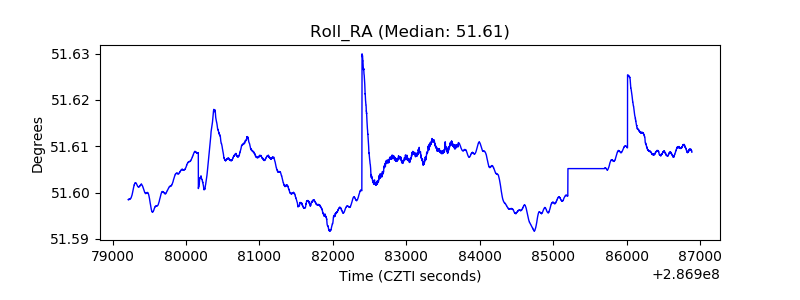 |
| Veto Counter | 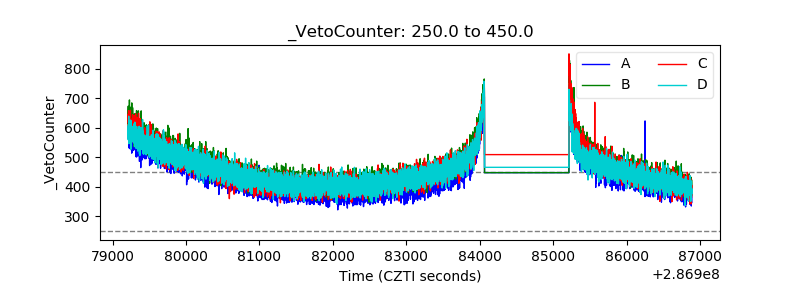 |